


 |
市場調查報告書
商品編碼
1344398
二尖瓣疾病治療藥物市場:依藥物類別、年齡層、通路2023-2032 年全球機會分析與產業預測Mitral Valve Disease Therapeutics Market By Drug class, By Age group, By Distribution channel : Global Opportunity Analysis and Industry Forecast, 2023-2032 |
||||||
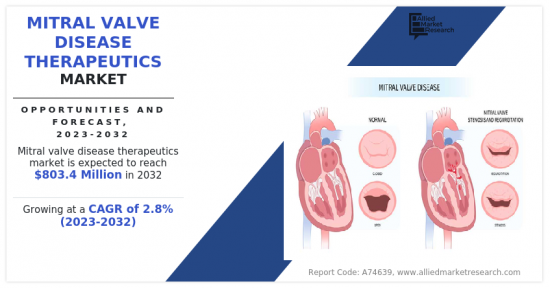
根據Allied Market Research發布的最新報告"二尖瓣疾病治療藥物市場",2022年二尖瓣疾病治療藥物市場價值為6.0774億美元,複合年增長率預計為2.8%到2032 年將達到8.034億美元。
推動二尖瓣疾病治療市場成長的主要因素是二尖瓣疾病盛行率的增加。 越來越多的患者被診斷出患有二尖瓣疾病,例如二尖瓣閉鎖不全、二尖瓣脫垂和二尖瓣狹窄。 例如,根據2022 年臨床醫學雜誌,二尖瓣關閉不全是歐洲第二常見的心臟瓣膜疾病,也是美國最常見的心臟瓣膜疾病,在 75 歲及以上人群中盛行率為 9.3%。 因此,二尖瓣疾病的盛行率不斷增加導致對治療藥物的需求並推動市場成長。
此外,二尖瓣疾病可由風濕熱、先天性心臟病等多種因素引起。 風濕熱是鏈球菌感染後發生的一種發炎性疾病,發炎可以擴散到心臟並損害心臟瓣膜,包括二尖瓣。 因此,這種損害會導致二尖瓣疾病,引起呼吸急促、疲勞、胸痛和心悸等症狀。 此外,先天性心臟病是一種從出生就存在的結構異常。 一些先天性心臟缺陷會影響二尖瓣的功能並引起二尖瓣疾病。 因此,BETA-受體阻斷劑、利尿劑和鈣通道阻斷劑等治療藥物被用來控制二尖瓣疾病的症狀,進而推動市場成長。
此外,二尖瓣置換手術數量的增加和治療藥物的採用預計將推動市場成長。 例如,抗凝血劑通常用於治療二尖瓣疾病並預防可能導致中風等嚴重併發症的血栓。 因此,抗凝血劑的採用不斷增加,推動了市場的成長。
此外,二尖瓣疾病發生率的增加是由於多種因素造成的,包括人口老化以及高血壓、糖尿病和肥胖等危險因子的增加。 隨著人口老化,罹患二尖瓣疾病的風險增加。 這是因為閥門隨著時間的推移會損壞或減弱,從而更容易發生故障。 此外,高血壓和肥胖等危險因子的增加也會增加二尖瓣疾病的風險。 此外,患者和醫療保健專業人員對二尖瓣疾病的認識不斷提高,導致了早期診斷和治療,從而推動了對醫療幹預措施的需求。 世界各國政府正在投資研究和開發二尖瓣疾病的新療法,這正在推動新療法的開發。
目錄
第一章簡介
第 2 章執行摘要
第三章市場概述
- 市場定義和範圍
- 主要發現
- 影響因素
- 主要投資機會
- 波特五力分析
- 市場動態
- 促進因素
- 二尖瓣疾病的盛行率不斷上升
- 越來越多地採用藥物來控制二尖瓣疾病症狀
- 老年人口增加
- 抑制因素
- 替代療法的可用性
- 機會
- 新興市場的成長機會
- 促進因素
- 新冠肺炎 (COVID-19) 造成的市場影響分析
第 4 章二尖瓣疾病治療藥物市場:依藥物類別劃分
- BETA受體阻斷劑
- 利尿劑
- 抗凝血劑
- 其他
第五章二尖瓣疾病治療藥物市場:依年齡層
- 55歲以下
- 55歲以上
第六章二尖瓣疾病治療藥物市場:依通路劃分
- 醫院藥房
- 藥局和零售藥局
- 線上提供者
第七章二尖瓣疾病治療藥物市場:依地區劃分
- 北美
- 美國
- 加拿大
- 墨西哥
- 歐洲
- 德國
- 法國
- 英國
- 義大利
- 西班牙
- 歐洲其他地區
- 亞太地區
- 日本
- 中國
- 印度
- 澳大利亞
- 韓國
- 其他亞太地區
- 拉丁美洲/中東/非洲
- 巴西
- 沙烏地阿拉伯
- 南非
- 其他領域
第八章競爭態勢
- 簡介
- 關鍵成功策略
- 10家主要公司的產品圖譜
- 競爭對手儀表板
- 競爭熱圖
- 2022 年主要公司的定位
第九章公司簡介
- Zydus Lifesciences Limited
- Pfizer Inc.
- Bayer AG
- Novartis AG
- Viatris Inc.
- Alembic Ltd
- Sun Pharmaceutical Industries Limited
- Cipla Ltd
- Teva Pharmaceutical Industries Ltd.
- Sanofi
According to a new report published by Allied Market Research, titled, "Mitral Valve Disease Therapeutics Market," The mitral valve disease therapeutics market was valued at $607.74 million in 2022, and is estimated to reach $803.4 million by 2032, growing at a CAGR of 2.8% from 2023 to 2032.
The major factor driving the growth of the mitral valve disease therapeutics market is increase in prevalence of mitral valve conditions. There has been an increase in the number of patients diagnosed with mitral valve diseases such as mitral regurgitation, mitral prolapse, and mitral stenosis. For instance, Journal of Clinical Medicine 2022, stated that, mitral regurgitation is the second most common valvular heart disease in Europe and the most common in the U.S., with a prevalence of 9.3% in the population aged over 75 years. Thus, rise in prevalence of mitral valve conditions results in demand for therapeutics and propels the market growth.
Further, mitral valve disease can be caused by various factors, such as rheumatic fever and congenital heart defects. Rheumatic fever is an inflammatory disease that can occur after a streptococcal infection, leading to inflammation that can spread to the heart, causing damage to the heart valves, including the mitral valve. Thus, this damage can lead to mitral valve disease, which can cause symptoms such as shortness of breath, fatigue, chest pain, and heart palpitations. In addition, congenital heart defects are structural abnormalities that are present at birth. Some congenital heart defects can affect the function of the mitral valve, leading to mitral valve disease. Thus, to manage the symptoms of mitral valve disease, therapeutics such as beta blockers, diuretics, and calcium channel blockers are prescribed, thereby driving the growth of the market.
Furthermore, rise in mitral valve replacement procedures and adoption of therapeutics is expected to propel the market growth. For instance, anticoagulants are commonly used to manage mitral valve disease and prevent blood clots, which can lead to serious complications such as stroke. Thus, rise in adoption of anticoagulants drives the market growth.
Further, rise in the incidence of mitral valve diseases can be attributed to several factors, such as aging population and increase in risk factors such as high blood pressure, diabetes, and obesity. As the population ages, the risk of developing mitral valve disease increases. This is because the valve can become damaged or weakened over time, making it more prone to malfunction. In addition, the rise in risk factors such as high blood pressure and obesity can increase the risk of developing mitral valve disease. Moreover, rise in awareness of mitral valve diseases among patients and healthcare professionals has led to earlier diagnosis and treatment, driving demand for medical interventions. Governments around the world are investing in research and development of new treatments for mitral valve disease, which has led to the development of novel therapeutics.
In addition, increased awareness about the symptoms and risk factors associated with mitral valve disease has led to more people seeking medical treatment for the condition, which has further driven the growth of the market. However, availability of other treatment options for mitral valve disease is expected to restrain the growth of mitral valve disease therapeutics market. There are several alternative treatment options available for mitral valve disease, such as surgical interventions and transcatheter procedures. These alternative options may be preferred by some patients or may be recommended by healthcare providers based on individual patient needs, thus restraining the growth of market.
The global mitral valve disease therapeutics market is segmented into drug class, age group, distribution channel, and region. On the basis of drug class, the market is categorized into beta blockers, diuretics, anticoagulants, and others. As per age group, the market is categorized into below 55 years and above 55 years. According to distribution channel, the market is segregated into hospital pharmacies, drug stores and retail pharmacies, and online providers. Region wise, the market is analyzed across North America (the U.S., Canada, and Mexico), Europe (Germany, France, the UK, Italy, Spain, and rest of Europe), Asia-Pacific (Japan, China, Australia, India, South Korea, and rest of Asia-Pacific), and LAMEA (Brazil, South Africa, Saudi Arabia, and rest of LAMEA).
Major key players that operate in the global mitral valve disease therapeutics market are Zydus Lifesciences Limited, Pfizer Inc., Bayer AG, Novartis AG, Viatris Inc., Alembic Ltd., Teva Pharmaceutical Industries Ltd., Cipla Ltd., Sun Pharmaceutical Industries Limited, and Sanofi.
Key Benefits For Stakeholders
- This report provides a quantitative analysis of the market segments, current trends, estimations, and dynamics of the mitral valve disease therapeutics market analysis from 2022 to 2032 to identify the prevailing mitral valve disease therapeutics market opportunities.
- The market research is offered along with information related to key drivers, restraints, and opportunities.
- Porter's five forces analysis highlights the potency of buyers and suppliers to enable stakeholders make profit-oriented business decisions and strengthen their supplier-buyer network.
- In-depth analysis of the mitral valve disease therapeutics market segmentation assists to determine the prevailing market opportunities.
- Major countries in each region are mapped according to their revenue contribution to the global market.
- Market player positioning facilitates benchmarking and provides a clear understanding of the present position of the market players.
- The report includes the analysis of the regional as well as global mitral valve disease therapeutics market trends, key players, market segments, application areas, and market growth strategies.
Key Market Segments
By Distribution channel
- Hospital pharmacies
- Drug store and retail pharmacies
- Online providers
By Drug class
- Beta blockers
- Diuretics
- Anticoagulants
- Others
By Age group
- Below 55 years
- Above 55 years
By Region
- North America
- U.S.
- Canada
- Mexico
- Europe
- Germany
- France
- UK
- Italy
- Spain
- Rest of Europe
- Asia-Pacific
- Japan
- China
- India
- Australia
- South Korea
- Rest of Asia-Pacific
- LAMEA
- Brazil
- Saudi Arabia
- South Africa
- Rest of LAMEA
Key Market Players:
- Bayer AG
- Novartis AG
- Teva Pharmaceutical Industries Ltd.
- Pfizer Inc.
- Viatris Inc.
- Sun Pharmaceutical Industries Limited
- Cipla Ltd
- Zydus Lifesciences Limited
- Sanofi
- Alembic Ltd
TABLE OF CONTENTS
CHAPTER 1: INTRODUCTION
- 1.1. Report description
- 1.2. Key market segments
- 1.3. Key benefits to the stakeholders
- 1.4. Research Methodology
- 1.4.1. Primary research
- 1.4.2. Secondary research
- 1.4.3. Analyst tools and models
CHAPTER 2: EXECUTIVE SUMMARY
- 2.1. CXO Perspective
CHAPTER 3: MARKET OVERVIEW
- 3.1. Market definition and scope
- 3.2. Key findings
- 3.2.1. Top impacting factors
- 3.2.2. Top investment pockets
- 3.3. Porter's five forces analysis
- 3.3.1. Bargaining power of suppliers
- 3.3.2. Bargaining power of buyers
- 3.3.3. Threat of substitutes
- 3.3.4. Threat of new entrants
- 3.3.5. Intensity of rivalry
- 3.4. Market dynamics
- 3.4.1. Drivers
- 3.4.1.1. Increasing prevalence of mitral valve diseases
- 3.4.1.2. Rise in adoption of pharmaceutical drugs to manage mitral valve disease symptoms
- 3.4.1.3. Rise in geriatric population
- 3.4.1. Drivers
- 3.4.2. Restraints
- 3.4.2.1. Availability of alternative treatment options
- 3.4.3. Opportunities
- 3.4.3.1. Growth opportunities in emerging markets
- 3.5. COVID-19 Impact Analysis on the market
CHAPTER 4: MITRAL VALVE DISEASE THERAPEUTICS MARKET, BY DRUG CLASS
- 4.1. Overview
- 4.1.1. Market size and forecast
- 4.2. Beta blockers
- 4.2.1. Key market trends, growth factors and opportunities
- 4.2.2. Market size and forecast, by region
- 4.2.3. Market share analysis by country
- 4.3. Diuretics
- 4.3.1. Key market trends, growth factors and opportunities
- 4.3.2. Market size and forecast, by region
- 4.3.3. Market share analysis by country
- 4.4. Anticoagulants
- 4.4.1. Key market trends, growth factors and opportunities
- 4.4.2. Market size and forecast, by region
- 4.4.3. Market share analysis by country
- 4.5. Others
- 4.5.1. Key market trends, growth factors and opportunities
- 4.5.2. Market size and forecast, by region
- 4.5.3. Market share analysis by country
CHAPTER 5: MITRAL VALVE DISEASE THERAPEUTICS MARKET, BY AGE GROUP
- 5.1. Overview
- 5.1.1. Market size and forecast
- 5.2. Below 55 years
- 5.2.1. Key market trends, growth factors and opportunities
- 5.2.2. Market size and forecast, by region
- 5.2.3. Market share analysis by country
- 5.3. Above 55 years
- 5.3.1. Key market trends, growth factors and opportunities
- 5.3.2. Market size and forecast, by region
- 5.3.3. Market share analysis by country
CHAPTER 6: MITRAL VALVE DISEASE THERAPEUTICS MARKET, BY DISTRIBUTION CHANNEL
- 6.1. Overview
- 6.1.1. Market size and forecast
- 6.2. Hospital pharmacies
- 6.2.1. Key market trends, growth factors and opportunities
- 6.2.2. Market size and forecast, by region
- 6.2.3. Market share analysis by country
- 6.3. Drug store and retail pharmacies
- 6.3.1. Key market trends, growth factors and opportunities
- 6.3.2. Market size and forecast, by region
- 6.3.3. Market share analysis by country
- 6.4. Online providers
- 6.4.1. Key market trends, growth factors and opportunities
- 6.4.2. Market size and forecast, by region
- 6.4.3. Market share analysis by country
CHAPTER 7: MITRAL VALVE DISEASE THERAPEUTICS MARKET, BY REGION
- 7.1. Overview
- 7.1.1. Market size and forecast By Region
- 7.2. North America
- 7.2.1. Key trends and opportunities
- 7.2.2. Market size and forecast, by Drug class
- 7.2.3. Market size and forecast, by Age group
- 7.2.4. Market size and forecast, by Distribution channel
- 7.2.5. Market size and forecast, by country
- 7.2.5.1. U.S.
- 7.2.5.1.1. Key market trends, growth factors and opportunities
- 7.2.5.1.2. Market size and forecast, by Drug class
- 7.2.5.1.3. Market size and forecast, by Age group
- 7.2.5.1.4. Market size and forecast, by Distribution channel
- 7.2.5.2. Canada
- 7.2.5.2.1. Key market trends, growth factors and opportunities
- 7.2.5.2.2. Market size and forecast, by Drug class
- 7.2.5.2.3. Market size and forecast, by Age group
- 7.2.5.2.4. Market size and forecast, by Distribution channel
- 7.2.5.3. Mexico
- 7.2.5.3.1. Key market trends, growth factors and opportunities
- 7.2.5.3.2. Market size and forecast, by Drug class
- 7.2.5.3.3. Market size and forecast, by Age group
- 7.2.5.3.4. Market size and forecast, by Distribution channel
- 7.3. Europe
- 7.3.1. Key trends and opportunities
- 7.3.2. Market size and forecast, by Drug class
- 7.3.3. Market size and forecast, by Age group
- 7.3.4. Market size and forecast, by Distribution channel
- 7.3.5. Market size and forecast, by country
- 7.3.5.1. Germany
- 7.3.5.1.1. Key market trends, growth factors and opportunities
- 7.3.5.1.2. Market size and forecast, by Drug class
- 7.3.5.1.3. Market size and forecast, by Age group
- 7.3.5.1.4. Market size and forecast, by Distribution channel
- 7.3.5.2. France
- 7.3.5.2.1. Key market trends, growth factors and opportunities
- 7.3.5.2.2. Market size and forecast, by Drug class
- 7.3.5.2.3. Market size and forecast, by Age group
- 7.3.5.2.4. Market size and forecast, by Distribution channel
- 7.3.5.3. UK
- 7.3.5.3.1. Key market trends, growth factors and opportunities
- 7.3.5.3.2. Market size and forecast, by Drug class
- 7.3.5.3.3. Market size and forecast, by Age group
- 7.3.5.3.4. Market size and forecast, by Distribution channel
- 7.3.5.4. Italy
- 7.3.5.4.1. Key market trends, growth factors and opportunities
- 7.3.5.4.2. Market size and forecast, by Drug class
- 7.3.5.4.3. Market size and forecast, by Age group
- 7.3.5.4.4. Market size and forecast, by Distribution channel
- 7.3.5.5. Spain
- 7.3.5.5.1. Key market trends, growth factors and opportunities
- 7.3.5.5.2. Market size and forecast, by Drug class
- 7.3.5.5.3. Market size and forecast, by Age group
- 7.3.5.5.4. Market size and forecast, by Distribution channel
- 7.3.5.6. Rest of Europe
- 7.3.5.6.1. Key market trends, growth factors and opportunities
- 7.3.5.6.2. Market size and forecast, by Drug class
- 7.3.5.6.3. Market size and forecast, by Age group
- 7.3.5.6.4. Market size and forecast, by Distribution channel
- 7.4. Asia-Pacific
- 7.4.1. Key trends and opportunities
- 7.4.2. Market size and forecast, by Drug class
- 7.4.3. Market size and forecast, by Age group
- 7.4.4. Market size and forecast, by Distribution channel
- 7.4.5. Market size and forecast, by country
- 7.4.5.1. Japan
- 7.4.5.1.1. Key market trends, growth factors and opportunities
- 7.4.5.1.2. Market size and forecast, by Drug class
- 7.4.5.1.3. Market size and forecast, by Age group
- 7.4.5.1.4. Market size and forecast, by Distribution channel
- 7.4.5.2. China
- 7.4.5.2.1. Key market trends, growth factors and opportunities
- 7.4.5.2.2. Market size and forecast, by Drug class
- 7.4.5.2.3. Market size and forecast, by Age group
- 7.4.5.2.4. Market size and forecast, by Distribution channel
- 7.4.5.3. India
- 7.4.5.3.1. Key market trends, growth factors and opportunities
- 7.4.5.3.2. Market size and forecast, by Drug class
- 7.4.5.3.3. Market size and forecast, by Age group
- 7.4.5.3.4. Market size and forecast, by Distribution channel
- 7.4.5.4. Australia
- 7.4.5.4.1. Key market trends, growth factors and opportunities
- 7.4.5.4.2. Market size and forecast, by Drug class
- 7.4.5.4.3. Market size and forecast, by Age group
- 7.4.5.4.4. Market size and forecast, by Distribution channel
- 7.4.5.5. South Korea
- 7.4.5.5.1. Key market trends, growth factors and opportunities
- 7.4.5.5.2. Market size and forecast, by Drug class
- 7.4.5.5.3. Market size and forecast, by Age group
- 7.4.5.5.4. Market size and forecast, by Distribution channel
- 7.4.5.6. Rest of Asia-Pacific
- 7.4.5.6.1. Key market trends, growth factors and opportunities
- 7.4.5.6.2. Market size and forecast, by Drug class
- 7.4.5.6.3. Market size and forecast, by Age group
- 7.4.5.6.4. Market size and forecast, by Distribution channel
- 7.5. LAMEA
- 7.5.1. Key trends and opportunities
- 7.5.2. Market size and forecast, by Drug class
- 7.5.3. Market size and forecast, by Age group
- 7.5.4. Market size and forecast, by Distribution channel
- 7.5.5. Market size and forecast, by country
- 7.5.5.1. Brazil
- 7.5.5.1.1. Key market trends, growth factors and opportunities
- 7.5.5.1.2. Market size and forecast, by Drug class
- 7.5.5.1.3. Market size and forecast, by Age group
- 7.5.5.1.4. Market size and forecast, by Distribution channel
- 7.5.5.2. Saudi Arabia
- 7.5.5.2.1. Key market trends, growth factors and opportunities
- 7.5.5.2.2. Market size and forecast, by Drug class
- 7.5.5.2.3. Market size and forecast, by Age group
- 7.5.5.2.4. Market size and forecast, by Distribution channel
- 7.5.5.3. South Africa
- 7.5.5.3.1. Key market trends, growth factors and opportunities
- 7.5.5.3.2. Market size and forecast, by Drug class
- 7.5.5.3.3. Market size and forecast, by Age group
- 7.5.5.3.4. Market size and forecast, by Distribution channel
- 7.5.5.4. Rest of LAMEA
- 7.5.5.4.1. Key market trends, growth factors and opportunities
- 7.5.5.4.2. Market size and forecast, by Drug class
- 7.5.5.4.3. Market size and forecast, by Age group
- 7.5.5.4.4. Market size and forecast, by Distribution channel
CHAPTER 8: COMPETITIVE LANDSCAPE
- 8.1. Introduction
- 8.2. Top winning strategies
- 8.3. Product Mapping of Top 10 Player
- 8.4. Competitive Dashboard
- 8.5. Competitive Heatmap
- 8.6. Top player positioning, 2022
CHAPTER 9: COMPANY PROFILES
- 9.1. Zydus Lifesciences Limited
- 9.1.1. Company overview
- 9.1.2. Key Executives
- 9.1.3. Company snapshot
- 9.1.4. Operating business segments
- 9.1.5. Product portfolio
- 9.1.6. Business performance
- 9.2. Pfizer Inc.
- 9.2.1. Company overview
- 9.2.2. Key Executives
- 9.2.3. Company snapshot
- 9.2.4. Operating business segments
- 9.2.5. Product portfolio
- 9.2.6. Business performance
- 9.3. Bayer AG
- 9.3.1. Company overview
- 9.3.2. Key Executives
- 9.3.3. Company snapshot
- 9.3.4. Operating business segments
- 9.3.5. Product portfolio
- 9.3.6. Business performance
- 9.4. Novartis AG
- 9.4.1. Company overview
- 9.4.2. Key Executives
- 9.4.3. Company snapshot
- 9.4.4. Operating business segments
- 9.4.5. Product portfolio
- 9.4.6. Business performance
- 9.5. Viatris Inc.
- 9.5.1. Company overview
- 9.5.2. Key Executives
- 9.5.3. Company snapshot
- 9.5.4. Operating business segments
- 9.5.5. Product portfolio
- 9.5.6. Business performance
- 9.6. Alembic Ltd
- 9.6.1. Company overview
- 9.6.2. Key Executives
- 9.6.3. Company snapshot
- 9.6.4. Operating business segments
- 9.6.5. Product portfolio
- 9.6.6. Business performance
- 9.7. Sun Pharmaceutical Industries Limited
- 9.7.1. Company overview
- 9.7.2. Key Executives
- 9.7.3. Company snapshot
- 9.7.4. Operating business segments
- 9.7.5. Product portfolio
- 9.7.6. Business performance
- 9.8. Cipla Ltd
- 9.8.1. Company overview
- 9.8.2. Key Executives
- 9.8.3. Company snapshot
- 9.8.4. Operating business segments
- 9.8.5. Product portfolio
- 9.8.6. Business performance
- 9.9. Teva Pharmaceutical Industries Ltd.
- 9.9.1. Company overview
- 9.9.2. Key Executives
- 9.9.3. Company snapshot
- 9.9.4. Operating business segments
- 9.9.5. Product portfolio
- 9.9.6. Business performance
- 9.10. Sanofi
- 9.10.1. Company overview
- 9.10.2. Key Executives
- 9.10.3. Company snapshot
- 9.10.4. Operating business segments
- 9.10.5. Product portfolio
- 9.10.6. Business performance
LIST OF TABLES
- TABLE 01. GLOBAL MITRAL VALVE DISEASE THERAPEUTICS MARKET, BY DRUG CLASS, 2022-2032 ($MILLION)
- TABLE 02. MITRAL VALVE DISEASE THERAPEUTICS MARKET FOR BETA BLOCKERS, BY REGION, 2022-2032 ($MILLION)
- TABLE 03. MITRAL VALVE DISEASE THERAPEUTICS MARKET FOR DIURETICS, BY REGION, 2022-2032 ($MILLION)
- TABLE 04. MITRAL VALVE DISEASE THERAPEUTICS MARKET FOR ANTICOAGULANTS, BY REGION, 2022-2032 ($MILLION)
- TABLE 05. MITRAL VALVE DISEASE THERAPEUTICS MARKET FOR OTHERS, BY REGION, 2022-2032 ($MILLION)
- TABLE 06. GLOBAL MITRAL VALVE DISEASE THERAPEUTICS MARKET, BY AGE GROUP, 2022-2032 ($MILLION)
- TABLE 07. MITRAL VALVE DISEASE THERAPEUTICS MARKET FOR BELOW 55 YEARS, BY REGION, 2022-2032 ($MILLION)
- TABLE 08. MITRAL VALVE DISEASE THERAPEUTICS MARKET FOR ABOVE 55 YEARS, BY REGION, 2022-2032 ($MILLION)
- TABLE 09. GLOBAL MITRAL VALVE DISEASE THERAPEUTICS MARKET, BY DISTRIBUTION CHANNEL, 2022-2032 ($MILLION)
- TABLE 10. MITRAL VALVE DISEASE THERAPEUTICS MARKET FOR HOSPITAL PHARMACIES, BY REGION, 2022-2032 ($MILLION)
- TABLE 11. MITRAL VALVE DISEASE THERAPEUTICS MARKET FOR DRUG STORE AND RETAIL PHARMACIES, BY REGION, 2022-2032 ($MILLION)
- TABLE 12. MITRAL VALVE DISEASE THERAPEUTICS MARKET FOR ONLINE PROVIDERS, BY REGION, 2022-2032 ($MILLION)
- TABLE 13. MITRAL VALVE DISEASE THERAPEUTICS MARKET, BY REGION, 2022-2032 ($MILLION)
- TABLE 14. NORTH AMERICA MITRAL VALVE DISEASE THERAPEUTICS MARKET, BY DRUG CLASS, 2022-2032 ($MILLION)
- TABLE 15. NORTH AMERICA MITRAL VALVE DISEASE THERAPEUTICS MARKET, BY AGE GROUP, 2022-2032 ($MILLION)
- TABLE 16. NORTH AMERICA MITRAL VALVE DISEASE THERAPEUTICS MARKET, BY DISTRIBUTION CHANNEL, 2022-2032 ($MILLION)
- TABLE 17. NORTH AMERICA MITRAL VALVE DISEASE THERAPEUTICS MARKET, BY COUNTRY, 2022-2032 ($MILLION)
- TABLE 18. U.S. MITRAL VALVE DISEASE THERAPEUTICS MARKET, BY DRUG CLASS, 2022-2032 ($MILLION)
- TABLE 19. U.S. MITRAL VALVE DISEASE THERAPEUTICS MARKET, BY AGE GROUP, 2022-2032 ($MILLION)
- TABLE 20. U.S. MITRAL VALVE DISEASE THERAPEUTICS MARKET, BY DISTRIBUTION CHANNEL, 2022-2032 ($MILLION)
- TABLE 21. CANADA MITRAL VALVE DISEASE THERAPEUTICS MARKET, BY DRUG CLASS, 2022-2032 ($MILLION)
- TABLE 22. CANADA MITRAL VALVE DISEASE THERAPEUTICS MARKET, BY AGE GROUP, 2022-2032 ($MILLION)
- TABLE 23. CANADA MITRAL VALVE DISEASE THERAPEUTICS MARKET, BY DISTRIBUTION CHANNEL, 2022-2032 ($MILLION)
- TABLE 24. MEXICO MITRAL VALVE DISEASE THERAPEUTICS MARKET, BY DRUG CLASS, 2022-2032 ($MILLION)
- TABLE 25. MEXICO MITRAL VALVE DISEASE THERAPEUTICS MARKET, BY AGE GROUP, 2022-2032 ($MILLION)
- TABLE 26. MEXICO MITRAL VALVE DISEASE THERAPEUTICS MARKET, BY DISTRIBUTION CHANNEL, 2022-2032 ($MILLION)
- TABLE 27. EUROPE MITRAL VALVE DISEASE THERAPEUTICS MARKET, BY DRUG CLASS, 2022-2032 ($MILLION)
- TABLE 28. EUROPE MITRAL VALVE DISEASE THERAPEUTICS MARKET, BY AGE GROUP, 2022-2032 ($MILLION)
- TABLE 29. EUROPE MITRAL VALVE DISEASE THERAPEUTICS MARKET, BY DISTRIBUTION CHANNEL, 2022-2032 ($MILLION)
- TABLE 30. EUROPE MITRAL VALVE DISEASE THERAPEUTICS MARKET, BY COUNTRY, 2022-2032 ($MILLION)
- TABLE 31. GERMANY MITRAL VALVE DISEASE THERAPEUTICS MARKET, BY DRUG CLASS, 2022-2032 ($MILLION)
- TABLE 32. GERMANY MITRAL VALVE DISEASE THERAPEUTICS MARKET, BY AGE GROUP, 2022-2032 ($MILLION)
- TABLE 33. GERMANY MITRAL VALVE DISEASE THERAPEUTICS MARKET, BY DISTRIBUTION CHANNEL, 2022-2032 ($MILLION)
- TABLE 34. FRANCE MITRAL VALVE DISEASE THERAPEUTICS MARKET, BY DRUG CLASS, 2022-2032 ($MILLION)
- TABLE 35. FRANCE MITRAL VALVE DISEASE THERAPEUTICS MARKET, BY AGE GROUP, 2022-2032 ($MILLION)
- TABLE 36. FRANCE MITRAL VALVE DISEASE THERAPEUTICS MARKET, BY DISTRIBUTION CHANNEL, 2022-2032 ($MILLION)
- TABLE 37. UK MITRAL VALVE DISEASE THERAPEUTICS MARKET, BY DRUG CLASS, 2022-2032 ($MILLION)
- TABLE 38. UK MITRAL VALVE DISEASE THERAPEUTICS MARKET, BY AGE GROUP, 2022-2032 ($MILLION)
- TABLE 39. UK MITRAL VALVE DISEASE THERAPEUTICS MARKET, BY DISTRIBUTION CHANNEL, 2022-2032 ($MILLION)
- TABLE 40. ITALY MITRAL VALVE DISEASE THERAPEUTICS MARKET, BY DRUG CLASS, 2022-2032 ($MILLION)
- TABLE 41. ITALY MITRAL VALVE DISEASE THERAPEUTICS MARKET, BY AGE GROUP, 2022-2032 ($MILLION)
- TABLE 42. ITALY MITRAL VALVE DISEASE THERAPEUTICS MARKET, BY DISTRIBUTION CHANNEL, 2022-2032 ($MILLION)
- TABLE 43. SPAIN MITRAL VALVE DISEASE THERAPEUTICS MARKET, BY DRUG CLASS, 2022-2032 ($MILLION)
- TABLE 44. SPAIN MITRAL VALVE DISEASE THERAPEUTICS MARKET, BY AGE GROUP, 2022-2032 ($MILLION)
- TABLE 45. SPAIN MITRAL VALVE DISEASE THERAPEUTICS MARKET, BY DISTRIBUTION CHANNEL, 2022-2032 ($MILLION)
- TABLE 46. REST OF EUROPE MITRAL VALVE DISEASE THERAPEUTICS MARKET, BY DRUG CLASS, 2022-2032 ($MILLION)
- TABLE 47. REST OF EUROPE MITRAL VALVE DISEASE THERAPEUTICS MARKET, BY AGE GROUP, 2022-2032 ($MILLION)
- TABLE 48. REST OF EUROPE MITRAL VALVE DISEASE THERAPEUTICS MARKET, BY DISTRIBUTION CHANNEL, 2022-2032 ($MILLION)
- TABLE 49. ASIA-PACIFIC MITRAL VALVE DISEASE THERAPEUTICS MARKET, BY DRUG CLASS, 2022-2032 ($MILLION)
- TABLE 50. ASIA-PACIFIC MITRAL VALVE DISEASE THERAPEUTICS MARKET, BY AGE GROUP, 2022-2032 ($MILLION)
- TABLE 51. ASIA-PACIFIC MITRAL VALVE DISEASE THERAPEUTICS MARKET, BY DISTRIBUTION CHANNEL, 2022-2032 ($MILLION)
- TABLE 52. ASIA-PACIFIC MITRAL VALVE DISEASE THERAPEUTICS MARKET, BY COUNTRY, 2022-2032 ($MILLION)
- TABLE 53. JAPAN MITRAL VALVE DISEASE THERAPEUTICS MARKET, BY DRUG CLASS, 2022-2032 ($MILLION)
- TABLE 54. JAPAN MITRAL VALVE DISEASE THERAPEUTICS MARKET, BY AGE GROUP, 2022-2032 ($MILLION)
- TABLE 55. JAPAN MITRAL VALVE DISEASE THERAPEUTICS MARKET, BY DISTRIBUTION CHANNEL, 2022-2032 ($MILLION)
- TABLE 56. CHINA MITRAL VALVE DISEASE THERAPEUTICS MARKET, BY DRUG CLASS, 2022-2032 ($MILLION)
- TABLE 57. CHINA MITRAL VALVE DISEASE THERAPEUTICS MARKET, BY AGE GROUP, 2022-2032 ($MILLION)
- TABLE 58. CHINA MITRAL VALVE DISEASE THERAPEUTICS MARKET, BY DISTRIBUTION CHANNEL, 2022-2032 ($MILLION)
- TABLE 59. INDIA MITRAL VALVE DISEASE THERAPEUTICS MARKET, BY DRUG CLASS, 2022-2032 ($MILLION)
- TABLE 60. INDIA MITRAL VALVE DISEASE THERAPEUTICS MARKET, BY AGE GROUP, 2022-2032 ($MILLION)
- TABLE 61. INDIA MITRAL VALVE DISEASE THERAPEUTICS MARKET, BY DISTRIBUTION CHANNEL, 2022-2032 ($MILLION)
- TABLE 62. AUSTRALIA MITRAL VALVE DISEASE THERAPEUTICS MARKET, BY DRUG CLASS, 2022-2032 ($MILLION)
- TABLE 63. AUSTRALIA MITRAL VALVE DISEASE THERAPEUTICS MARKET, BY AGE GROUP, 2022-2032 ($MILLION)
- TABLE 64. AUSTRALIA MITRAL VALVE DISEASE THERAPEUTICS MARKET, BY DISTRIBUTION CHANNEL, 2022-2032 ($MILLION)
- TABLE 65. SOUTH KOREA MITRAL VALVE DISEASE THERAPEUTICS MARKET, BY DRUG CLASS, 2022-2032 ($MILLION)
- TABLE 66. SOUTH KOREA MITRAL VALVE DISEASE THERAPEUTICS MARKET, BY AGE GROUP, 2022-2032 ($MILLION)
- TABLE 67. SOUTH KOREA MITRAL VALVE DISEASE THERAPEUTICS MARKET, BY DISTRIBUTION CHANNEL, 2022-2032 ($MILLION)
- TABLE 68. REST OF ASIA-PACIFIC MITRAL VALVE DISEASE THERAPEUTICS MARKET, BY DRUG CLASS, 2022-2032 ($MILLION)
- TABLE 69. REST OF ASIA-PACIFIC MITRAL VALVE DISEASE THERAPEUTICS MARKET, BY AGE GROUP, 2022-2032 ($MILLION)
- TABLE 70. REST OF ASIA-PACIFIC MITRAL VALVE DISEASE THERAPEUTICS MARKET, BY DISTRIBUTION CHANNEL, 2022-2032 ($MILLION)
- TABLE 71. LAMEA MITRAL VALVE DISEASE THERAPEUTICS MARKET, BY DRUG CLASS, 2022-2032 ($MILLION)
- TABLE 72. LAMEA MITRAL VALVE DISEASE THERAPEUTICS MARKET, BY AGE GROUP, 2022-2032 ($MILLION)
- TABLE 73. LAMEA MITRAL VALVE DISEASE THERAPEUTICS MARKET, BY DISTRIBUTION CHANNEL, 2022-2032 ($MILLION)
- TABLE 74. LAMEA MITRAL VALVE DISEASE THERAPEUTICS MARKET, BY COUNTRY, 2022-2032 ($MILLION)
- TABLE 75. BRAZIL MITRAL VALVE DISEASE THERAPEUTICS MARKET, BY DRUG CLASS, 2022-2032 ($MILLION)
- TABLE 76. BRAZIL MITRAL VALVE DISEASE THERAPEUTICS MARKET, BY AGE GROUP, 2022-2032 ($MILLION)
- TABLE 77. BRAZIL MITRAL VALVE DISEASE THERAPEUTICS MARKET, BY DISTRIBUTION CHANNEL, 2022-2032 ($MILLION)
- TABLE 78. SAUDI ARABIA MITRAL VALVE DISEASE THERAPEUTICS MARKET, BY DRUG CLASS, 2022-2032 ($MILLION)
- TABLE 79. SAUDI ARABIA MITRAL VALVE DISEASE THERAPEUTICS MARKET, BY AGE GROUP, 2022-2032 ($MILLION)
- TABLE 80. SAUDI ARABIA MITRAL VALVE DISEASE THERAPEUTICS MARKET, BY DISTRIBUTION CHANNEL, 2022-2032 ($MILLION)
- TABLE 81. SOUTH AFRICA MITRAL VALVE DISEASE THERAPEUTICS MARKET, BY DRUG CLASS, 2022-2032 ($MILLION)
- TABLE 82. SOUTH AFRICA MITRAL VALVE DISEASE THERAPEUTICS MARKET, BY AGE GROUP, 2022-2032 ($MILLION)
- TABLE 83. SOUTH AFRICA MITRAL VALVE DISEASE THERAPEUTICS MARKET, BY DISTRIBUTION CHANNEL, 2022-2032 ($MILLION)
- TABLE 84. REST OF LAMEA MITRAL VALVE DISEASE THERAPEUTICS MARKET, BY DRUG CLASS, 2022-2032 ($MILLION)
- TABLE 85. REST OF LAMEA MITRAL VALVE DISEASE THERAPEUTICS MARKET, BY AGE GROUP, 2022-2032 ($MILLION)
- TABLE 86. REST OF LAMEA MITRAL VALVE DISEASE THERAPEUTICS MARKET, BY DISTRIBUTION CHANNEL, 2022-2032 ($MILLION)
- TABLE 87. ZYDUS LIFESCIENCES LIMITED: KEY EXECUTIVES
- TABLE 88. ZYDUS LIFESCIENCES LIMITED: COMPANY SNAPSHOT
- TABLE 89. ZYDUS LIFESCIENCES LIMITED: PRODUCT SEGMENTS
- TABLE 90. ZYDUS LIFESCIENCES LIMITED: PRODUCT PORTFOLIO
- TABLE 91. PFIZER INC.: KEY EXECUTIVES
- TABLE 92. PFIZER INC.: COMPANY SNAPSHOT
- TABLE 93. PFIZER INC.: PRODUCT SEGMENTS
- TABLE 94. PFIZER INC.: PRODUCT PORTFOLIO
- TABLE 95. BAYER AG: KEY EXECUTIVES
- TABLE 96. BAYER AG: COMPANY SNAPSHOT
- TABLE 97. BAYER AG: PRODUCT SEGMENTS
- TABLE 98. BAYER AG: PRODUCT PORTFOLIO
- TABLE 99. NOVARTIS AG: KEY EXECUTIVES
- TABLE 100. NOVARTIS AG: COMPANY SNAPSHOT
- TABLE 101. NOVARTIS AG: PRODUCT SEGMENTS
- TABLE 102. NOVARTIS AG: PRODUCT PORTFOLIO
- TABLE 103. VIATRIS INC.: KEY EXECUTIVES
- TABLE 104. VIATRIS INC.: COMPANY SNAPSHOT
- TABLE 105. VIATRIS INC.: PRODUCT SEGMENTS
- TABLE 106. VIATRIS INC.: PRODUCT PORTFOLIO
- TABLE 107. ALEMBIC LTD: KEY EXECUTIVES
- TABLE 108. ALEMBIC LTD: COMPANY SNAPSHOT
- TABLE 109. ALEMBIC LTD: PRODUCT SEGMENTS
- TABLE 110. ALEMBIC LTD: PRODUCT PORTFOLIO
- TABLE 111. SUN PHARMACEUTICAL INDUSTRIES LIMITED: KEY EXECUTIVES
- TABLE 112. SUN PHARMACEUTICAL INDUSTRIES LIMITED: COMPANY SNAPSHOT
- TABLE 113. SUN PHARMACEUTICAL INDUSTRIES LIMITED: PRODUCT SEGMENTS
- TABLE 114. SUN PHARMACEUTICAL INDUSTRIES LIMITED: PRODUCT PORTFOLIO
- TABLE 115. CIPLA LTD: KEY EXECUTIVES
- TABLE 116. CIPLA LTD: COMPANY SNAPSHOT
- TABLE 117. CIPLA LTD: PRODUCT SEGMENTS
- TABLE 118. CIPLA LTD: PRODUCT PORTFOLIO
- TABLE 119. TEVA PHARMACEUTICAL INDUSTRIES LTD.: KEY EXECUTIVES
- TABLE 120. TEVA PHARMACEUTICAL INDUSTRIES LTD.: COMPANY SNAPSHOT
- TABLE 121. TEVA PHARMACEUTICAL INDUSTRIES LTD.: PRODUCT SEGMENTS
- TABLE 122. TEVA PHARMACEUTICAL INDUSTRIES LTD.: PRODUCT PORTFOLIO
- TABLE 123. SANOFI: KEY EXECUTIVES
- TABLE 124. SANOFI: COMPANY SNAPSHOT
- TABLE 125. SANOFI: PRODUCT SEGMENTS
- TABLE 126. SANOFI: PRODUCT PORTFOLIO
LIST OF FIGURES
- FIGURE 01. MITRAL VALVE DISEASE THERAPEUTICS MARKET, 2022-2032
- FIGURE 02. SEGMENTATION OF MITRAL VALVE DISEASE THERAPEUTICS MARKET, 2022-2032
- FIGURE 03. TOP INVESTMENT POCKETS IN MITRAL VALVE DISEASE THERAPEUTICS MARKET (2023-2032)
- FIGURE 04. LOW BARGAINING POWER OF SUPPLIERS
- FIGURE 05. LOW BARGAINING POWER OF BUYERS
- FIGURE 06. LOW THREAT OF SUBSTITUTES
- FIGURE 07. LOW THREAT OF NEW ENTRANTS
- FIGURE 08. LOW INTENSITY OF RIVALRY
- FIGURE 09. DRIVERS, RESTRAINTS AND OPPORTUNITIES: GLOBALMITRAL VALVE DISEASE THERAPEUTICS MARKET
- FIGURE 10. MITRAL VALVE DISEASE THERAPEUTICS MARKET, BY DRUG CLASS, 2022(%)
- FIGURE 11. COMPARATIVE SHARE ANALYSIS OF MITRAL VALVE DISEASE THERAPEUTICS MARKET FOR BETA BLOCKERS, BY COUNTRY 2022 AND 2032(%)
- FIGURE 12. COMPARATIVE SHARE ANALYSIS OF MITRAL VALVE DISEASE THERAPEUTICS MARKET FOR DIURETICS, BY COUNTRY 2022 AND 2032(%)
- FIGURE 13. COMPARATIVE SHARE ANALYSIS OF MITRAL VALVE DISEASE THERAPEUTICS MARKET FOR ANTICOAGULANTS, BY COUNTRY 2022 AND 2032(%)
- FIGURE 14. COMPARATIVE SHARE ANALYSIS OF MITRAL VALVE DISEASE THERAPEUTICS MARKET FOR OTHERS, BY COUNTRY 2022 AND 2032(%)
- FIGURE 15. MITRAL VALVE DISEASE THERAPEUTICS MARKET, BY AGE GROUP, 2022(%)
- FIGURE 16. COMPARATIVE SHARE ANALYSIS OF MITRAL VALVE DISEASE THERAPEUTICS MARKET FOR BELOW 55 YEARS, BY COUNTRY 2022 AND 2032(%)
- FIGURE 17. COMPARATIVE SHARE ANALYSIS OF MITRAL VALVE DISEASE THERAPEUTICS MARKET FOR ABOVE 55 YEARS, BY COUNTRY 2022 AND 2032(%)
- FIGURE 18. MITRAL VALVE DISEASE THERAPEUTICS MARKET, BY DISTRIBUTION CHANNEL, 2022(%)
- FIGURE 19. COMPARATIVE SHARE ANALYSIS OF MITRAL VALVE DISEASE THERAPEUTICS MARKET FOR HOSPITAL PHARMACIES, BY COUNTRY 2022 AND 2032(%)
- FIGURE 20. COMPARATIVE SHARE ANALYSIS OF MITRAL VALVE DISEASE THERAPEUTICS MARKET FOR DRUG STORE AND RETAIL PHARMACIES, BY COUNTRY 2022 AND 2032(%)
- FIGURE 21. COMPARATIVE SHARE ANALYSIS OF MITRAL VALVE DISEASE THERAPEUTICS MARKET FOR ONLINE PROVIDERS, BY COUNTRY 2022 AND 2032(%)
- FIGURE 22. MITRAL VALVE DISEASE THERAPEUTICS MARKET BY REGION, 2022
- FIGURE 23. U.S. MITRAL VALVE DISEASE THERAPEUTICS MARKET, 2022-2032 ($MILLION)
- FIGURE 24. CANADA MITRAL VALVE DISEASE THERAPEUTICS MARKET, 2022-2032 ($MILLION)
- FIGURE 25. MEXICO MITRAL VALVE DISEASE THERAPEUTICS MARKET, 2022-2032 ($MILLION)
- FIGURE 26. GERMANY MITRAL VALVE DISEASE THERAPEUTICS MARKET, 2022-2032 ($MILLION)
- FIGURE 27. FRANCE MITRAL VALVE DISEASE THERAPEUTICS MARKET, 2022-2032 ($MILLION)
- FIGURE 28. UK MITRAL VALVE DISEASE THERAPEUTICS MARKET, 2022-2032 ($MILLION)
- FIGURE 29. ITALY MITRAL VALVE DISEASE THERAPEUTICS MARKET, 2022-2032 ($MILLION)
- FIGURE 30. SPAIN MITRAL VALVE DISEASE THERAPEUTICS MARKET, 2022-2032 ($MILLION)
- FIGURE 31. REST OF EUROPE MITRAL VALVE DISEASE THERAPEUTICS MARKET, 2022-2032 ($MILLION)
- FIGURE 32. JAPAN MITRAL VALVE DISEASE THERAPEUTICS MARKET, 2022-2032 ($MILLION)
- FIGURE 33. CHINA MITRAL VALVE DISEASE THERAPEUTICS MARKET, 2022-2032 ($MILLION)
- FIGURE 34. INDIA MITRAL VALVE DISEASE THERAPEUTICS MARKET, 2022-2032 ($MILLION)
- FIGURE 35. AUSTRALIA MITRAL VALVE DISEASE THERAPEUTICS MARKET, 2022-2032 ($MILLION)
- FIGURE 36. SOUTH KOREA MITRAL VALVE DISEASE THERAPEUTICS MARKET, 2022-2032 ($MILLION)
- FIGURE 37. REST OF ASIA-PACIFIC MITRAL VALVE DISEASE THERAPEUTICS MARKET, 2022-2032 ($MILLION)
- FIGURE 38. BRAZIL MITRAL VALVE DISEASE THERAPEUTICS MARKET, 2022-2032 ($MILLION)
- FIGURE 39. SAUDI ARABIA MITRAL VALVE DISEASE THERAPEUTICS MARKET, 2022-2032 ($MILLION)
- FIGURE 40. SOUTH AFRICA MITRAL VALVE DISEASE THERAPEUTICS MARKET, 2022-2032 ($MILLION)
- FIGURE 41. REST OF LAMEA MITRAL VALVE DISEASE THERAPEUTICS MARKET, 2022-2032 ($MILLION)
- FIGURE 42. TOP WINNING STRATEGIES, BY YEAR
- FIGURE 43. TOP WINNING STRATEGIES, BY DEVELOPMENT
- FIGURE 44. TOP WINNING STRATEGIES, BY COMPANY
- FIGURE 45. PRODUCT MAPPING OF TOP 10 PLAYERS
- FIGURE 46. COMPETITIVE DASHBOARD
- FIGURE 47. COMPETITIVE HEATMAP: MITRAL VALVE DISEASE THERAPEUTICS MARKET
- FIGURE 48. TOP PLAYER POSITIONING, 2022
- FIGURE 49. ZYDUS LIFESCIENCES LIMITED: NET REVENUE, 2020-2022 ($MILLION)
- FIGURE 50. ZYDUS LIFESCIENCES LIMITED: REVENUE SHARE BY SEGMENT, 2022 (%)
- FIGURE 51. ZYDUS LIFESCIENCES LIMITED: REVENUE SHARE BY REGION, 2022 (%)
- FIGURE 52. PFIZER INC.: NET REVENUE, 2020-2022 ($MILLION)
- FIGURE 53. PFIZER INC.: REVENUE SHARE BY REGION, 2022 (%)
- FIGURE 54. PFIZER INC.: REVENUE SHARE BY SEGMENT, 2021 (%)
- FIGURE 55. BAYER AG: NET SALES, 2020-2022 ($MILLION)
- FIGURE 56. BAYER AG: REVENUE SHARE BY SEGMENT, 2022 (%)
- FIGURE 57. BAYER AG: REVENUE SHARE BY REGION, 2022 (%)
- FIGURE 58. NOVARTIS AG: NET SALES, 2020-2022 ($MILLION)
- FIGURE 59. NOVARTIS AG: REVENUE SHARE BY SEGMENT, 2022 (%)
- FIGURE 60. NOVARTIS AG: REVENUE SHARE BY REGION, 2022 (%)
- FIGURE 61. VIATRIS INC.: NET SALES, 2020-2022 ($MILLION)
- FIGURE 62. VIATRIS INC.: REVENUE SHARE BY SEGMENT, 2022 (%)
- FIGURE 63. ALEMBIC LTD: SALES REVENUE, 2020-2022 ($MILLION)
- FIGURE 64. ALEMBIC LTD: REVENUE SHARE BY SEGMENT, 2022 (%)
- FIGURE 65. ALEMBIC LTD: REVENUE SHARE BY REGION, 2022 (%)
- FIGURE 66. SUN PHARMACEUTICAL INDUSTRIES LIMITED: SALES REVENUE, 2020-2022 ($MILLION)
- FIGURE 67. SUN PHARMACEUTICAL INDUSTRIES LIMITED: REVENUE SHARE BY REGION, 2022 (%)
- FIGURE 68. CIPLA LTD: SALES REVENUE, 2020-2022 ($MILLION)
- FIGURE 69. CIPLA LTD: REVENUE SHARE BY SEGMENT, 2022 (%)
- FIGURE 70. CIPLA LTD: REVENUE SHARE BY REGION, 2022 (%)
- FIGURE 71. TEVA PHARMACEUTICAL INDUSTRIES LTD.: NET REVENUE, 2020-2022 ($MILLION)
- FIGURE 72. TEVA PHARMACEUTICAL INDUSTRIES LTD.: REVENUE SHARE BY REGION, 2022 (%)
- FIGURE 73. SANOFI S.A.: NET SALES, 2020-2022 ($MILLION)
- FIGURE 74. SANOFI S.A.: REVENUE SHARE BY SEGMENT, 2022 (%)
- FIGURE 75. SANOFI S.A.: REVENUE SHARE BY REGION, 2022 (%)


