


 |
市場調查報告書
商品編碼
1472216
紙袋市場:依產品類型、價格分佈、最終用戶、通路分類:2023-2032 年全球機會分析與產業預測Paper Bag Market By Product Type, By Price Point, By End User, By Distribution Channel : Global Opportunity Analysis and Industry Forecast, 2023-2032 |
||||||
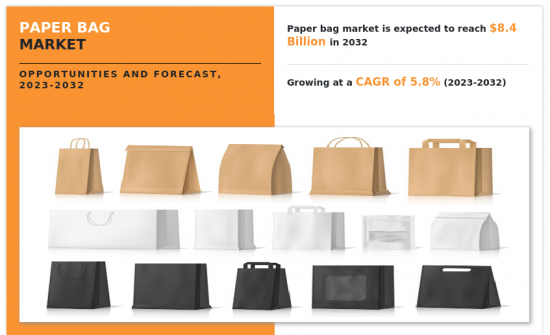
2022年全球紙袋市值為48億美元,預計2032年將達到84億美元,2023年至2032年的複合年成長率為5.8%。
紙袋是由紙纖維製成的一次性輕量袋子,旨在容納各種產品和材料,通常被選為塑膠袋的環保替代品。紙袋用於多種行業的包裝,包括農業及相關行業、建築、食品和飲料、零售、化學品、藥品和商品。
監管政策和塑膠袋禁令是紙袋市場的強勁促進因素。隨著世界各國政府實施更嚴格的法規以減少塑膠污染並促進永續性,企業和消費者被迫尋求替代包裝解決方案。對環保選擇的需求激增與紙袋的生物分解性、可回收和環境永續是一致的。
而且,這些政策的實施創造了一個市場環境,激勵企業投資紙袋生產和分銷。零售商、超級市場和電子商務平台正在迅速從塑膠袋過渡到紙袋,以遵守法規並回應消費者的偏好。因此,紙袋市場將成為尋求環保包裝解決方案的企業和消費者的首選,從而導致需求大幅增加。因此,監管政策和塑膠袋禁令不僅推動了需求,而且重塑了產業動態,將紙袋定位為現代永續包裝解決方案的關鍵。
零售商和電子商務平台的不斷採用在市場成長中發揮重要作用。隨著零售商和電子商務平台響應消費者對永續包裝解決方案的偏好,消費者的偏好擴大從塑膠袋轉向紙袋等環保替代品。這種轉變是由監管壓力和消費者對環保包裝選擇的需求所推動的。零售商明白,提供紙袋符合企業社會責任 (CSR) 目標、提升品牌形象,並有助於滿足塑膠袋使用的監管要求。此外,許多電子商務平台都認知到永續包裝對於減少對環境的影響並吸引具有生態意識的消費者的重要性。
此外,零售商和電子商務平台對紙袋的採用擴大了紙袋製造商的市場範圍和知名度。零售商經常需要大量的包裝材料來滿足他們的需求,這為紙袋供應商提供了重要的市場機會。隨著電子商務在全球範圍內持續成長,對包括紙袋在內的包裝材料的需求預計將相應增加。零售商和電子商務平台的不斷採用不僅會推動需求,還會鼓勵紙袋設計和生產過程的創新,以滿足不同零售商和行業的多樣化需求。
生物分解性和可回收材料的創新是紙袋市場的重大機遇,使製造商能夠滿足對永續包裝解決方案日益成長的需求。此外,材料科學的進步正在開發傳統紙袋材料的生物基替代品,例如源自玉米粉和甘蔗等可再生資源的生質塑膠。這些生物分解性材料具有與傳統紙袋相同的功能和耐用性,但它們會自然分解,不會留下有害殘留物,從而最大限度地減少對環境的影響。
此外,可回收塗料和添加劑的使用使紙袋更具可回收性,對具有環保意識的消費者和企業更具吸引力。透過將這些創新材料融入其產品中,紙袋製造商可以在市場上脫穎而出,並吸引尋求更環保包裝選擇的客戶。此外,採用生物分解性和可回收材料符合監管要求和企業永續性目標,使公司能夠在環保意識日益增強的市場中實現長期成長和成功。
紙袋市場分為產品類型、最終用戶、價格分佈、分銷管道和地區。依產品類型分類,市場分為縫製開口、旋鈕底部開口、黏貼式閥門、黏貼式開口和平底。依最終用戶分為農業及相關行業、建築與施工、食品與飲料、零售、化學、製藥、商品等。依價格分佈分為高級、中型、經濟型。依分銷通路分為B2B和B2C。依地區分類:歐洲(德國、法國、義大利、西班牙、英國等歐洲地區)、亞太地區(中國、日本、印度、韓國、澳洲等亞太地區)、拉丁美洲/中東/非洲(巴西、南非、沙烏地阿拉伯和拉丁美洲/中東/非洲其他地區)。
紙袋市場的參與企業正在採用收購、業務擴張、聯盟、合作和產品推出作為主要的市場開拓策略,以提高盈利並提高市場地位。
相關人員的主要利益
- 該報告提供了 2022 年至 2032 年紙袋市場分析的細分市場、當前趨勢、估計/趨勢分析和動態的定量分析,並確定了紙袋市場的強大機會。
- 它提供市場研究以及與市場促進因素、市場限制和市場機會相關的資訊。
- 波特的五力分析強調買家和供應商幫助相關人員做出利潤驅動的商業決策並加強供應商-買家網路的潛力。
- 對紙袋市場細分的詳細分析有助於識別市場機會。
- 每個地區的主要國家都根據其對全球市場的收益貢獻繪製了地圖。
- 市場參與企業定位有助於進行基準比較,並提供對市場參與企業當前地位的清晰了解。
- 該報告包括對區域和全球紙袋市場趨勢、主要企業、細分市場、應用領域和市場成長策略的分析。
可使用此報告進行客製化(需要額外費用和時間表)
- 製造能力
- 產品生命週期
- 監管指引
- 根據客戶興趣新增其他公司簡介
- 平均售價分析/價格分佈分析
- 品牌佔有率分析
- 十字交叉細分市場分析—市場規模與預測
- 擴大公司簡介列表
- 歷史市場資料
- 主要參與企業的詳細資料(Excel格式,包括位置、聯絡資訊、供應商/供應商網路等)
- 客戶/消費者/原料供應商名單 - 價值鏈分析
- 全球/區域/國家層級參與企業的市場佔有率分析
- SWOT分析
目錄
第1章簡介
第 2 章執行摘要
第3章市場概況
- 市場定義和範圍
- 主要發現
- 影響因素
- 關鍵投資機會
- 波特五力分析
- 市場動態
- 促進因素
- 零售商和電子商務平台的採用率增加
- 環境意識與永續性舉措
- 消費者偏好和生活方式趨勢的變化
- 抑制因素
- 與替代包裝解決方案的競爭
- 生產成本高
- 機會
- 材料和設計的創新
- 人們對環境問題的認知不斷增強
- 促進因素
第4章紙袋市場:依產品類型
- 概述
- 縫紉開口
- 鉗形底部開口
- 乘閥
- 搶眼開場
- 平底
第5章紙袋市場:依價格分佈
- 概述
- 高價
- 中等價格
- 低價
第6章紙袋市場:依最終用戶分類
- 概述
- 農業及相關產業
- 建築/施工
- 飲食
- 零售
- 化學
- 藥品
- 商品
- 其他
第7章紙袋市場:依通路分類
- 概述
- B2B
- B2C
第8章紙袋市場:按地區
- 概述
- 歐洲
- 德國
- 法國
- 義大利
- 西班牙
- 英國
- 其他
- 亞太地區
- 中國
- 日本
- 印度
- 韓國
- 澳洲
- 其他
- 拉丁美洲/中東/非洲
- 巴西
- 南非
- 沙烏地阿拉伯
- 其他
第9章 競爭格局
- 介紹
- 關鍵成功策略
- 10家主要企業產品圖譜
- 競爭對手儀表板
- 競爭熱圖
- 2022年主要企業定位
第10章 公司簡介
- Mondi Plc.
- Smurfit Kappa Group
- International Paper Company
- Novolex
- Ronpak, Inc.
- United Bag, Inc.
- Global-Pak, Inc.
- Paperbags Ltd.
- York Paper Company Ltd.
- Welton Bibby And Baron Limited
The global paper bag market was valued at $4.8 billion in 2022 and is projected to reach $8.4 billion by 2032, registering a CAGR of 5.8% from 2023 to 2032.
A paper bag is a disposable, lightweight bag made from paper fibers, designed to hold various goods or materials, and often chosen as an environmentally friendly alternative to plastic bags. Paper bags are utilized in different industries such as agriculture and allied industries, building and construction, food and beverage, retail, chemicals, pharmaceuticals, merchandise, and others for packaging.
Regulatory policies and bans on plastic bags serve as powerful driver of the paper bag market. As governments worldwide enforce stricter regulations to mitigate plastic pollution and promote sustainability, businesses and consumers are compelled to seek alternative packaging solutions. This surge in demand for eco-friendly options aligns with the characteristics of paper bags, which are biodegradable, recyclable, and environmentally sustainable.
Moreover, the implementation of these policies creates a conducive market environment where businesses are incentivized to invest in paper bag production and distribution. Retailers, supermarkets, and e-commerce platforms swiftly transition from plastic to paper bags to comply with regulations and meet consumer preferences. Consequently, the paper bag market experiences a significant uptick in demand as it emerges as the preferred choice for both businesses and consumers seeking environmentally responsible packaging solutions. Thus, regulatory policies and bans on plastic bags not only drive demand but also reshape industry dynamics, positioning paper bags as the cornerstone of sustainable packaging solutions in the modern era.
Increased adoption by retailers and e-commerce platforms plays a significant role in market growth. As retailers and e-commerce platforms respond to consumer preferences for sustainable packaging solutions, consumers are increasingly shifting their preference from plastic bags toward eco-friendly alternatives such as paper bags. This shift is driven by both regulatory pressures and consumer demand for environmentally responsible packaging options. Retailers understand that offering paper bags aligns with their corporate social responsibility (CSR) goals, enhances their brand image, and helps them meet regulatory requirements regarding plastic bag usage. Moreover, many e-commerce platforms are recognizing the importance of sustainable packaging to reduce their environmental impact and appeal to eco-conscious consumers.
Furthermore, the adoption of paper bags by retailers and e-commerce platforms expands the market reach and visibility of paper bag manufacturers. Retailers often require large quantities of packaging materials to meet their needs, providing a significant market opportunity for paper bag suppliers. As e-commerce continues to grow globally, the demand for packaging materials, including paper bags, is expected to increase correspondingly. This increased adoption by retailers and e-commerce platforms not only drives the demand but also encourages innovation in paper bag design and production processes to meet the diverse needs of different retailers and industries.
Innovations in biodegradable and recyclable materials represent a significant opportunity for the paper bag market, enabling manufacturers to meet the increasing demand for sustainable packaging solutions. Moreover, advancements in material science have led to the development of bio-based alternatives to traditional paper bag materials, such as bioplastics derived from renewable sources such as cornstarch or sugarcane. These biodegradable materials offer similar functionality and durability to conventional paper bags while minimizing environmental impact, as they break down naturally without leaving harmful residues.
Furthermore, the introduction of recyclable coatings and additives enhances the recyclability of paper bags, making them more appealing to environmentally conscious consumers and businesses. By incorporating these innovative materials into their product offerings, paper bag manufacturers can differentiate themselves in the market and attract customers seeking greener packaging options. In addition, the adoption of biodegradable and recyclable materials aligns with regulatory requirements and corporate sustainability goals, positioning companies for long-term growth and success in an increasingly eco-conscious marketplace.
The paper bag market is segmented into product type, end user, price point, distribution channel, and region. Depending on product type, the market is divided into sewn open mouth, pinched bottom open mouth, pasted valve, pasted open mouth, and flat bottom. By end user, it is segregated into agriculture & allied industries, building & construction, food & beverage, retail, chemicals, pharmaceutical, merchandise, and others. As per price point, it is divided into the premium, medium, and economy. On the basis of distribution channel, it is fragmented into B2B and B2C. Region-wise, it is analyzed across Europe (Germany, France, Italy, Spain, UK, and rest of Europe), Asia-Pacific (China, Japan, India, South Korea, Australia, and rest of Asia-Pacific), and LAMEA (Brazil, South Africa, Saudi Arabia, and rest of LAMEA).
The players in the paper bag market have adopted acquisition, business expansion, partnership, collaboration, and product launch as their key development strategies to increase profitability and improve their position in the market.
Some of the key players profiled in the paper bag market analysis include Mondi Plc, Smurfit Kappa Group Plc, International Paper Company, Novolex Holdings, Inc., Ronpak, United Bag, Inc, Global-Pak, Inc, PaperBag Limited, York Paper Company Limited, and Welton Bibby and Baron Limited.
Key Benefits For Stakeholders
- This report provides a quantitative analysis of the market segments, current trends, estimations, and dynamics of the paper bag market analysis from 2022 to 2032 to identify the prevailing paper bag market opportunities.
- The market research is offered along with information related to key drivers, restraints, and opportunities.
- Porter's five forces analysis highlights the potency of buyers and suppliers to enable stakeholders make profit-oriented business decisions and strengthen their supplier-buyer network.
- In-depth analysis of the paper bag market segmentation assists to determine the prevailing market opportunities.
- Major countries in each region are mapped according to their revenue contribution to the global market.
- Market player positioning facilitates benchmarking and provides a clear understanding of the present position of the market players.
- The report includes the analysis of the regional as well as global paper bag market trends, key players, market segments, application areas, and market growth strategies.
Additional benefits you will get with this purchase are:
- Quarterly Update and* (only available with a corporate license, on listed price)
- 5 additional Company Profile of client Choice pre- or Post-purchase, as a free update.
- Free Upcoming Version on the Purchase of Five and Enterprise User License.
- 16 analyst hours of support* (post-purchase, if you find additional data requirements upon review of the report, you may receive support amounting to 16 analyst hours to solve questions, and post-sale queries)
- 15% Free Customization* (in case the scope or segment of the report does not match your requirements, 15% is equivalent to 3 working days of free work, applicable once)
- Free data Pack on the Five and Enterprise User License. (Excel version of the report)
- Free Updated report if the report is 6-12 months old or older.
- 24-hour priority response*
- Free Industry updates and white papers.
Possible Customization with this report (with additional cost and timeline, please talk to the sales executive to know more)
- Manufacturing Capacity
- Product Life Cycles
- Regulatory Guidelines
- Additional company profiles with specific to client's interest
- Average Selling Price Analysis / Price Point Analysis
- Brands Share Analysis
- Criss-cross segment analysis- market size and forecast
- Expanded list for Company Profiles
- Historic market data
- Key player details (including location, contact details, supplier/vendor network etc. in excel format)
- List of customers/consumers/raw material suppliers- value chain analysis
- Market share analysis of players at global/region/country level
- SWOT Analysis
Key Market Segments
By Product Type
- Sewn Open Mouth
- Pinched Bottom Open Mouth
- Pasted Valve
- Pasted Open Mouth
- Flat Bottom
By Price Point
- Economy
- Premium
- Medium
By End User
- Agriculture and Allied Industries
- Building and Cons
- Food and Beverage
- Retail
- Chemicals
- Pharmaceutical
- Merchandise
- Others
By Distribution Channel
- B2B
- B2C
By Region
- Europe
- Germany
- France
- Italy
- Spain
- UK
- Rest of Europe
- Asia-Pacific
- China
- Japan
- India
- South Korea
- Australia
- Rest of Asia-Pacific
- LAMEA
- Brazil
- South Africa,
- Saudi Arabia
- Rest of LAMEA
Key Market Players:
- Ronpak, Inc.
- United Bag, Inc.
- Smurfit Kappa Group
- York Paper Company Ltd.
- Paperbags Ltd.
- Mondi Plc.
- Global-Pak, Inc.
- Novolex
- International Paper Company
- Welton Bibby And Baron Limited
TABLE OF CONTENTS
CHAPTER 1: INTRODUCTION
- 1.1. Report description
- 1.2. Key market segments
- 1.3. Key benefits to the stakeholders
- 1.4. Research methodology
- 1.4.1. Primary research
- 1.4.2. Secondary research
- 1.4.3. Analyst tools and models
CHAPTER 2: EXECUTIVE SUMMARY
- 2.1. CXO perspective
CHAPTER 3: MARKET OVERVIEW
- 3.1. Market definition and scope
- 3.2. Key findings
- 3.2.1. Top impacting factors
- 3.2.2. Top investment pockets
- 3.3. Porter's five forces analysis
- 3.3.1. Moderate bargaining power of suppliers
- 3.3.2. Moderate threat of new entrants
- 3.3.3. Moderate threat of substitutes
- 3.3.4. High intensity of rivalry
- 3.3.5. Moderate bargaining power of buyers
- 3.4. Market dynamics
- 3.4.1. Drivers
- 3.4.1.1. Increase in Adoption by Retailers and E-commerce Platforms
- 3.4.1.2. Environmental Awareness and Sustainability Initiatives
- 3.4.1.3. Changing Consumer Preferences and Lifestyle Trends
- 3.4.2. Restraints
- 3.4.2.1. Competition from Alternative Packaging Solutions
- 3.4.2.2. High Production Costs
- 3.4.3. Opportunities
- 3.4.3.1. Innovations in Material and Design
- 3.4.3.2. Increasing Awareness of Environmental Issues
- 3.4.1. Drivers
CHAPTER 4: PAPER BAG MARKET, BY PRODUCT TYPE
- 4.1. Overview
- 4.1.1. Market size and forecast
- 4.2. Sewn Open Mouth
- 4.2.1. Key market trends, growth factors and opportunities
- 4.2.2. Market size and forecast, by region
- 4.2.3. Market share analysis by country
- 4.3. Pinched Bottom Open Mouth
- 4.3.1. Key market trends, growth factors and opportunities
- 4.3.2. Market size and forecast, by region
- 4.3.3. Market share analysis by country
- 4.4. Pasted Valve
- 4.4.1. Key market trends, growth factors and opportunities
- 4.4.2. Market size and forecast, by region
- 4.4.3. Market share analysis by country
- 4.5. Pasted Open Mouth
- 4.5.1. Key market trends, growth factors and opportunities
- 4.5.2. Market size and forecast, by region
- 4.5.3. Market share analysis by country
- 4.6. Flat Bottom
- 4.6.1. Key market trends, growth factors and opportunities
- 4.6.2. Market size and forecast, by region
- 4.6.3. Market share analysis by country
CHAPTER 5: PAPER BAG MARKET, BY PRICE POINT
- 5.1. Overview
- 5.1.1. Market size and forecast
- 5.2. Premium
- 5.2.1. Key market trends, growth factors and opportunities
- 5.2.2. Market size and forecast, by region
- 5.2.3. Market share analysis by country
- 5.3. Medium
- 5.3.1. Key market trends, growth factors and opportunities
- 5.3.2. Market size and forecast, by region
- 5.3.3. Market share analysis by country
- 5.4. Economy
- 5.4.1. Key market trends, growth factors and opportunities
- 5.4.2. Market size and forecast, by region
- 5.4.3. Market share analysis by country
CHAPTER 6: PAPER BAG MARKET, BY END USER
- 6.1. Overview
- 6.1.1. Market size and forecast
- 6.2. Agriculture and Allied Industries
- 6.2.1. Key market trends, growth factors and opportunities
- 6.2.2. Market size and forecast, by region
- 6.2.3. Market share analysis by country
- 6.3. Building and Cons
- 6.3.1. Key market trends, growth factors and opportunities
- 6.3.2. Market size and forecast, by region
- 6.3.3. Market share analysis by country
- 6.4. Food and Beverage
- 6.4.1. Key market trends, growth factors and opportunities
- 6.4.2. Market size and forecast, by region
- 6.4.3. Market share analysis by country
- 6.5. Retail
- 6.5.1. Key market trends, growth factors and opportunities
- 6.5.2. Market size and forecast, by region
- 6.5.3. Market share analysis by country
- 6.6. Chemicals
- 6.6.1. Key market trends, growth factors and opportunities
- 6.6.2. Market size and forecast, by region
- 6.6.3. Market share analysis by country
- 6.7. Pharmaceutical
- 6.7.1. Key market trends, growth factors and opportunities
- 6.7.2. Market size and forecast, by region
- 6.7.3. Market share analysis by country
- 6.8. Merchandise
- 6.8.1. Key market trends, growth factors and opportunities
- 6.8.2. Market size and forecast, by region
- 6.8.3. Market share analysis by country
- 6.9. Others
- 6.9.1. Key market trends, growth factors and opportunities
- 6.9.2. Market size and forecast, by region
- 6.9.3. Market share analysis by country
CHAPTER 7: PAPER BAG MARKET, BY DISTRIBUTION CHANNEL
- 7.1. Overview
- 7.1.1. Market size and forecast
- 7.2. B2B
- 7.2.1. Key market trends, growth factors and opportunities
- 7.2.2. Market size and forecast, by region
- 7.2.3. Market share analysis by country
- 7.3. B2C
- 7.3.1. Key market trends, growth factors and opportunities
- 7.3.2. Market size and forecast, by region
- 7.3.3. Market share analysis by country
CHAPTER 8: PAPER BAG MARKET, BY REGION
- 8.1. Overview
- 8.1.1. Market size and forecast By Region
- 8.2. Europe
- 8.2.1. Key market trends, growth factors and opportunities
- 8.2.2. Market size and forecast, by Product Type
- 8.2.3. Market size and forecast, by Price Point
- 8.2.4. Market size and forecast, by End User
- 8.2.5. Market size and forecast, by Distribution Channel
- 8.2.6. Market size and forecast, by country
- 8.2.6.1. Germany
- 8.2.6.1.1. Market size and forecast, by Product Type
- 8.2.6.1.2. Market size and forecast, by Price Point
- 8.2.6.1.3. Market size and forecast, by End User
- 8.2.6.1.4. Market size and forecast, by Distribution Channel
- 8.2.6.2. France
- 8.2.6.2.1. Market size and forecast, by Product Type
- 8.2.6.2.2. Market size and forecast, by Price Point
- 8.2.6.2.3. Market size and forecast, by End User
- 8.2.6.2.4. Market size and forecast, by Distribution Channel
- 8.2.6.3. Italy
- 8.2.6.3.1. Market size and forecast, by Product Type
- 8.2.6.3.2. Market size and forecast, by Price Point
- 8.2.6.3.3. Market size and forecast, by End User
- 8.2.6.3.4. Market size and forecast, by Distribution Channel
- 8.2.6.4. Spain
- 8.2.6.4.1. Market size and forecast, by Product Type
- 8.2.6.4.2. Market size and forecast, by Price Point
- 8.2.6.4.3. Market size and forecast, by End User
- 8.2.6.4.4. Market size and forecast, by Distribution Channel
- 8.2.6.5. UK
- 8.2.6.5.1. Market size and forecast, by Product Type
- 8.2.6.5.2. Market size and forecast, by Price Point
- 8.2.6.5.3. Market size and forecast, by End User
- 8.2.6.5.4. Market size and forecast, by Distribution Channel
- 8.2.6.6. Rest of Europe
- 8.2.6.6.1. Market size and forecast, by Product Type
- 8.2.6.6.2. Market size and forecast, by Price Point
- 8.2.6.6.3. Market size and forecast, by End User
- 8.2.6.6.4. Market size and forecast, by Distribution Channel
- 8.3. Asia-Pacific
- 8.3.1. Key market trends, growth factors and opportunities
- 8.3.2. Market size and forecast, by Product Type
- 8.3.3. Market size and forecast, by Price Point
- 8.3.4. Market size and forecast, by End User
- 8.3.5. Market size and forecast, by Distribution Channel
- 8.3.6. Market size and forecast, by country
- 8.3.6.1. China
- 8.3.6.1.1. Market size and forecast, by Product Type
- 8.3.6.1.2. Market size and forecast, by Price Point
- 8.3.6.1.3. Market size and forecast, by End User
- 8.3.6.1.4. Market size and forecast, by Distribution Channel
- 8.3.6.2. Japan
- 8.3.6.2.1. Market size and forecast, by Product Type
- 8.3.6.2.2. Market size and forecast, by Price Point
- 8.3.6.2.3. Market size and forecast, by End User
- 8.3.6.2.4. Market size and forecast, by Distribution Channel
- 8.3.6.3. India
- 8.3.6.3.1. Market size and forecast, by Product Type
- 8.3.6.3.2. Market size and forecast, by Price Point
- 8.3.6.3.3. Market size and forecast, by End User
- 8.3.6.3.4. Market size and forecast, by Distribution Channel
- 8.3.6.4. South Korea
- 8.3.6.4.1. Market size and forecast, by Product Type
- 8.3.6.4.2. Market size and forecast, by Price Point
- 8.3.6.4.3. Market size and forecast, by End User
- 8.3.6.4.4. Market size and forecast, by Distribution Channel
- 8.3.6.5. Australia
- 8.3.6.5.1. Market size and forecast, by Product Type
- 8.3.6.5.2. Market size and forecast, by Price Point
- 8.3.6.5.3. Market size and forecast, by End User
- 8.3.6.5.4. Market size and forecast, by Distribution Channel
- 8.3.6.6. Rest of Asia-Pacific
- 8.3.6.6.1. Market size and forecast, by Product Type
- 8.3.6.6.2. Market size and forecast, by Price Point
- 8.3.6.6.3. Market size and forecast, by End User
- 8.3.6.6.4. Market size and forecast, by Distribution Channel
- 8.4. LAMEA
- 8.4.1. Key market trends, growth factors and opportunities
- 8.4.2. Market size and forecast, by Product Type
- 8.4.3. Market size and forecast, by Price Point
- 8.4.4. Market size and forecast, by End User
- 8.4.5. Market size and forecast, by Distribution Channel
- 8.4.6. Market size and forecast, by country
- 8.4.6.1. Brazil
- 8.4.6.1.1. Market size and forecast, by Product Type
- 8.4.6.1.2. Market size and forecast, by Price Point
- 8.4.6.1.3. Market size and forecast, by End User
- 8.4.6.1.4. Market size and forecast, by Distribution Channel
- 8.4.6.2. South Africa,
- 8.4.6.2.1. Market size and forecast, by Product Type
- 8.4.6.2.2. Market size and forecast, by Price Point
- 8.4.6.2.3. Market size and forecast, by End User
- 8.4.6.2.4. Market size and forecast, by Distribution Channel
- 8.4.6.3. Saudi Arabia
- 8.4.6.3.1. Market size and forecast, by Product Type
- 8.4.6.3.2. Market size and forecast, by Price Point
- 8.4.6.3.3. Market size and forecast, by End User
- 8.4.6.3.4. Market size and forecast, by Distribution Channel
- 8.4.6.4. Rest of LAMEA
- 8.4.6.4.1. Market size and forecast, by Product Type
- 8.4.6.4.2. Market size and forecast, by Price Point
- 8.4.6.4.3. Market size and forecast, by End User
- 8.4.6.4.4. Market size and forecast, by Distribution Channel
CHAPTER 9: COMPETITIVE LANDSCAPE
- 9.1. Introduction
- 9.2. Top winning strategies
- 9.3. Product mapping of top 10 player
- 9.4. Competitive dashboard
- 9.5. Competitive heatmap
- 9.6. Top player positioning, 2022
CHAPTER 10: COMPANY PROFILES
- 10.1. Mondi Plc.
- 10.1.1. Company overview
- 10.1.2. Key executives
- 10.1.3. Company snapshot
- 10.1.4. Operating business segments
- 10.1.5. Product portfolio
- 10.1.6. Business performance
- 10.2. Smurfit Kappa Group
- 10.2.1. Company overview
- 10.2.2. Key executives
- 10.2.3. Company snapshot
- 10.2.4. Operating business segments
- 10.2.5. Product portfolio
- 10.2.6. Business performance
- 10.3. International Paper Company
- 10.3.1. Company overview
- 10.3.2. Key executives
- 10.3.3. Company snapshot
- 10.3.4. Operating business segments
- 10.3.5. Product portfolio
- 10.3.6. Business performance
- 10.4. Novolex
- 10.4.1. Company overview
- 10.4.2. Key executives
- 10.4.3. Company snapshot
- 10.4.4. Operating business segments
- 10.4.5. Product portfolio
- 10.5. Ronpak, Inc.
- 10.5.1. Company overview
- 10.5.2. Key executives
- 10.5.3. Company snapshot
- 10.5.4. Operating business segments
- 10.5.5. Product portfolio
- 10.6. United Bag, Inc.
- 10.6.1. Company overview
- 10.6.2. Key executives
- 10.6.3. Company snapshot
- 10.6.4. Operating business segments
- 10.6.5. Product portfolio
- 10.7. Global-Pak, Inc.
- 10.7.1. Company overview
- 10.7.2. Key executives
- 10.7.3. Company snapshot
- 10.7.4. Operating business segments
- 10.7.5. Product portfolio
- 10.8. Paperbags Ltd.
- 10.8.1. Company overview
- 10.8.2. Key executives
- 10.8.3. Company snapshot
- 10.8.4. Operating business segments
- 10.8.5. Product portfolio
- 10.9. York Paper Company Ltd.
- 10.9.1. Company overview
- 10.9.2. Key executives
- 10.9.3. Company snapshot
- 10.9.4. Operating business segments
- 10.9.5. Product portfolio
- 10.10. Welton Bibby And Baron Limited
- 10.10.1. Company overview
- 10.10.2. Key executives
- 10.10.3. Company snapshot
- 10.10.4. Operating business segments
- 10.10.5. Product portfolio
LIST OF TABLES
- TABLE 01. GLOBAL PAPER BAG MARKET, BY PRODUCT TYPE, 2022-2032 ($MILLION)
- TABLE 02. PAPER BAG MARKET FOR SEWN OPEN MOUTH, BY REGION, 2022-2032 ($MILLION)
- TABLE 03. PAPER BAG MARKET FOR PINCHED BOTTOM OPEN MOUTH, BY REGION, 2022-2032 ($MILLION)
- TABLE 04. PAPER BAG MARKET FOR PASTED VALVE, BY REGION, 2022-2032 ($MILLION)
- TABLE 05. PAPER BAG MARKET FOR PASTED OPEN MOUTH, BY REGION, 2022-2032 ($MILLION)
- TABLE 06. PAPER BAG MARKET FOR FLAT BOTTOM, BY REGION, 2022-2032 ($MILLION)
- TABLE 07. GLOBAL PAPER BAG MARKET, BY PRICE POINT, 2022-2032 ($MILLION)
- TABLE 08. PAPER BAG MARKET FOR PREMIUM, BY REGION, 2022-2032 ($MILLION)
- TABLE 09. PAPER BAG MARKET FOR MEDIUM, BY REGION, 2022-2032 ($MILLION)
- TABLE 10. PAPER BAG MARKET FOR ECONOMY, BY REGION, 2022-2032 ($MILLION)
- TABLE 11. GLOBAL PAPER BAG MARKET, BY END USER, 2022-2032 ($MILLION)
- TABLE 12. PAPER BAG MARKET FOR AGRICULTURE AND ALLIED INDUSTRIES, BY REGION, 2022-2032 ($MILLION)
- TABLE 13. PAPER BAG MARKET FOR BUILDING AND CONS, BY REGION, 2022-2032 ($MILLION)
- TABLE 14. PAPER BAG MARKET FOR FOOD AND BEVERAGE, BY REGION, 2022-2032 ($MILLION)
- TABLE 15. PAPER BAG MARKET FOR RETAIL, BY REGION, 2022-2032 ($MILLION)
- TABLE 16. PAPER BAG MARKET FOR CHEMICALS, BY REGION, 2022-2032 ($MILLION)
- TABLE 17. PAPER BAG MARKET FOR PHARMACEUTICAL, BY REGION, 2022-2032 ($MILLION)
- TABLE 18. PAPER BAG MARKET FOR MERCHANDISE, BY REGION, 2022-2032 ($MILLION)
- TABLE 19. PAPER BAG MARKET FOR OTHERS, BY REGION, 2022-2032 ($MILLION)
- TABLE 20. GLOBAL PAPER BAG MARKET, BY DISTRIBUTION CHANNEL, 2022-2032 ($MILLION)
- TABLE 21. PAPER BAG MARKET FOR B2B, BY REGION, 2022-2032 ($MILLION)
- TABLE 22. PAPER BAG MARKET FOR B2C, BY REGION, 2022-2032 ($MILLION)
- TABLE 23. PAPER BAG MARKET, BY REGION, 2022-2032 ($MILLION)
- TABLE 24. EUROPE PAPER BAG MARKET, BY PRODUCT TYPE, 2022-2032 ($MILLION)
- TABLE 25. EUROPE PAPER BAG MARKET, BY PRICE POINT, 2022-2032 ($MILLION)
- TABLE 26. EUROPE PAPER BAG MARKET, BY END USER, 2022-2032 ($MILLION)
- TABLE 27. EUROPE PAPER BAG MARKET, BY DISTRIBUTION CHANNEL, 2022-2032 ($MILLION)
- TABLE 28. EUROPE PAPER BAG MARKET, BY COUNTRY, 2022-2032 ($MILLION)
- TABLE 29. GERMANY PAPER BAG MARKET, BY PRODUCT TYPE, 2022-2032 ($MILLION)
- TABLE 30. GERMANY PAPER BAG MARKET, BY PRICE POINT, 2022-2032 ($MILLION)
- TABLE 31. GERMANY PAPER BAG MARKET, BY END USER, 2022-2032 ($MILLION)
- TABLE 32. GERMANY PAPER BAG MARKET, BY DISTRIBUTION CHANNEL, 2022-2032 ($MILLION)
- TABLE 33. FRANCE PAPER BAG MARKET, BY PRODUCT TYPE, 2022-2032 ($MILLION)
- TABLE 34. FRANCE PAPER BAG MARKET, BY PRICE POINT, 2022-2032 ($MILLION)
- TABLE 35. FRANCE PAPER BAG MARKET, BY END USER, 2022-2032 ($MILLION)
- TABLE 36. FRANCE PAPER BAG MARKET, BY DISTRIBUTION CHANNEL, 2022-2032 ($MILLION)
- TABLE 37. ITALY PAPER BAG MARKET, BY PRODUCT TYPE, 2022-2032 ($MILLION)
- TABLE 38. ITALY PAPER BAG MARKET, BY PRICE POINT, 2022-2032 ($MILLION)
- TABLE 39. ITALY PAPER BAG MARKET, BY END USER, 2022-2032 ($MILLION)
- TABLE 40. ITALY PAPER BAG MARKET, BY DISTRIBUTION CHANNEL, 2022-2032 ($MILLION)
- TABLE 41. SPAIN PAPER BAG MARKET, BY PRODUCT TYPE, 2022-2032 ($MILLION)
- TABLE 42. SPAIN PAPER BAG MARKET, BY PRICE POINT, 2022-2032 ($MILLION)
- TABLE 43. SPAIN PAPER BAG MARKET, BY END USER, 2022-2032 ($MILLION)
- TABLE 44. SPAIN PAPER BAG MARKET, BY DISTRIBUTION CHANNEL, 2022-2032 ($MILLION)
- TABLE 45. UK PAPER BAG MARKET, BY PRODUCT TYPE, 2022-2032 ($MILLION)
- TABLE 46. UK PAPER BAG MARKET, BY PRICE POINT, 2022-2032 ($MILLION)
- TABLE 47. UK PAPER BAG MARKET, BY END USER, 2022-2032 ($MILLION)
- TABLE 48. UK PAPER BAG MARKET, BY DISTRIBUTION CHANNEL, 2022-2032 ($MILLION)
- TABLE 49. REST OF EUROPE PAPER BAG MARKET, BY PRODUCT TYPE, 2022-2032 ($MILLION)
- TABLE 50. REST OF EUROPE PAPER BAG MARKET, BY PRICE POINT, 2022-2032 ($MILLION)
- TABLE 51. REST OF EUROPE PAPER BAG MARKET, BY END USER, 2022-2032 ($MILLION)
- TABLE 52. REST OF EUROPE PAPER BAG MARKET, BY DISTRIBUTION CHANNEL, 2022-2032 ($MILLION)
- TABLE 53. ASIA-PACIFIC PAPER BAG MARKET, BY PRODUCT TYPE, 2022-2032 ($MILLION)
- TABLE 54. ASIA-PACIFIC PAPER BAG MARKET, BY PRICE POINT, 2022-2032 ($MILLION)
- TABLE 55. ASIA-PACIFIC PAPER BAG MARKET, BY END USER, 2022-2032 ($MILLION)
- TABLE 56. ASIA-PACIFIC PAPER BAG MARKET, BY DISTRIBUTION CHANNEL, 2022-2032 ($MILLION)
- TABLE 57. ASIA-PACIFIC PAPER BAG MARKET, BY COUNTRY, 2022-2032 ($MILLION)
- TABLE 58. CHINA PAPER BAG MARKET, BY PRODUCT TYPE, 2022-2032 ($MILLION)
- TABLE 59. CHINA PAPER BAG MARKET, BY PRICE POINT, 2022-2032 ($MILLION)
- TABLE 60. CHINA PAPER BAG MARKET, BY END USER, 2022-2032 ($MILLION)
- TABLE 61. CHINA PAPER BAG MARKET, BY DISTRIBUTION CHANNEL, 2022-2032 ($MILLION)
- TABLE 62. JAPAN PAPER BAG MARKET, BY PRODUCT TYPE, 2022-2032 ($MILLION)
- TABLE 63. JAPAN PAPER BAG MARKET, BY PRICE POINT, 2022-2032 ($MILLION)
- TABLE 64. JAPAN PAPER BAG MARKET, BY END USER, 2022-2032 ($MILLION)
- TABLE 65. JAPAN PAPER BAG MARKET, BY DISTRIBUTION CHANNEL, 2022-2032 ($MILLION)
- TABLE 66. INDIA PAPER BAG MARKET, BY PRODUCT TYPE, 2022-2032 ($MILLION)
- TABLE 67. INDIA PAPER BAG MARKET, BY PRICE POINT, 2022-2032 ($MILLION)
- TABLE 68. INDIA PAPER BAG MARKET, BY END USER, 2022-2032 ($MILLION)
- TABLE 69. INDIA PAPER BAG MARKET, BY DISTRIBUTION CHANNEL, 2022-2032 ($MILLION)
- TABLE 70. SOUTH KOREA PAPER BAG MARKET, BY PRODUCT TYPE, 2022-2032 ($MILLION)
- TABLE 71. SOUTH KOREA PAPER BAG MARKET, BY PRICE POINT, 2022-2032 ($MILLION)
- TABLE 72. SOUTH KOREA PAPER BAG MARKET, BY END USER, 2022-2032 ($MILLION)
- TABLE 73. SOUTH KOREA PAPER BAG MARKET, BY DISTRIBUTION CHANNEL, 2022-2032 ($MILLION)
- TABLE 74. AUSTRALIA PAPER BAG MARKET, BY PRODUCT TYPE, 2022-2032 ($MILLION)
- TABLE 75. AUSTRALIA PAPER BAG MARKET, BY PRICE POINT, 2022-2032 ($MILLION)
- TABLE 76. AUSTRALIA PAPER BAG MARKET, BY END USER, 2022-2032 ($MILLION)
- TABLE 77. AUSTRALIA PAPER BAG MARKET, BY DISTRIBUTION CHANNEL, 2022-2032 ($MILLION)
- TABLE 78. REST OF ASIA-PACIFIC PAPER BAG MARKET, BY PRODUCT TYPE, 2022-2032 ($MILLION)
- TABLE 79. REST OF ASIA-PACIFIC PAPER BAG MARKET, BY PRICE POINT, 2022-2032 ($MILLION)
- TABLE 80. REST OF ASIA-PACIFIC PAPER BAG MARKET, BY END USER, 2022-2032 ($MILLION)
- TABLE 81. REST OF ASIA-PACIFIC PAPER BAG MARKET, BY DISTRIBUTION CHANNEL, 2022-2032 ($MILLION)
- TABLE 82. LAMEA PAPER BAG MARKET, BY PRODUCT TYPE, 2022-2032 ($MILLION)
- TABLE 83. LAMEA PAPER BAG MARKET, BY PRICE POINT, 2022-2032 ($MILLION)
- TABLE 84. LAMEA PAPER BAG MARKET, BY END USER, 2022-2032 ($MILLION)
- TABLE 85. LAMEA PAPER BAG MARKET, BY DISTRIBUTION CHANNEL, 2022-2032 ($MILLION)
- TABLE 86. LAMEA PAPER BAG MARKET, BY COUNTRY, 2022-2032 ($MILLION)
- TABLE 87. BRAZIL PAPER BAG MARKET, BY PRODUCT TYPE, 2022-2032 ($MILLION)
- TABLE 88. BRAZIL PAPER BAG MARKET, BY PRICE POINT, 2022-2032 ($MILLION)
- TABLE 89. BRAZIL PAPER BAG MARKET, BY END USER, 2022-2032 ($MILLION)
- TABLE 90. BRAZIL PAPER BAG MARKET, BY DISTRIBUTION CHANNEL, 2022-2032 ($MILLION)
- TABLE 91. SOUTH AFRICA, PAPER BAG MARKET, BY PRODUCT TYPE, 2022-2032 ($MILLION)
- TABLE 92. SOUTH AFRICA, PAPER BAG MARKET, BY PRICE POINT, 2022-2032 ($MILLION)
- TABLE 93. SOUTH AFRICA, PAPER BAG MARKET, BY END USER, 2022-2032 ($MILLION)
- TABLE 94. SOUTH AFRICA, PAPER BAG MARKET, BY DISTRIBUTION CHANNEL, 2022-2032 ($MILLION)
- TABLE 95. SAUDI ARABIA PAPER BAG MARKET, BY PRODUCT TYPE, 2022-2032 ($MILLION)
- TABLE 96. SAUDI ARABIA PAPER BAG MARKET, BY PRICE POINT, 2022-2032 ($MILLION)
- TABLE 97. SAUDI ARABIA PAPER BAG MARKET, BY END USER, 2022-2032 ($MILLION)
- TABLE 98. SAUDI ARABIA PAPER BAG MARKET, BY DISTRIBUTION CHANNEL, 2022-2032 ($MILLION)
- TABLE 99. REST OF LAMEA PAPER BAG MARKET, BY PRODUCT TYPE, 2022-2032 ($MILLION)
- TABLE 100. REST OF LAMEA PAPER BAG MARKET, BY PRICE POINT, 2022-2032 ($MILLION)
- TABLE 101. REST OF LAMEA PAPER BAG MARKET, BY END USER, 2022-2032 ($MILLION)
- TABLE 102. REST OF LAMEA PAPER BAG MARKET, BY DISTRIBUTION CHANNEL, 2022-2032 ($MILLION)
- TABLE 103. MONDI PLC.: KEY EXECUTIVES
- TABLE 104. MONDI PLC.: COMPANY SNAPSHOT
- TABLE 105. MONDI PLC.: PRODUCT SEGMENTS
- TABLE 106. MONDI PLC.: PRODUCT PORTFOLIO
- TABLE 107. SMURFIT KAPPA GROUP: KEY EXECUTIVES
- TABLE 108. SMURFIT KAPPA GROUP: COMPANY SNAPSHOT
- TABLE 109. SMURFIT KAPPA GROUP: PRODUCT SEGMENTS
- TABLE 110. SMURFIT KAPPA GROUP: PRODUCT PORTFOLIO
- TABLE 111. INTERNATIONAL PAPER COMPANY: KEY EXECUTIVES
- TABLE 112. INTERNATIONAL PAPER COMPANY: COMPANY SNAPSHOT
- TABLE 113. INTERNATIONAL PAPER COMPANY: PRODUCT SEGMENTS
- TABLE 114. INTERNATIONAL PAPER COMPANY: PRODUCT PORTFOLIO
- TABLE 115. NOVOLEX: KEY EXECUTIVES
- TABLE 116. NOVOLEX: COMPANY SNAPSHOT
- TABLE 117. NOVOLEX: PRODUCT SEGMENTS
- TABLE 118. NOVOLEX: PRODUCT PORTFOLIO
- TABLE 119. RONPAK, INC.: KEY EXECUTIVES
- TABLE 120. RONPAK, INC.: COMPANY SNAPSHOT
- TABLE 121. RONPAK, INC.: PRODUCT SEGMENTS
- TABLE 122. RONPAK, INC.: PRODUCT PORTFOLIO
- TABLE 123. UNITED BAG, INC.: KEY EXECUTIVES
- TABLE 124. UNITED BAG, INC.: COMPANY SNAPSHOT
- TABLE 125. UNITED BAG, INC.: PRODUCT SEGMENTS
- TABLE 126. UNITED BAG, INC.: PRODUCT PORTFOLIO
- TABLE 127. GLOBAL-PAK, INC.: KEY EXECUTIVES
- TABLE 128. GLOBAL-PAK, INC.: COMPANY SNAPSHOT
- TABLE 129. GLOBAL-PAK, INC.: PRODUCT SEGMENTS
- TABLE 130. GLOBAL-PAK, INC.: PRODUCT PORTFOLIO
- TABLE 131. PAPERBAGS LTD.: KEY EXECUTIVES
- TABLE 132. PAPERBAGS LTD.: COMPANY SNAPSHOT
- TABLE 133. PAPERBAGS LTD.: PRODUCT SEGMENTS
- TABLE 134. PAPERBAGS LTD.: PRODUCT PORTFOLIO
- TABLE 135. YORK PAPER COMPANY LTD.: KEY EXECUTIVES
- TABLE 136. YORK PAPER COMPANY LTD.: COMPANY SNAPSHOT
- TABLE 137. YORK PAPER COMPANY LTD.: PRODUCT SEGMENTS
- TABLE 138. YORK PAPER COMPANY LTD.: PRODUCT PORTFOLIO
- TABLE 139. WELTON BIBBY AND BARON LIMITED: KEY EXECUTIVES
- TABLE 140. WELTON BIBBY AND BARON LIMITED: COMPANY SNAPSHOT
- TABLE 141. WELTON BIBBY AND BARON LIMITED: PRODUCT SEGMENTS
- TABLE 142. WELTON BIBBY AND BARON LIMITED: PRODUCT PORTFOLIO
LIST OF FIGURES
- FIGURE 01. PAPER BAG MARKET, 2022-2032
- FIGURE 02. SEGMENTATION OF PAPER BAG MARKET,2022-2032
- FIGURE 03. TOP IMPACTING FACTORS IN PAPER BAG MARKET (2022 TO 2032)
- FIGURE 04. TOP INVESTMENT POCKETS IN PAPER BAG MARKET (2023-2032)
- FIGURE 05. MODERATE BARGAINING POWER OF SUPPLIERS
- FIGURE 06. MODERATE THREAT OF NEW ENTRANTS
- FIGURE 07. MODERATE THREAT OF SUBSTITUTES
- FIGURE 08. HIGH INTENSITY OF RIVALRY
- FIGURE 09. MODERATE BARGAINING POWER OF BUYERS
- FIGURE 10. GLOBAL PAPER BAG MARKET:DRIVERS, RESTRAINTS AND OPPORTUNITIES
- FIGURE 11. PAPER BAG MARKET, BY PRODUCT TYPE, 2022 AND 2032(%)
- FIGURE 12. COMPARATIVE SHARE ANALYSIS OF PAPER BAG MARKET FOR SEWN OPEN MOUTH, BY COUNTRY 2022 AND 2032(%)
- FIGURE 13. COMPARATIVE SHARE ANALYSIS OF PAPER BAG MARKET FOR PINCHED BOTTOM OPEN MOUTH, BY COUNTRY 2022 AND 2032(%)
- FIGURE 14. COMPARATIVE SHARE ANALYSIS OF PAPER BAG MARKET FOR PASTED VALVE, BY COUNTRY 2022 AND 2032(%)
- FIGURE 15. COMPARATIVE SHARE ANALYSIS OF PAPER BAG MARKET FOR PASTED OPEN MOUTH, BY COUNTRY 2022 AND 2032(%)
- FIGURE 16. COMPARATIVE SHARE ANALYSIS OF PAPER BAG MARKET FOR FLAT BOTTOM, BY COUNTRY 2022 AND 2032(%)
- FIGURE 17. PAPER BAG MARKET, BY PRICE POINT, 2022 AND 2032(%)
- FIGURE 18. COMPARATIVE SHARE ANALYSIS OF PAPER BAG MARKET FOR PREMIUM, BY COUNTRY 2022 AND 2032(%)
- FIGURE 19. COMPARATIVE SHARE ANALYSIS OF PAPER BAG MARKET FOR MEDIUM, BY COUNTRY 2022 AND 2032(%)
- FIGURE 20. COMPARATIVE SHARE ANALYSIS OF PAPER BAG MARKET FOR ECONOMY, BY COUNTRY 2022 AND 2032(%)
- FIGURE 21. PAPER BAG MARKET, BY END USER, 2022 AND 2032(%)
- FIGURE 22. COMPARATIVE SHARE ANALYSIS OF PAPER BAG MARKET FOR AGRICULTURE AND ALLIED INDUSTRIES, BY COUNTRY 2022 AND 2032(%)
- FIGURE 23. COMPARATIVE SHARE ANALYSIS OF PAPER BAG MARKET FOR BUILDING AND CONS, BY COUNTRY 2022 AND 2032(%)
- FIGURE 24. COMPARATIVE SHARE ANALYSIS OF PAPER BAG MARKET FOR FOOD AND BEVERAGE, BY COUNTRY 2022 AND 2032(%)
- FIGURE 25. COMPARATIVE SHARE ANALYSIS OF PAPER BAG MARKET FOR RETAIL, BY COUNTRY 2022 AND 2032(%)
- FIGURE 26. COMPARATIVE SHARE ANALYSIS OF PAPER BAG MARKET FOR CHEMICALS, BY COUNTRY 2022 AND 2032(%)
- FIGURE 27. COMPARATIVE SHARE ANALYSIS OF PAPER BAG MARKET FOR PHARMACEUTICAL, BY COUNTRY 2022 AND 2032(%)
- FIGURE 28. COMPARATIVE SHARE ANALYSIS OF PAPER BAG MARKET FOR MERCHANDISE, BY COUNTRY 2022 AND 2032(%)
- FIGURE 29. COMPARATIVE SHARE ANALYSIS OF PAPER BAG MARKET FOR OTHERS, BY COUNTRY 2022 AND 2032(%)
- FIGURE 30. PAPER BAG MARKET, BY DISTRIBUTION CHANNEL, 2022 AND 2032(%)
- FIGURE 31. COMPARATIVE SHARE ANALYSIS OF PAPER BAG MARKET FOR B2B, BY COUNTRY 2022 AND 2032(%)
- FIGURE 32. COMPARATIVE SHARE ANALYSIS OF PAPER BAG MARKET FOR B2C, BY COUNTRY 2022 AND 2032(%)
- FIGURE 33. PAPER BAG MARKET BY REGION, 2022 AND 2032(%)
- FIGURE 34. GERMANY PAPER BAG MARKET, 2022-2032 ($MILLION)
- FIGURE 35. FRANCE PAPER BAG MARKET, 2022-2032 ($MILLION)
- FIGURE 36. ITALY PAPER BAG MARKET, 2022-2032 ($MILLION)
- FIGURE 37. SPAIN PAPER BAG MARKET, 2022-2032 ($MILLION)
- FIGURE 38. UK PAPER BAG MARKET, 2022-2032 ($MILLION)
- FIGURE 39. REST OF EUROPE PAPER BAG MARKET, 2022-2032 ($MILLION)
- FIGURE 40. CHINA PAPER BAG MARKET, 2022-2032 ($MILLION)
- FIGURE 41. JAPAN PAPER BAG MARKET, 2022-2032 ($MILLION)
- FIGURE 42. INDIA PAPER BAG MARKET, 2022-2032 ($MILLION)
- FIGURE 43. SOUTH KOREA PAPER BAG MARKET, 2022-2032 ($MILLION)
- FIGURE 44. AUSTRALIA PAPER BAG MARKET, 2022-2032 ($MILLION)
- FIGURE 45. REST OF ASIA-PACIFIC PAPER BAG MARKET, 2022-2032 ($MILLION)
- FIGURE 46. BRAZIL PAPER BAG MARKET, 2022-2032 ($MILLION)
- FIGURE 47. SOUTH AFRICA, PAPER BAG MARKET, 2022-2032 ($MILLION)
- FIGURE 48. SAUDI ARABIA PAPER BAG MARKET, 2022-2032 ($MILLION)
- FIGURE 49. REST OF LAMEA PAPER BAG MARKET, 2022-2032 ($MILLION)
- FIGURE 50. TOP WINNING STRATEGIES, BY YEAR
- FIGURE 51. TOP WINNING STRATEGIES, BY DEVELOPMENT
- FIGURE 52. TOP WINNING STRATEGIES, BY COMPANY
- FIGURE 53. PRODUCT MAPPING OF TOP 10 PLAYERS
- FIGURE 54. COMPETITIVE DASHBOARD
- FIGURE 55. COMPETITIVE HEATMAP: PAPER BAG MARKET
- FIGURE 56. TOP PLAYER POSITIONING, 2022
- FIGURE 57. MONDI PLC.: NET REVENUE, 2020-2022 ($MILLION)
- FIGURE 58. MONDI PLC.: REVENUE SHARE BY SEGMENT, 2022 (%)
- FIGURE 59. MONDI PLC.: REVENUE SHARE BY REGION, 2022 (%)
- FIGURE 60. SMURFIT KAPPA GROUP: NET SALES, 2020-2022 ($MILLION)
- FIGURE 61. SMURFIT KAPPA GROUP: REVENUE SHARE BY SEGMENT, 2022 (%)
- FIGURE 62. SMURFIT KAPPA GROUP: REVENUE SHARE BY REGION, 2022 (%)
- FIGURE 63. INTERNATIONAL PAPER COMPANY: NET SALES, 2020-2022 ($MILLION)
- FIGURE 64. INTERNATIONAL PAPER COMPANY: REVENUE SHARE BY SEGMENT, 2022 (%)
- FIGURE 65. INTERNATIONAL PAPER COMPANY: REVENUE SHARE BY REGION, 2022 (%)
 多層袋市場:按產品類型、層數和應用分類 - 2025-2030 年全球預測
 到 2030 年再生紙袋市場預測:按產品類型、袋子類型、材料類型、厚度、最終用戶和地區進行的全球分析
 全球多層袋市場:到 2033 年的機會與策略
 多層袋市場、機會、成長動力、產業趨勢分析與預測,2024-2032 年
 全球紙本購物袋市場研究報告 - 2024 年至 2032 年產業分析、規模、佔有率、成長、趨勢與預測
 牛皮紙袋市場 - 全球規模、佔有率、趨勢分析、機會、預測報告,2019-2030
 2024 年紙袋世界市場報告
 麻袋牛皮紙 - 市場佔有率分析、產業趨勢與統計、成長預測(2024 - 2029)
 多層袋市場:按產品類型、層數和應用分類 - 2024-2030 年全球預測
 世界紙袋市場 - 產業趨勢與預測(截至 2031 年)