


 |
市場調查報告書
商品編碼
1472337
二硫代氨基甲酸鹽市場:按碳含量、按應用分類:2023-2032 年全球機會分析與產業預測Dithiocarbamate Market By Carbon Content (Mancozeb, Zineb, Propineb, Others), By Application (Fruits and Vegetables, Flowers, Crops, Others): Global Opportunity Analysis and Industry Forecast, 2023-2032 |
||||||
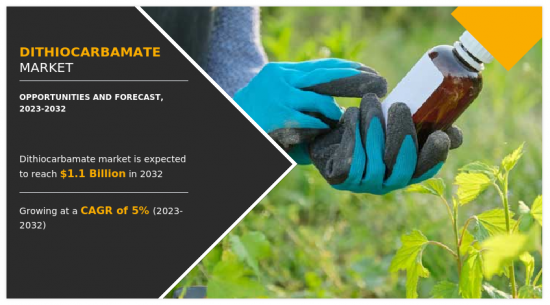
2022年全球二硫代氨基甲酸鹽市值為7億美元,預計2032年將達11億美元,2023年至2032年複合年成長率為5.0%。
二硫代氨基甲酸是含有硫、氮和碳原子的化合物,通常用作殺菌劑和金屬絡合劑。由仲胺與二硫化碳反應形成,具有螯合特性,可與多種金屬形成穩定的錯合。Dithiocarbamate廣泛應用於農業和工業,可用於金屬萃取、催化作用和添加劑,但其潛在毒性使其對環境敏感。
全球經濟趨勢和貿易模式也影響二硫代氨基甲酸鹽市場。新興市場(特別是亞太地區和拉丁美洲)的經濟成長導致農業和工業活動活性化,從而推動了對二硫代氨基甲酸鹽產品的需求。國際貿易協定和夥伴關係也透過開拓新市場並為市場相關人員創造擴大全球影響力的機會來影響市場動態。
此外,對環境問題和永續實踐的認知不斷提高是影響二硫代氨基甲酸鹽市場的趨勢。最終用戶和消費者越來越要求對環境影響最小並遵守永續實踐的產品。因此,製造商正在開發環保的二硫代氨基甲酸鹽配方,並創造出能夠滿足具有環保意識的消費者不斷變化的偏好的產品。
此外,世界各國政府對各種應用中化學品的使用實施了嚴格的規定,以確保環境和人類安全。不斷努力開發永續和環保的配方,促進了Dithiocarbamate產品的創新。這為市場相關人員開闢了新的途徑,並將Dithiocarbamate定位為各種環保解決方案的基本成分。
然而,隨著更永續的替代殺菌劑解決方案的出現,對Dithiocarbamate類殺菌劑的需求正在減少,這也是影響Dithiocarbamate市場的一個因素。環保意識的增強增加了對生態友善生物基農藥作為傳統化學品替代品的需求。隨著消費者越來越意識到農業活動對環境的影響,生物農藥和有機農業方法越來越受歡迎。消費者偏好的這些變化以及農民對永續農業實踐的採用給Dithiocarbamate市場帶來了挑戰。
然而,人們對環境問題的認知不斷提高以及對永續水資源管理實踐的需求正在為二硫代氨基甲酸鹽市場創造新的途徑。二硫代氨基甲酸在水處理應用中顯示出前景,特別是在去除工業廢水中的重金屬方面。這些化合物能夠與金屬離子形成穩定的錯合,使其在水淨化過程中發揮有效作用,滿足全球對清潔水資源的迫切需求。
二硫代氨基甲酸市場按類型、應用和地區細分。依類型分類,市場分為Mancozeb、代森鋅、代森鋅、福美雙等。依用途,市場分為水果和蔬菜、農產品、園藝和觀賞用途等。按地區分類,我們研究了北美、歐洲、亞太地區和拉丁美洲地區 (LAMEA) 的市場。
全球Dithiocarbamate市場報告提供了這些主要企業的概況以及詳細的競爭分析。
相關人員的主要利益
- 該報告提供了 2022 年至 2032 年Dithiocarbamate市場分析的細分市場、當前趨勢、估計和動態的定量分析,並確定了當前的Dithiocarbamate市場機會。
- 我們提供市場研究以及與市場促進因素、市場限制和市場機會相關的資訊。
- 波特的五力分析揭示了買家和供應商的潛力,幫助相關人員做出利潤驅動的業務決策並加強供應商和買家網路。
- 對Dithiocarbamate酸鹽市場細分的詳細分析有助於識別市場機會。
- 每個地區的主要國家都根據其對全球市場的收益貢獻繪製了地圖。
- 市場參與者定位有助於基準化分析,並可以清楚地了解市場參與者的當前地位。
- 包括區域和全球Dithiocarbamate市場趨勢、主要企業、細分市場、應用領域和市場成長策略的分析。
可以使用此報告進行報告客製化(需要額外費用和時間表)
- 投資機會
- 產品生命週期
- 國家、區域和全球各級的患者/流行病學資料
- 監管指引
- 根據客戶興趣新增其他公司簡介
- 按國家或地區進行的附加分析 – 市場規模和預測
- 平均售價分析/價位分析
- 公司簡介的擴充列表
- 歷史市場資料
- 導入/匯出分析/資料
- 主要參與者的詳細資料(Excel格式,包括位置、聯絡資訊、供應商/供應商網路等)
- 客戶/消費者/原料供應商名單 - 價值鏈分析
- SWOT分析
目錄
第1章簡介
第 2 章執行摘要
第3章市場概況
- 市場定義和範圍
- 主要發現
- 影響因素
- 主要投資機會
- 波特五力分析
- 市場動態
- 促進因素
- 抑制因素
- 機會
- 價值鏈分析
- 價格分析
- 關鍵監管分析
- 專利情況
第4章 二硫代氨基甲酸鹽市場:依碳含量分類
- 概述
- Mancozeb
- 代尼布
- 丙森鋅
- 其他
第5章二硫代氨基甲酸鹽市場:依應用分類
- 概述
- 水果和蔬菜
- 花朵
- 農作物
- 其他
第6章二硫代氨基甲酸鹽市場:依地區
- 概述
- 北美洲
- 美國
- 加拿大
- 墨西哥
- 歐洲
- 英國
- 俄羅斯
- 波蘭
- 挪威
- 瑞士
- 其他
- 亞太地區
- 中國
- 印度
- 日本
- 韓國
- 澳洲
- 其他
- 拉丁美洲/中東/非洲
- 巴西
- 沙烏地阿拉伯
- 南非
- 其他
第7章 競爭格局
- 介紹
- 關鍵成功策略
- 10家主要企業產品圖譜
- 競爭對手儀表板
- 競爭熱圖
- 2022年主要企業定位
第8章 公司簡介
- AkzoNobel
- Arkema
- LANXESS
- Albemarle Corporation
- TCI Chemicals
- Thermo Fisher Scientific
- Merck
- SIDDHARTH CHEMICALS
- Nouryon
- Jinchangsheng Chemical Technology Co.,Ltd
The global dithiocarbamate market was valued at $0.7 billion in 2022 and is estimated to reach $1.1 billion by 2032, exhibiting a CAGR of 5.0% from 2023 to 2032.
Dithiocarbamates are chemical compounds containing sulfur, nitrogen, and carbon atoms, commonly used as fungicides and metal complexing agents. Formed by reacting secondary amines with carbon disulfide, they exhibit chelating properties, forming stable complexes with various metals. Widely employed in agriculture and industry, dithiocarbamates have applications in metal extraction, catalysis, and as additives, albeit with environmental considerations due to potential toxicity.
Global economic trends and trade patterns also impact the dithiocarbamate market. Economic growth in emerging markets, particularly in Asia-Pacific and Latin America, has led to increased agricultural and industrial activities, driving the demand for dithiocarbamate-based products. In addition, international trade agreements and partnerships influence the market's dynamics by opening new markets and creating opportunities for market players to expand their presence globally.
Moreover, the awareness of environmental issues and sustainable practices is a growing trend that affects the dithiocarbamate market. End-users and consumers are increasingly demanding products that have minimal environmental impact and adhere to sustainable practices. This has prompted manufacturers to develop eco-friendly formulations of dithiocarbamates, ensuring that their products meet the evolving preferences of environmentally conscious consumers.
In addition, Governments globally are implementing stringent regulations regarding the use of chemical substances in different applications to ensure environmental and human safety. Continuous efforts to develop sustainable and eco-friendly formulations have led to innovations in dithiocarbamate-based products. This has opened new avenues for market players as well aspositioned dithiocarbamates as essential components in various environmentally responsible solutions.
However, the emergence of alternative and more sustainable fungicide solutions have reduced the demand for dithiocarbamate-based fungicides which in turn is another restraint influencing the dithiocarbamate market. As environmental awareness grows, there is rise in demand for eco-friendly and bio-based alternatives to conventional chemicals. Biopesticides and organic farming practices are gaining popularity as consumers become more conscious of the environmental impact of agricultural activities. This shift in consumer preferences and the adoption of sustainable practices by farmers pose a challenge to the dithiocarbamate market, as these alternatives offer effective solutions with fewer environmental and health concerns.
However, rise in awareness of environmental issues and the need for sustainable water management practices present a new avenue for the dithiocarbamate market. Dithiocarbamates have shown promise in water treatment applications, specifically in the removal of heavy metals from industrial effluents. The ability of these compounds to form stable complexes with metal ions makes them effective in water remediation processes, addressing a critical need for clean water resources globally.
The dithiocarbamate market is segmented on the basis of type, application, and region. On the basis of type, the market is categorized into mancozeb, propineb, zineb, thiram, and others. By application, the market is classified into fruits and vegetables, agricultural crops, horticulture and ornamental, and others. Region-wise, the market is studied across North America, Europe, Asia-Pacific, and LAMEA.
The global dithiocarbamate market profiles leading players that include AkzoNobel, Arkema, LANXESS, Albemarle Corporation, TCI Chemicals, Thermo Fisher Scientific, Merck, SIDDHARTH CHEMICALS, Nouryon, and Jinchangsheng Chemical Technology Co., Ltd.
Other key players involved in the manufacturing of dithiocarbamate includes Biosynth, Yasho Industries, DHANUKA AGRITECH LTD., Sikko Industries Ltd., Alpha Chemika, Suvidhinath Laboratories, Aroxa Crop Science Pvt. Ltd., and others.
The global dithiocarbamate market report provides in-depth competitive analysis as well as profiles of these major players.
Key Benefits For Stakeholders
- This report provides a quantitative analysis of the market segments, current trends, estimations, and dynamics of the dithiocarbamate market analysis from 2022 to 2032 to identify the prevailing dithiocarbamate market opportunities.
- The market research is offered along with information related to key drivers, restraints, and opportunities.
- Porter's five forces analysis highlights the potency of buyers and suppliers to enable stakeholders make profit-oriented business decisions and strengthen their supplier-buyer network.
- In-depth analysis of the dithiocarbamate market segmentation assists to determine the prevailing market opportunities.
- Major countries in each region are mapped according to their revenue contribution to the global market.
- Market player positioning facilitates benchmarking and provides a clear understanding of the present position of the market players.
- The report includes the analysis of the regional as well as global dithiocarbamate market trends, key players, market segments, application areas, and market growth strategies.
Additional benefits you will get with this purchase are:
- Quarterly Update and* (only available with a corporate license, on listed price)
- 5 additional Company Profile of client Choice pre- or Post-purchase, as a free update.
- Free Upcoming Version on the Purchase of Five and Enterprise User License.
- 16 analyst hours of support* (post-purchase, if you find additional data requirements upon review of the report, you may receive support amounting to 16 analyst hours to solve questions, and post-sale queries)
- 15% Free Customization* (in case the scope or segment of the report does not match your requirements, 15% is equivalent to 3 working days of free work, applicable once)
- Free data Pack on the Five and Enterprise User License. (Excel version of the report)
- Free Updated report if the report is 6-12 months old or older.
- 24-hour priority response*
- Free Industry updates and white papers.
Possible Customization with this report (with additional cost and timeline, please talk to the sales executive to know more)
- Investment Opportunities
- Product Life Cycles
- Patient/epidemiology data at country, region, global level
- Regulatory Guidelines
- Additional company profiles with specific to client's interest
- Additional country or region analysis- market size and forecast
- Average Selling Price Analysis / Price Point Analysis
- Expanded list for Company Profiles
- Historic market data
- Import Export Analysis/Data
- Key player details (including location, contact details, supplier/vendor network etc. in excel format)
- List of customers/consumers/raw material suppliers- value chain analysis
- SWOT Analysis
Key Market Segments
By Application
- Fruits and Vegetables
- Flowers
- Crops
- Others
By Carbon Content
- Mancozeb
- Zineb
- Propineb
- Others
By Region
- North America
- U.S.
- Canada
- Mexico
- Europe
- UK
- Russia
- Poland
- Norway
- Switzerland
- Rest of Europe
- Asia-Pacific
- China
- India
- Japan
- South Korea
- Australia
- Rest of Asia-Pacific
- LAMEA
- Brazil
- Saudi Arabia
- South Africa
- Rest of LAMEA
Key Market Players:
- AkzoNobel
- Arkema
- LANXESS
- Albemarle Corporation
- TCI Chemicals
- Thermo Fisher Scientific
- Merck
- SIDDHARTH CHEMICALS
- Nouryon
- Jinchangsheng Chemical Technology Co.,Ltd
TABLE OF CONTENTS
CHAPTER 1: INTRODUCTION
- 1.1. Report description
- 1.2. Key market segments
- 1.3. Key benefits to the stakeholders
- 1.4. Research methodology
- 1.4.1. Primary research
- 1.4.2. Secondary research
- 1.4.3. Analyst tools and models
CHAPTER 2: EXECUTIVE SUMMARY
- 2.1. CXO perspective
CHAPTER 3: MARKET OVERVIEW
- 3.1. Market definition and scope
- 3.2. Key findings
- 3.2.1. Top impacting factors
- 3.2.2. Top investment pockets
- 3.3. Porter's five forces analysis
- 3.4. Market dynamics
- 3.4.1. Drivers
- 3.4.2. Restraints
- 3.4.3. Opportunities
- 3.5. Value Chain Analysis
- 3.6. Pricing Analysis
- 3.7. Key Regulation Analysis
- 3.8. Patent Landscape
CHAPTER 4: DITHIOCARBAMATE MARKET, BY CARBON CONTENT
- 4.1. Overview
- 4.1.1. Market size and forecast
- 4.2. Mancozeb
- 4.2.1. Key market trends, growth factors and opportunities
- 4.2.2. Market size and forecast, by region
- 4.2.3. Market share analysis by country
- 4.3. Zineb
- 4.3.1. Key market trends, growth factors and opportunities
- 4.3.2. Market size and forecast, by region
- 4.3.3. Market share analysis by country
- 4.4. Propineb
- 4.4.1. Key market trends, growth factors and opportunities
- 4.4.2. Market size and forecast, by region
- 4.4.3. Market share analysis by country
- 4.5. Others
- 4.5.1. Key market trends, growth factors and opportunities
- 4.5.2. Market size and forecast, by region
- 4.5.3. Market share analysis by country
CHAPTER 5: DITHIOCARBAMATE MARKET, BY APPLICATION
- 5.1. Overview
- 5.1.1. Market size and forecast
- 5.2. Fruits and Vegetables
- 5.2.1. Key market trends, growth factors and opportunities
- 5.2.2. Market size and forecast, by region
- 5.2.3. Market share analysis by country
- 5.3. Flowers
- 5.3.1. Key market trends, growth factors and opportunities
- 5.3.2. Market size and forecast, by region
- 5.3.3. Market share analysis by country
- 5.4. Crops
- 5.4.1. Key market trends, growth factors and opportunities
- 5.4.2. Market size and forecast, by region
- 5.4.3. Market share analysis by country
- 5.5. Others
- 5.5.1. Key market trends, growth factors and opportunities
- 5.5.2. Market size and forecast, by region
- 5.5.3. Market share analysis by country
CHAPTER 6: DITHIOCARBAMATE MARKET, BY REGION
- 6.1. Overview
- 6.1.1. Market size and forecast By Region
- 6.2. North America
- 6.2.1. Key market trends, growth factors and opportunities
- 6.2.2. Market size and forecast, by Carbon Content
- 6.2.3. Market size and forecast, by Application
- 6.2.4. Market size and forecast, by country
- 6.2.4.1. U.S.
- 6.2.4.1.1. Market size and forecast, by Carbon Content
- 6.2.4.1.2. Market size and forecast, by Application
- 6.2.4.2. Canada
- 6.2.4.2.1. Market size and forecast, by Carbon Content
- 6.2.4.2.2. Market size and forecast, by Application
- 6.2.4.3. Mexico
- 6.2.4.3.1. Market size and forecast, by Carbon Content
- 6.2.4.3.2. Market size and forecast, by Application
- 6.3. Europe
- 6.3.1. Key market trends, growth factors and opportunities
- 6.3.2. Market size and forecast, by Carbon Content
- 6.3.3. Market size and forecast, by Application
- 6.3.4. Market size and forecast, by country
- 6.3.4.1. UK
- 6.3.4.1.1. Market size and forecast, by Carbon Content
- 6.3.4.1.2. Market size and forecast, by Application
- 6.3.4.2. Russia
- 6.3.4.2.1. Market size and forecast, by Carbon Content
- 6.3.4.2.2. Market size and forecast, by Application
- 6.3.4.3. Poland
- 6.3.4.3.1. Market size and forecast, by Carbon Content
- 6.3.4.3.2. Market size and forecast, by Application
- 6.3.4.4. Norway
- 6.3.4.4.1. Market size and forecast, by Carbon Content
- 6.3.4.4.2. Market size and forecast, by Application
- 6.3.4.5. Switzerland
- 6.3.4.5.1. Market size and forecast, by Carbon Content
- 6.3.4.5.2. Market size and forecast, by Application
- 6.3.4.6. Rest of Europe
- 6.3.4.6.1. Market size and forecast, by Carbon Content
- 6.3.4.6.2. Market size and forecast, by Application
- 6.4. Asia-Pacific
- 6.4.1. Key market trends, growth factors and opportunities
- 6.4.2. Market size and forecast, by Carbon Content
- 6.4.3. Market size and forecast, by Application
- 6.4.4. Market size and forecast, by country
- 6.4.4.1. China
- 6.4.4.1.1. Market size and forecast, by Carbon Content
- 6.4.4.1.2. Market size and forecast, by Application
- 6.4.4.2. India
- 6.4.4.2.1. Market size and forecast, by Carbon Content
- 6.4.4.2.2. Market size and forecast, by Application
- 6.4.4.3. Japan
- 6.4.4.3.1. Market size and forecast, by Carbon Content
- 6.4.4.3.2. Market size and forecast, by Application
- 6.4.4.4. South Korea
- 6.4.4.4.1. Market size and forecast, by Carbon Content
- 6.4.4.4.2. Market size and forecast, by Application
- 6.4.4.5. Australia
- 6.4.4.5.1. Market size and forecast, by Carbon Content
- 6.4.4.5.2. Market size and forecast, by Application
- 6.4.4.6. Rest of Asia-Pacific
- 6.4.4.6.1. Market size and forecast, by Carbon Content
- 6.4.4.6.2. Market size and forecast, by Application
- 6.5. LAMEA
- 6.5.1. Key market trends, growth factors and opportunities
- 6.5.2. Market size and forecast, by Carbon Content
- 6.5.3. Market size and forecast, by Application
- 6.5.4. Market size and forecast, by country
- 6.5.4.1. Brazil
- 6.5.4.1.1. Market size and forecast, by Carbon Content
- 6.5.4.1.2. Market size and forecast, by Application
- 6.5.4.2. Saudi Arabia
- 6.5.4.2.1. Market size and forecast, by Carbon Content
- 6.5.4.2.2. Market size and forecast, by Application
- 6.5.4.3. South Africa
- 6.5.4.3.1. Market size and forecast, by Carbon Content
- 6.5.4.3.2. Market size and forecast, by Application
- 6.5.4.4. Rest of LAMEA
- 6.5.4.4.1. Market size and forecast, by Carbon Content
- 6.5.4.4.2. Market size and forecast, by Application
CHAPTER 7: COMPETITIVE LANDSCAPE
- 7.1. Introduction
- 7.2. Top winning strategies
- 7.3. Product mapping of top 10 player
- 7.4. Competitive dashboard
- 7.5. Competitive heatmap
- 7.6. Top player positioning, 2022
CHAPTER 8: COMPANY PROFILES
- 8.1. AkzoNobel
- 8.1.1. Company overview
- 8.1.2. Key executives
- 8.1.3. Company snapshot
- 8.1.4. Operating business segments
- 8.1.5. Product portfolio
- 8.1.6. Business performance
- 8.1.7. Key strategic moves and developments
- 8.2. Arkema
- 8.2.1. Company overview
- 8.2.2. Key executives
- 8.2.3. Company snapshot
- 8.2.4. Operating business segments
- 8.2.5. Product portfolio
- 8.2.6. Business performance
- 8.2.7. Key strategic moves and developments
- 8.3. LANXESS
- 8.3.1. Company overview
- 8.3.2. Key executives
- 8.3.3. Company snapshot
- 8.3.4. Operating business segments
- 8.3.5. Product portfolio
- 8.3.6. Business performance
- 8.3.7. Key strategic moves and developments
- 8.4. Albemarle Corporation
- 8.4.1. Company overview
- 8.4.2. Key executives
- 8.4.3. Company snapshot
- 8.4.4. Operating business segments
- 8.4.5. Product portfolio
- 8.4.6. Business performance
- 8.4.7. Key strategic moves and developments
- 8.5. TCI Chemicals
- 8.5.1. Company overview
- 8.5.2. Key executives
- 8.5.3. Company snapshot
- 8.5.4. Operating business segments
- 8.5.5. Product portfolio
- 8.5.6. Business performance
- 8.5.7. Key strategic moves and developments
- 8.6. Thermo Fisher Scientific
- 8.6.1. Company overview
- 8.6.2. Key executives
- 8.6.3. Company snapshot
- 8.6.4. Operating business segments
- 8.6.5. Product portfolio
- 8.6.6. Business performance
- 8.6.7. Key strategic moves and developments
- 8.7. Merck
- 8.7.1. Company overview
- 8.7.2. Key executives
- 8.7.3. Company snapshot
- 8.7.4. Operating business segments
- 8.7.5. Product portfolio
- 8.7.6. Business performance
- 8.7.7. Key strategic moves and developments
- 8.8. SIDDHARTH CHEMICALS
- 8.8.1. Company overview
- 8.8.2. Key executives
- 8.8.3. Company snapshot
- 8.8.4. Operating business segments
- 8.8.5. Product portfolio
- 8.8.6. Business performance
- 8.8.7. Key strategic moves and developments
- 8.9. Nouryon
- 8.9.1. Company overview
- 8.9.2. Key executives
- 8.9.3. Company snapshot
- 8.9.4. Operating business segments
- 8.9.5. Product portfolio
- 8.9.6. Business performance
- 8.9.7. Key strategic moves and developments
- 8.10. Jinchangsheng Chemical Technology Co.,Ltd
- 8.10.1. Company overview
- 8.10.2. Key executives
- 8.10.3. Company snapshot
- 8.10.4. Operating business segments
- 8.10.5. Product portfolio
- 8.10.6. Business performance
- 8.10.7. Key strategic moves and developments
LIST OF TABLES
- TABLE 01. GLOBAL DITHIOCARBAMATE MARKET, BY CARBON CONTENT, 2022-2032 ($MILLION)
- TABLE 02. GLOBAL DITHIOCARBAMATE MARKET, BY CARBON CONTENT, 2022-2032 (TONS)
- TABLE 03. DITHIOCARBAMATE MARKET FOR MANCOZEB, BY REGION, 2022-2032 ($MILLION)
- TABLE 04. DITHIOCARBAMATE MARKET FOR MANCOZEB, BY REGION, 2022-2032 (TONS)
- TABLE 05. DITHIOCARBAMATE MARKET FOR ZINEB, BY REGION, 2022-2032 ($MILLION)
- TABLE 06. DITHIOCARBAMATE MARKET FOR ZINEB, BY REGION, 2022-2032 (TONS)
- TABLE 07. DITHIOCARBAMATE MARKET FOR PROPINEB, BY REGION, 2022-2032 ($MILLION)
- TABLE 08. DITHIOCARBAMATE MARKET FOR PROPINEB, BY REGION, 2022-2032 (TONS)
- TABLE 09. DITHIOCARBAMATE MARKET FOR OTHERS, BY REGION, 2022-2032 ($MILLION)
- TABLE 10. DITHIOCARBAMATE MARKET FOR OTHERS, BY REGION, 2022-2032 (TONS)
- TABLE 11. GLOBAL DITHIOCARBAMATE MARKET, BY APPLICATION, 2022-2032 ($MILLION)
- TABLE 12. GLOBAL DITHIOCARBAMATE MARKET, BY APPLICATION, 2022-2032 (TONS)
- TABLE 13. DITHIOCARBAMATE MARKET FOR FRUITS AND VEGETABLES, BY REGION, 2022-2032 ($MILLION)
- TABLE 14. DITHIOCARBAMATE MARKET FOR FRUITS AND VEGETABLES, BY REGION, 2022-2032 (TONS)
- TABLE 15. DITHIOCARBAMATE MARKET FOR FLOWERS, BY REGION, 2022-2032 ($MILLION)
- TABLE 16. DITHIOCARBAMATE MARKET FOR FLOWERS, BY REGION, 2022-2032 (TONS)
- TABLE 17. DITHIOCARBAMATE MARKET FOR CROPS, BY REGION, 2022-2032 ($MILLION)
- TABLE 18. DITHIOCARBAMATE MARKET FOR CROPS, BY REGION, 2022-2032 (TONS)
- TABLE 19. DITHIOCARBAMATE MARKET FOR OTHERS, BY REGION, 2022-2032 ($MILLION)
- TABLE 20. DITHIOCARBAMATE MARKET FOR OTHERS, BY REGION, 2022-2032 (TONS)
- TABLE 21. DITHIOCARBAMATE MARKET, BY REGION, 2022-2032 ($MILLION)
- TABLE 22. DITHIOCARBAMATE MARKET, BY REGION, 2022-2032 (TONS)
- TABLE 23. NORTH AMERICA DITHIOCARBAMATE MARKET, BY CARBON CONTENT, 2022-2032 ($MILLION)
- TABLE 24. NORTH AMERICA DITHIOCARBAMATE MARKET, BY CARBON CONTENT, 2022-2032 (TONS)
- TABLE 25. NORTH AMERICA DITHIOCARBAMATE MARKET, BY APPLICATION, 2022-2032 ($MILLION)
- TABLE 26. NORTH AMERICA DITHIOCARBAMATE MARKET, BY APPLICATION, 2022-2032 (TONS)
- TABLE 27. NORTH AMERICA DITHIOCARBAMATE MARKET, BY COUNTRY, 2022-2032 ($MILLION)
- TABLE 28. NORTH AMERICA DITHIOCARBAMATE MARKET, BY COUNTRY, 2022-2032 (TONS)
- TABLE 29. U.S. DITHIOCARBAMATE MARKET, BY CARBON CONTENT, 2022-2032 ($MILLION)
- TABLE 30. U.S. DITHIOCARBAMATE MARKET, BY CARBON CONTENT, 2022-2032 (TONS)
- TABLE 31. U.S. DITHIOCARBAMATE MARKET, BY APPLICATION, 2022-2032 ($MILLION)
- TABLE 32. U.S. DITHIOCARBAMATE MARKET, BY APPLICATION, 2022-2032 (TONS)
- TABLE 33. CANADA DITHIOCARBAMATE MARKET, BY CARBON CONTENT, 2022-2032 ($MILLION)
- TABLE 34. CANADA DITHIOCARBAMATE MARKET, BY CARBON CONTENT, 2022-2032 (TONS)
- TABLE 35. CANADA DITHIOCARBAMATE MARKET, BY APPLICATION, 2022-2032 ($MILLION)
- TABLE 36. CANADA DITHIOCARBAMATE MARKET, BY APPLICATION, 2022-2032 (TONS)
- TABLE 37. MEXICO DITHIOCARBAMATE MARKET, BY CARBON CONTENT, 2022-2032 ($MILLION)
- TABLE 38. MEXICO DITHIOCARBAMATE MARKET, BY CARBON CONTENT, 2022-2032 (TONS)
- TABLE 39. MEXICO DITHIOCARBAMATE MARKET, BY APPLICATION, 2022-2032 ($MILLION)
- TABLE 40. MEXICO DITHIOCARBAMATE MARKET, BY APPLICATION, 2022-2032 (TONS)
- TABLE 41. EUROPE DITHIOCARBAMATE MARKET, BY CARBON CONTENT, 2022-2032 ($MILLION)
- TABLE 42. EUROPE DITHIOCARBAMATE MARKET, BY CARBON CONTENT, 2022-2032 (TONS)
- TABLE 43. EUROPE DITHIOCARBAMATE MARKET, BY APPLICATION, 2022-2032 ($MILLION)
- TABLE 44. EUROPE DITHIOCARBAMATE MARKET, BY APPLICATION, 2022-2032 (TONS)
- TABLE 45. EUROPE DITHIOCARBAMATE MARKET, BY COUNTRY, 2022-2032 ($MILLION)
- TABLE 46. EUROPE DITHIOCARBAMATE MARKET, BY COUNTRY, 2022-2032 (TONS)
- TABLE 47. UK DITHIOCARBAMATE MARKET, BY CARBON CONTENT, 2022-2032 ($MILLION)
- TABLE 48. UK DITHIOCARBAMATE MARKET, BY CARBON CONTENT, 2022-2032 (TONS)
- TABLE 49. UK DITHIOCARBAMATE MARKET, BY APPLICATION, 2022-2032 ($MILLION)
- TABLE 50. UK DITHIOCARBAMATE MARKET, BY APPLICATION, 2022-2032 (TONS)
- TABLE 51. RUSSIA DITHIOCARBAMATE MARKET, BY CARBON CONTENT, 2022-2032 ($MILLION)
- TABLE 52. RUSSIA DITHIOCARBAMATE MARKET, BY CARBON CONTENT, 2022-2032 (TONS)
- TABLE 53. RUSSIA DITHIOCARBAMATE MARKET, BY APPLICATION, 2022-2032 ($MILLION)
- TABLE 54. RUSSIA DITHIOCARBAMATE MARKET, BY APPLICATION, 2022-2032 (TONS)
- TABLE 55. POLAND DITHIOCARBAMATE MARKET, BY CARBON CONTENT, 2022-2032 ($MILLION)
- TABLE 56. POLAND DITHIOCARBAMATE MARKET, BY CARBON CONTENT, 2022-2032 (TONS)
- TABLE 57. POLAND DITHIOCARBAMATE MARKET, BY APPLICATION, 2022-2032 ($MILLION)
- TABLE 58. POLAND DITHIOCARBAMATE MARKET, BY APPLICATION, 2022-2032 (TONS)
- TABLE 59. NORWAY DITHIOCARBAMATE MARKET, BY CARBON CONTENT, 2022-2032 ($MILLION)
- TABLE 60. NORWAY DITHIOCARBAMATE MARKET, BY CARBON CONTENT, 2022-2032 (TONS)
- TABLE 61. NORWAY DITHIOCARBAMATE MARKET, BY APPLICATION, 2022-2032 ($MILLION)
- TABLE 62. NORWAY DITHIOCARBAMATE MARKET, BY APPLICATION, 2022-2032 (TONS)
- TABLE 63. SWITZERLAND DITHIOCARBAMATE MARKET, BY CARBON CONTENT, 2022-2032 ($MILLION)
- TABLE 64. SWITZERLAND DITHIOCARBAMATE MARKET, BY CARBON CONTENT, 2022-2032 (TONS)
- TABLE 65. SWITZERLAND DITHIOCARBAMATE MARKET, BY APPLICATION, 2022-2032 ($MILLION)
- TABLE 66. SWITZERLAND DITHIOCARBAMATE MARKET, BY APPLICATION, 2022-2032 (TONS)
- TABLE 67. REST OF EUROPE DITHIOCARBAMATE MARKET, BY CARBON CONTENT, 2022-2032 ($MILLION)
- TABLE 68. REST OF EUROPE DITHIOCARBAMATE MARKET, BY CARBON CONTENT, 2022-2032 (TONS)
- TABLE 69. REST OF EUROPE DITHIOCARBAMATE MARKET, BY APPLICATION, 2022-2032 ($MILLION)
- TABLE 70. REST OF EUROPE DITHIOCARBAMATE MARKET, BY APPLICATION, 2022-2032 (TONS)
- TABLE 71. ASIA-PACIFIC DITHIOCARBAMATE MARKET, BY CARBON CONTENT, 2022-2032 ($MILLION)
- TABLE 72. ASIA-PACIFIC DITHIOCARBAMATE MARKET, BY CARBON CONTENT, 2022-2032 (TONS)
- TABLE 73. ASIA-PACIFIC DITHIOCARBAMATE MARKET, BY APPLICATION, 2022-2032 ($MILLION)
- TABLE 74. ASIA-PACIFIC DITHIOCARBAMATE MARKET, BY APPLICATION, 2022-2032 (TONS)
- TABLE 75. ASIA-PACIFIC DITHIOCARBAMATE MARKET, BY COUNTRY, 2022-2032 ($MILLION)
- TABLE 76. ASIA-PACIFIC DITHIOCARBAMATE MARKET, BY COUNTRY, 2022-2032 (TONS)
- TABLE 77. CHINA DITHIOCARBAMATE MARKET, BY CARBON CONTENT, 2022-2032 ($MILLION)
- TABLE 78. CHINA DITHIOCARBAMATE MARKET, BY CARBON CONTENT, 2022-2032 (TONS)
- TABLE 79. CHINA DITHIOCARBAMATE MARKET, BY APPLICATION, 2022-2032 ($MILLION)
- TABLE 80. CHINA DITHIOCARBAMATE MARKET, BY APPLICATION, 2022-2032 (TONS)
- TABLE 81. INDIA DITHIOCARBAMATE MARKET, BY CARBON CONTENT, 2022-2032 ($MILLION)
- TABLE 82. INDIA DITHIOCARBAMATE MARKET, BY CARBON CONTENT, 2022-2032 (TONS)
- TABLE 83. INDIA DITHIOCARBAMATE MARKET, BY APPLICATION, 2022-2032 ($MILLION)
- TABLE 84. INDIA DITHIOCARBAMATE MARKET, BY APPLICATION, 2022-2032 (TONS)
- TABLE 85. JAPAN DITHIOCARBAMATE MARKET, BY CARBON CONTENT, 2022-2032 ($MILLION)
- TABLE 86. JAPAN DITHIOCARBAMATE MARKET, BY CARBON CONTENT, 2022-2032 (TONS)
- TABLE 87. JAPAN DITHIOCARBAMATE MARKET, BY APPLICATION, 2022-2032 ($MILLION)
- TABLE 88. JAPAN DITHIOCARBAMATE MARKET, BY APPLICATION, 2022-2032 (TONS)
- TABLE 89. SOUTH KOREA DITHIOCARBAMATE MARKET, BY CARBON CONTENT, 2022-2032 ($MILLION)
- TABLE 90. SOUTH KOREA DITHIOCARBAMATE MARKET, BY CARBON CONTENT, 2022-2032 (TONS)
- TABLE 91. SOUTH KOREA DITHIOCARBAMATE MARKET, BY APPLICATION, 2022-2032 ($MILLION)
- TABLE 92. SOUTH KOREA DITHIOCARBAMATE MARKET, BY APPLICATION, 2022-2032 (TONS)
- TABLE 93. AUSTRALIA DITHIOCARBAMATE MARKET, BY CARBON CONTENT, 2022-2032 ($MILLION)
- TABLE 94. AUSTRALIA DITHIOCARBAMATE MARKET, BY CARBON CONTENT, 2022-2032 (TONS)
- TABLE 95. AUSTRALIA DITHIOCARBAMATE MARKET, BY APPLICATION, 2022-2032 ($MILLION)
- TABLE 96. AUSTRALIA DITHIOCARBAMATE MARKET, BY APPLICATION, 2022-2032 (TONS)
- TABLE 97. REST OF ASIA-PACIFIC DITHIOCARBAMATE MARKET, BY CARBON CONTENT, 2022-2032 ($MILLION)
- TABLE 98. REST OF ASIA-PACIFIC DITHIOCARBAMATE MARKET, BY CARBON CONTENT, 2022-2032 (TONS)
- TABLE 99. REST OF ASIA-PACIFIC DITHIOCARBAMATE MARKET, BY APPLICATION, 2022-2032 ($MILLION)
- TABLE 100. REST OF ASIA-PACIFIC DITHIOCARBAMATE MARKET, BY APPLICATION, 2022-2032 (TONS)
- TABLE 101. LAMEA DITHIOCARBAMATE MARKET, BY CARBON CONTENT, 2022-2032 ($MILLION)
- TABLE 102. LAMEA DITHIOCARBAMATE MARKET, BY CARBON CONTENT, 2022-2032 (TONS)
- TABLE 103. LAMEA DITHIOCARBAMATE MARKET, BY APPLICATION, 2022-2032 ($MILLION)
- TABLE 104. LAMEA DITHIOCARBAMATE MARKET, BY APPLICATION, 2022-2032 (TONS)
- TABLE 105. LAMEA DITHIOCARBAMATE MARKET, BY COUNTRY, 2022-2032 ($MILLION)
- TABLE 106. LAMEA DITHIOCARBAMATE MARKET, BY COUNTRY, 2022-2032 (TONS)
- TABLE 107. BRAZIL DITHIOCARBAMATE MARKET, BY CARBON CONTENT, 2022-2032 ($MILLION)
- TABLE 108. BRAZIL DITHIOCARBAMATE MARKET, BY CARBON CONTENT, 2022-2032 (TONS)
- TABLE 109. BRAZIL DITHIOCARBAMATE MARKET, BY APPLICATION, 2022-2032 ($MILLION)
- TABLE 110. BRAZIL DITHIOCARBAMATE MARKET, BY APPLICATION, 2022-2032 (TONS)
- TABLE 111. SAUDI ARABIA DITHIOCARBAMATE MARKET, BY CARBON CONTENT, 2022-2032 ($MILLION)
- TABLE 112. SAUDI ARABIA DITHIOCARBAMATE MARKET, BY CARBON CONTENT, 2022-2032 (TONS)
- TABLE 113. SAUDI ARABIA DITHIOCARBAMATE MARKET, BY APPLICATION, 2022-2032 ($MILLION)
- TABLE 114. SAUDI ARABIA DITHIOCARBAMATE MARKET, BY APPLICATION, 2022-2032 (TONS)
- TABLE 115. SOUTH AFRICA DITHIOCARBAMATE MARKET, BY CARBON CONTENT, 2022-2032 ($MILLION)
- TABLE 116. SOUTH AFRICA DITHIOCARBAMATE MARKET, BY CARBON CONTENT, 2022-2032 (TONS)
- TABLE 117. SOUTH AFRICA DITHIOCARBAMATE MARKET, BY APPLICATION, 2022-2032 ($MILLION)
- TABLE 118. SOUTH AFRICA DITHIOCARBAMATE MARKET, BY APPLICATION, 2022-2032 (TONS)
- TABLE 119. REST OF LAMEA DITHIOCARBAMATE MARKET, BY CARBON CONTENT, 2022-2032 ($MILLION)
- TABLE 120. REST OF LAMEA DITHIOCARBAMATE MARKET, BY CARBON CONTENT, 2022-2032 (TONS)
- TABLE 121. REST OF LAMEA DITHIOCARBAMATE MARKET, BY APPLICATION, 2022-2032 ($MILLION)
- TABLE 122. REST OF LAMEA DITHIOCARBAMATE MARKET, BY APPLICATION, 2022-2032 (TONS)
- TABLE 123. AKZONOBEL: KEY EXECUTIVES
- TABLE 124. AKZONOBEL: COMPANY SNAPSHOT
- TABLE 125. AKZONOBEL: PRODUCT SEGMENTS
- TABLE 126. AKZONOBEL: SERVICE SEGMENTS
- TABLE 127. AKZONOBEL: PRODUCT PORTFOLIO
- TABLE 128. AKZONOBEL: KEY STRATERGIES
- TABLE 129. ARKEMA: KEY EXECUTIVES
- TABLE 130. ARKEMA: COMPANY SNAPSHOT
- TABLE 131. ARKEMA: PRODUCT SEGMENTS
- TABLE 132. ARKEMA: SERVICE SEGMENTS
- TABLE 133. ARKEMA: PRODUCT PORTFOLIO
- TABLE 134. ARKEMA: KEY STRATERGIES
- TABLE 135. LANXESS: KEY EXECUTIVES
- TABLE 136. LANXESS: COMPANY SNAPSHOT
- TABLE 137. LANXESS: PRODUCT SEGMENTS
- TABLE 138. LANXESS: SERVICE SEGMENTS
- TABLE 139. LANXESS: PRODUCT PORTFOLIO
- TABLE 140. LANXESS: KEY STRATERGIES
- TABLE 141. ALBEMARLE CORPORATION: KEY EXECUTIVES
- TABLE 142. ALBEMARLE CORPORATION: COMPANY SNAPSHOT
- TABLE 143. ALBEMARLE CORPORATION: PRODUCT SEGMENTS
- TABLE 144. ALBEMARLE CORPORATION: SERVICE SEGMENTS
- TABLE 145. ALBEMARLE CORPORATION: PRODUCT PORTFOLIO
- TABLE 146. ALBEMARLE CORPORATION: KEY STRATERGIES
- TABLE 147. TCI CHEMICALS: KEY EXECUTIVES
- TABLE 148. TCI CHEMICALS: COMPANY SNAPSHOT
- TABLE 149. TCI CHEMICALS: PRODUCT SEGMENTS
- TABLE 150. TCI CHEMICALS: SERVICE SEGMENTS
- TABLE 151. TCI CHEMICALS: PRODUCT PORTFOLIO
- TABLE 152. TCI CHEMICALS: KEY STRATERGIES
- TABLE 153. THERMO FISHER SCIENTIFIC: KEY EXECUTIVES
- TABLE 154. THERMO FISHER SCIENTIFIC: COMPANY SNAPSHOT
- TABLE 155. THERMO FISHER SCIENTIFIC: PRODUCT SEGMENTS
- TABLE 156. THERMO FISHER SCIENTIFIC: SERVICE SEGMENTS
- TABLE 157. THERMO FISHER SCIENTIFIC: PRODUCT PORTFOLIO
- TABLE 158. THERMO FISHER SCIENTIFIC: KEY STRATERGIES
- TABLE 159. MERCK: KEY EXECUTIVES
- TABLE 160. MERCK: COMPANY SNAPSHOT
- TABLE 161. MERCK: PRODUCT SEGMENTS
- TABLE 162. MERCK: SERVICE SEGMENTS
- TABLE 163. MERCK: PRODUCT PORTFOLIO
- TABLE 164. MERCK: KEY STRATERGIES
- TABLE 165. SIDDHARTH CHEMICALS: KEY EXECUTIVES
- TABLE 166. SIDDHARTH CHEMICALS: COMPANY SNAPSHOT
- TABLE 167. SIDDHARTH CHEMICALS: PRODUCT SEGMENTS
- TABLE 168. SIDDHARTH CHEMICALS: SERVICE SEGMENTS
- TABLE 169. SIDDHARTH CHEMICALS: PRODUCT PORTFOLIO
- TABLE 170. SIDDHARTH CHEMICALS: KEY STRATERGIES
- TABLE 171. NOURYON: KEY EXECUTIVES
- TABLE 172. NOURYON: COMPANY SNAPSHOT
- TABLE 173. NOURYON: PRODUCT SEGMENTS
- TABLE 174. NOURYON: SERVICE SEGMENTS
- TABLE 175. NOURYON: PRODUCT PORTFOLIO
- TABLE 176. NOURYON: KEY STRATERGIES
- TABLE 177. JINCHANGSHENG CHEMICAL TECHNOLOGY CO.,LTD: KEY EXECUTIVES
- TABLE 178. JINCHANGSHENG CHEMICAL TECHNOLOGY CO.,LTD: COMPANY SNAPSHOT
- TABLE 179. JINCHANGSHENG CHEMICAL TECHNOLOGY CO.,LTD: PRODUCT SEGMENTS
- TABLE 180. JINCHANGSHENG CHEMICAL TECHNOLOGY CO.,LTD: SERVICE SEGMENTS
- TABLE 181. JINCHANGSHENG CHEMICAL TECHNOLOGY CO.,LTD: PRODUCT PORTFOLIO
- TABLE 182. JINCHANGSHENG CHEMICAL TECHNOLOGY CO.,LTD: KEY STRATERGIES
LIST OF FIGURES
- FIGURE 01. DITHIOCARBAMATE MARKET, 2022-2032
- FIGURE 02. SEGMENTATION OF DITHIOCARBAMATE MARKET,2022-2032
- FIGURE 03. TOP IMPACTING FACTORS IN DITHIOCARBAMATE MARKET
- FIGURE 04. TOP INVESTMENT POCKETS IN DITHIOCARBAMATE MARKET (2023-2032)
- FIGURE 05. BARGAINING POWER OF SUPPLIERS
- FIGURE 06. BARGAINING POWER OF BUYERS
- FIGURE 07. THREAT OF SUBSTITUTION
- FIGURE 08. THREAT OF SUBSTITUTION
- FIGURE 09. COMPETITIVE RIVALRY
- FIGURE 10. GLOBAL DITHIOCARBAMATE MARKET:DRIVERS, RESTRAINTS AND OPPORTUNITIES
- FIGURE 11. PRICING ANALYSIS: DITHIOCARBAMATE MARKET 2022 AND 2032
- FIGURE 12. IMPACT OF KEY REGULATION: DITHIOCARBAMATE MARKET
- FIGURE 13. PATENT ANALYSIS BY COMPANY
- FIGURE 14. PATENT ANALYSIS BY COUNTRY
- FIGURE 15. DITHIOCARBAMATE MARKET, BY CARBON CONTENT, 2022 AND 2032(%)
- FIGURE 16. COMPARATIVE SHARE ANALYSIS OF DITHIOCARBAMATE MARKET FOR MANCOZEB, BY COUNTRY 2022 AND 2032(%)
- FIGURE 17. COMPARATIVE SHARE ANALYSIS OF DITHIOCARBAMATE MARKET FOR ZINEB, BY COUNTRY 2022 AND 2032(%)
- FIGURE 18. COMPARATIVE SHARE ANALYSIS OF DITHIOCARBAMATE MARKET FOR PROPINEB, BY COUNTRY 2022 AND 2032(%)
- FIGURE 19. COMPARATIVE SHARE ANALYSIS OF DITHIOCARBAMATE MARKET FOR OTHERS, BY COUNTRY 2022 AND 2032(%)
- FIGURE 20. DITHIOCARBAMATE MARKET, BY APPLICATION, 2022 AND 2032(%)
- FIGURE 21. COMPARATIVE SHARE ANALYSIS OF DITHIOCARBAMATE MARKET FOR FRUITS AND VEGETABLES, BY COUNTRY 2022 AND 2032(%)
- FIGURE 22. COMPARATIVE SHARE ANALYSIS OF DITHIOCARBAMATE MARKET FOR FLOWERS, BY COUNTRY 2022 AND 2032(%)
- FIGURE 23. COMPARATIVE SHARE ANALYSIS OF DITHIOCARBAMATE MARKET FOR CROPS, BY COUNTRY 2022 AND 2032(%)
- FIGURE 24. COMPARATIVE SHARE ANALYSIS OF DITHIOCARBAMATE MARKET FOR OTHERS, BY COUNTRY 2022 AND 2032(%)
- FIGURE 25. DITHIOCARBAMATE MARKET BY REGION, 2022 AND 2032(%)
- FIGURE 26. U.S. DITHIOCARBAMATE MARKET, 2022-2032 ($MILLION)
- FIGURE 27. CANADA DITHIOCARBAMATE MARKET, 2022-2032 ($MILLION)
- FIGURE 28. MEXICO DITHIOCARBAMATE MARKET, 2022-2032 ($MILLION)
- FIGURE 29. UK DITHIOCARBAMATE MARKET, 2022-2032 ($MILLION)
- FIGURE 30. RUSSIA DITHIOCARBAMATE MARKET, 2022-2032 ($MILLION)
- FIGURE 31. POLAND DITHIOCARBAMATE MARKET, 2022-2032 ($MILLION)
- FIGURE 32. NORWAY DITHIOCARBAMATE MARKET, 2022-2032 ($MILLION)
- FIGURE 33. SWITZERLAND DITHIOCARBAMATE MARKET, 2022-2032 ($MILLION)
- FIGURE 34. REST OF EUROPE DITHIOCARBAMATE MARKET, 2022-2032 ($MILLION)
- FIGURE 35. CHINA DITHIOCARBAMATE MARKET, 2022-2032 ($MILLION)
- FIGURE 36. INDIA DITHIOCARBAMATE MARKET, 2022-2032 ($MILLION)
- FIGURE 37. JAPAN DITHIOCARBAMATE MARKET, 2022-2032 ($MILLION)
- FIGURE 38. SOUTH KOREA DITHIOCARBAMATE MARKET, 2022-2032 ($MILLION)
- FIGURE 39. AUSTRALIA DITHIOCARBAMATE MARKET, 2022-2032 ($MILLION)
- FIGURE 40. REST OF ASIA-PACIFIC DITHIOCARBAMATE MARKET, 2022-2032 ($MILLION)
- FIGURE 41. BRAZIL DITHIOCARBAMATE MARKET, 2022-2032 ($MILLION)
- FIGURE 42. SAUDI ARABIA DITHIOCARBAMATE MARKET, 2022-2032 ($MILLION)
- FIGURE 43. SOUTH AFRICA DITHIOCARBAMATE MARKET, 2022-2032 ($MILLION)
- FIGURE 44. REST OF LAMEA DITHIOCARBAMATE MARKET, 2022-2032 ($MILLION)
- FIGURE 45. TOP WINNING STRATEGIES, BY YEAR
- FIGURE 46. TOP WINNING STRATEGIES, BY DEVELOPMENT
- FIGURE 47. TOP WINNING STRATEGIES, BY COMPANY
- FIGURE 48. PRODUCT MAPPING OF TOP 10 PLAYERS
- FIGURE 49. COMPETITIVE DASHBOARD
- FIGURE 50. COMPETITIVE HEATMAP: DITHIOCARBAMATE MARKET
- FIGURE 51. TOP PLAYER POSITIONING, 2022
 鋅礦開採市場報告:2030 年趨勢、預測與競爭分析
 全球二硫代氨基甲酸鹽市場規模研究,按應用(水果和蔬菜、花卉、農作物等)、碳含量(代森錳鋅、代森鋅、代森鋅等)和區域預測 2022-2032
 醋酸鋅市場,依形式、依應用、依國家和地區分類 - 2024-2032 年行業分析、市場規模、市場佔有率和預測
 鋅市場:2030 年趨勢、機會與競爭分析
 二烷基二硫代磷酸鋅添加劑市場 - 全球規模、佔有率、趨勢分析、機會、預測報告,2019-2030
 鋅片塗層市場:按類型、塗層類型、塗層技術、最終用途行業分類 - 2024-2030 年全球預測
 世界鋅礦開採市場(~2030 年)
 2024 年世界鋅市場報告
 2024 年檸檬酸鋅全球市場報告
 醋酸鋅全球市場規模、佔有率、趨勢分析報告:按型態、應用、地區、前景和預測,2023-2030年