


 |
市場調查報告書
商品編碼
1472401
焊料市場:按產品、製程和最終用途分類:2023-2032 年全球機會分析和產業預測Solder Materials Market By Product (Bar, Wire, Paste, Others), By Process (Wave/reflow, Screen printing, Robotic, Others), By End-use (Automotive, Consumer electronics, Others): Global Opportunity Analysis and Industry Forecast, 2023-2032 |
||||||
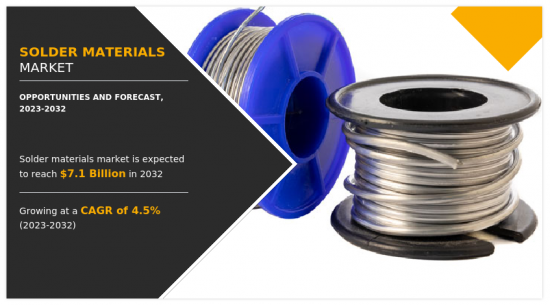
2022年全球焊接材料市場規模為46億美元,預估2023年至2032年複合年成長率為4.5%,至2032年達到71億美元。
焊料通常由各種金屬合金組成,並具有根據應用要求量身定做的特定熔點和特性。常見的焊料合金包括錫 (Sn)、鉛 (Pb)、銀 (Ag)、銅 (Cu)、鉍 (Bi) 和其他金屬的組合。焊接材料的選擇取決於要連接的金屬類型、操作條件和監管考慮等因素。除了焊料合金本身之外,焊接中也經常使用助焊劑。助焊劑是一種化合物,有助於清潔金屬表面、去除氧化物並促進焊料潤濕和流動。它有多種形式,包括液體、膏狀和內置焊錫絲芯。
焊接用於汽車製造和維修,以進行各種電氣連接,包括車輛系統內的線束、感測器和電路基板。焊接應用於各種金屬加工計劃,包括工藝品、雕塑、彩色玻璃組裝和模型製作。焊接對於可靠性和耐用性至關重要的航太和國防電子產品的製造也至關重要。它們具有廣泛的應用,從航空電子設備到飛彈導引系統。
IoT(物聯網)、5G、AI(人工智慧)、AR(擴增實境)等創新技術的出現,進一步增加了對電子裝置和組件的需求。這些技術通常涉及複雜的電子系統和小型化組件,需要特殊的焊接材料進行組裝。隨著電子產業的不斷發展和多元化,用於將電子元件組裝成印刷電路基板(PCB)、半導體封裝和其他電子元件組件的焊接材料的需求也在不斷成長。焊接是電子設備製造的基本工藝,焊接材料在確保電子設備的可靠性、性能和壽命方面發揮重要作用。因此,電子工業的擴張已成為焊錫材料市場的重要促進因素。
然而,焊料製造中使用的原料的全球供應鏈複雜且相互關聯。供應鏈中斷,例如供不應求、物流挑戰以及自然災害或地緣政治事件導致的生產中斷,會加劇價格波動並導致供應限制。
焊接材料市場按產品、工藝、最終用途行業和地區細分。產品分為棒材、線材、糊劑和助焊劑。依助焊劑分為波峰焊/回流焊接、網版印刷、機器人焊、雷射焊。依最終用途行業分為家電、汽車等。從地區來看,調查涵蓋北美、歐洲、亞太地區和拉丁美洲地區。
相關人員的主要利益
- 該報告提供了 2022 年至 2032 年焊料材料市場分析的細分市場、當前趨勢、估計/趨勢和動態的定量分析,並確定了焊料材料市場的強大機會。
- 我們提供市場研究以及與市場促進因素、市場限制和市場機會相關的資訊。
- 波特的五力分析強調買家和供應商幫助相關人員做出利潤驅動的商業決策並加強供應商-買家網路的力量。
- 焊料材料市場細分的詳細分析將有助於確定市場機會。
- 每個地區的主要國家都根據其對全球市場的收益貢獻繪製了地圖。
- 市場參與者定位有助於進行基準比較,並提供對市場參與者當前位置的清晰了解。
- 該報告包括對區域和全球焊接材料市場趨勢、主要企業、細分市場、應用領域和市場成長策略的分析。
可以使用此報告進行客製化(需要額外費用和時間表)
- 根據客戶興趣加入公司簡介
- 按國家或地區進行的附加分析 – 市場規模和預測
- SWOT分析
- 市場規模及預測
目錄
第1章簡介
第 2 章執行摘要
第3章市場概況
- 市場定義和範圍
- 主要發現
- 影響因素
- 主要投資機會
- 波特五力分析
- 市場動態
- 促進因素
- 抑制因素
- 機會
- 價值鏈分析
- 關鍵監管分析
- 專利情況
第4章焊料市場:依產品
- 概述
- 酒吧
- 金屬絲
- 貼上
- 其他
第5章焊料市場:依製程分類
- 概述
- 波峰焊/回流焊接
- 網版印刷
- 機器人
- 其他
第6章焊料市場:依最終用途
- 概述
- 車
- 家用電器
- 其他
第7章焊料市場:依地區
- 概述
- 北美洲
- 美國
- 加拿大
- 墨西哥
- 歐洲
- 德國
- 法國
- 義大利
- 英國
- 西班牙
- 其他
- 亞太地區
- 中國
- 印度
- 日本
- 韓國
- 澳洲
- 其他
- 拉丁美洲/中東/非洲
- 巴西
- 沙烏地阿拉伯
- 南非
- 其他
第8章 競爭格局
- 介紹
- 關鍵成功策略
- 10家主要企業產品圖譜
- 競爭對手儀表板
- 競爭熱圖
- 2022年主要企業定位
第9章 公司簡介
- Indium Corporation
- Alpha Assembly Solutions
- Kester
- Senju Metal Industry Co., Ltd
- AIM Solder, LLC
- Weller Tools GmbH
- Nihon Superior Co., Ltd.
- KMG Chemicals, Inc.
- Balver Zinn
- Qualitek International, Inc.
The global solder materials market size was valued at $4.6 billion in 2022, and is projected to reach $7.1 billion by 2032, growing at a CAGR of 4.5% from 2023 to 2032.
Solder materials typically consist of various metal alloys with specific melting points and properties tailored to the requirements of the application. Common solder alloys include combinations of tin (Sn), lead (Pb), silver (Ag), copper (Cu), bismuth (Bi), and other metals. The choice of solder material depends on factors such as the type of metals being joined, the operating conditions, and regulatory considerations. In addition to the solder alloy itself, flux is often used in soldering. Flux is a chemical compound that helps clean the metal surfaces, remove oxides, and promote the wetting and flow of the solder. It is available in different forms, such as liquid, paste, or incorporated within the core of solder wire.
Soldering is utilized in automotive manufacturing and repair for various electrical connections, such as wiring harnesses, sensors, and circuit boards within vehicle systems. Soldering finds applications in various metalworking projects, including crafts, sculptures, stained glass assembly, and model making. Soldering is also crucial in the manufacturing of aerospace and defense electronics, where reliability and durability are paramount. It is used in applications ranging from avionics to missile guidance systems.
The emergence of innovative technologies such as IoT (Internet of Things), 5G, AI (Artificial Intelligence), and augmented reality (AR) creates additional demand for electronic devices and components. These technologies often involve complex electronic systems and miniaturized components, necessitating specialized solder materials for their assembly. As the electronics industry continues to grow and diversify, the demand for solder materials used in assembling electronic components onto printed circuit boards (PCBs), semiconductor packages, and other electronic assemblies also increases. Soldering is a fundamental process in electronics manufacturing, and solder materials play a crucial role in ensuring the reliability, performance, and longevity of electronic devices. Therefore, the expansion of the electronics industry serves as a significant driver for the solder materials market.
However, the global supply chain for raw materials used in solder production is complex and interconnected. Disruptions in the supply chain, such as supply shortages, logistical challenges, or disruptions in production due to natural disasters or geopolitical events, exacerbate price volatility and lead to supply constraints.
The solder materials market is segmented on the basis of product, process, end-use industry, and region. By product, it is categorized into bar, wire, paste, and flux. By flux, it is classified into wave/reflow, screen printing, robotic, laser. By end-use industry, it is divided into consumer electronics, automotive, others. Region-wise, the market is studied across North America, Europe, Asia-Pacific, and LAMEA.
The major players operating in the global Solder Materials market are Indium Corporation, Alpha Assembly Solutions, Kester, Senju Metal Industry Co., Ltd., AIM Solder, Weller Tools GmbH, Nihon Superior Co., Ltd., MG Chemicals, Balver Zinn, Qualitek International, Inc.
Key Benefits For Stakeholders
- This report provides a quantitative analysis of the market segments, current trends, estimations, and dynamics of the solder materials market analysis from 2022 to 2032 to identify the prevailing solder materials market opportunities.
- The market research is offered along with information related to key drivers, restraints, and opportunities.
- Porter's five forces analysis highlights the potency of buyers and suppliers to enable stakeholders make profit-oriented business decisions and strengthen their supplier-buyer network.
- In-depth analysis of the solder materials market segmentation assists to determine the prevailing market opportunities.
- Major countries in each region are mapped according to their revenue contribution to the global market.
- Market player positioning facilitates benchmarking and provides a clear understanding of the present position of the market players.
- The report includes the analysis of the regional as well as global solder materials market trends, key players, market segments, application areas, and market growth strategies.
Additional benefits you will get with this purchase are:
- Quarterly Update and* (only available with a corporate license, on listed price)
- 5 additional Company Profile of client Choice pre- or Post-purchase, as a free update.
- Free Upcoming Version on the Purchase of Five and Enterprise User License.
- 16 analyst hours of support* (post-purchase, if you find additional data requirements upon review of the report, you may receive support amounting to 16 analyst hours to solve questions, and post-sale queries)
- 15% Free Customization* (in case the scope or segment of the report does not match your requirements, 15% is equivalent to 3 working days of free work, applicable once)
- Free data Pack on the Five and Enterprise User License. (Excel version of the report)
- Free Updated report if the report is 6-12 months old or older.
- 24-hour priority response*
- Free Industry updates and white papers.
Possible Customization with this report (with additional cost and timeline, please talk to the sales executive to know more)
- Additional company profiles with specific to client's interest
- Additional country or region analysis- market size and forecast
- SWOT Analysis
- Volume Market Size and Forecast
Key Market Segments
By Product
- Bar
- Wire
- Paste
- Others
By Process
- Wave/reflow
- Screen printing
- Robotic
- Others
By End-use
- Automotive
- Consumer electronics
- Others
By Region
- North America
- U.S.
- Canada
- Mexico
- Europe
- Germany
- France
- Italy
- UK
- Spain
- Rest of Europe
- Asia-Pacific
- China
- India
- Japan
- South Korea
- Australia
- Rest of Asia-Pacific
- LAMEA
- Brazil
- Saudi Arabia
- South Africa
- Rest of LAMEA
Key Market Players:
- Indium Corporation
- Alpha Assembly Solutions
- Kester
- Senju Metal Industry Co., Ltd
- AIM Solder, LLC
- Weller Tools GmbH
- Nihon Superior Co., Ltd.
- KMG Chemicals, Inc.
- Balver Zinn
- Qualitek International, Inc.
TABLE OF CONTENTS
CHAPTER 1: INTRODUCTION
- 1.1. Report description
- 1.2. Key market segments
- 1.3. Key benefits to the stakeholders
- 1.4. Research methodology
- 1.4.1. Primary research
- 1.4.2. Secondary research
- 1.4.3. Analyst tools and models
CHAPTER 2: EXECUTIVE SUMMARY
- 2.1. CXO perspective
CHAPTER 3: MARKET OVERVIEW
- 3.1. Market definition and scope
- 3.2. Key findings
- 3.2.1. Top impacting factors
- 3.2.2. Top investment pockets
- 3.3. Porter's five forces analysis
- 3.4. Market dynamics
- 3.4.1. Drivers
- 3.4.2. Restraints
- 3.4.3. Opportunities
- 3.5. Value Chain Analysis
- 3.6. Key Regulation Analysis
- 3.7. Patent Landscape
CHAPTER 4: SOLDER MATERIALS MARKET, BY PRODUCT
- 4.1. Overview
- 4.1.1. Market size and forecast
- 4.2. Bar
- 4.2.1. Key market trends, growth factors and opportunities
- 4.2.2. Market size and forecast, by region
- 4.2.3. Market share analysis by country
- 4.3. Wire
- 4.3.1. Key market trends, growth factors and opportunities
- 4.3.2. Market size and forecast, by region
- 4.3.3. Market share analysis by country
- 4.4. Paste
- 4.4.1. Key market trends, growth factors and opportunities
- 4.4.2. Market size and forecast, by region
- 4.4.3. Market share analysis by country
- 4.5. Others
- 4.5.1. Key market trends, growth factors and opportunities
- 4.5.2. Market size and forecast, by region
- 4.5.3. Market share analysis by country
CHAPTER 5: SOLDER MATERIALS MARKET, BY PROCESS
- 5.1. Overview
- 5.1.1. Market size and forecast
- 5.2. Wave/reflow
- 5.2.1. Key market trends, growth factors and opportunities
- 5.2.2. Market size and forecast, by region
- 5.2.3. Market share analysis by country
- 5.3. Screen printing
- 5.3.1. Key market trends, growth factors and opportunities
- 5.3.2. Market size and forecast, by region
- 5.3.3. Market share analysis by country
- 5.4. Robotic
- 5.4.1. Key market trends, growth factors and opportunities
- 5.4.2. Market size and forecast, by region
- 5.4.3. Market share analysis by country
- 5.5. Others
- 5.5.1. Key market trends, growth factors and opportunities
- 5.5.2. Market size and forecast, by region
- 5.5.3. Market share analysis by country
CHAPTER 6: SOLDER MATERIALS MARKET, BY END-USE
- 6.1. Overview
- 6.1.1. Market size and forecast
- 6.2. Automotive
- 6.2.1. Key market trends, growth factors and opportunities
- 6.2.2. Market size and forecast, by region
- 6.2.3. Market share analysis by country
- 6.3. Consumer electronics
- 6.3.1. Key market trends, growth factors and opportunities
- 6.3.2. Market size and forecast, by region
- 6.3.3. Market share analysis by country
- 6.4. Others
- 6.4.1. Key market trends, growth factors and opportunities
- 6.4.2. Market size and forecast, by region
- 6.4.3. Market share analysis by country
CHAPTER 7: SOLDER MATERIALS MARKET, BY REGION
- 7.1. Overview
- 7.1.1. Market size and forecast By Region
- 7.2. North America
- 7.2.1. Key market trends, growth factors and opportunities
- 7.2.2. Market size and forecast, by Product
- 7.2.3. Market size and forecast, by Process
- 7.2.4. Market size and forecast, by End-use
- 7.2.5. Market size and forecast, by country
- 7.2.5.1. U.S.
- 7.2.5.1.1. Market size and forecast, by Product
- 7.2.5.1.2. Market size and forecast, by Process
- 7.2.5.1.3. Market size and forecast, by End-use
- 7.2.5.2. Canada
- 7.2.5.2.1. Market size and forecast, by Product
- 7.2.5.2.2. Market size and forecast, by Process
- 7.2.5.2.3. Market size and forecast, by End-use
- 7.2.5.3. Mexico
- 7.2.5.3.1. Market size and forecast, by Product
- 7.2.5.3.2. Market size and forecast, by Process
- 7.2.5.3.3. Market size and forecast, by End-use
- 7.3. Europe
- 7.3.1. Key market trends, growth factors and opportunities
- 7.3.2. Market size and forecast, by Product
- 7.3.3. Market size and forecast, by Process
- 7.3.4. Market size and forecast, by End-use
- 7.3.5. Market size and forecast, by country
- 7.3.5.1. Germany
- 7.3.5.1.1. Market size and forecast, by Product
- 7.3.5.1.2. Market size and forecast, by Process
- 7.3.5.1.3. Market size and forecast, by End-use
- 7.3.5.2. France
- 7.3.5.2.1. Market size and forecast, by Product
- 7.3.5.2.2. Market size and forecast, by Process
- 7.3.5.2.3. Market size and forecast, by End-use
- 7.3.5.3. Italy
- 7.3.5.3.1. Market size and forecast, by Product
- 7.3.5.3.2. Market size and forecast, by Process
- 7.3.5.3.3. Market size and forecast, by End-use
- 7.3.5.4. UK
- 7.3.5.4.1. Market size and forecast, by Product
- 7.3.5.4.2. Market size and forecast, by Process
- 7.3.5.4.3. Market size and forecast, by End-use
- 7.3.5.5. Spain
- 7.3.5.5.1. Market size and forecast, by Product
- 7.3.5.5.2. Market size and forecast, by Process
- 7.3.5.5.3. Market size and forecast, by End-use
- 7.3.5.6. Rest of Europe
- 7.3.5.6.1. Market size and forecast, by Product
- 7.3.5.6.2. Market size and forecast, by Process
- 7.3.5.6.3. Market size and forecast, by End-use
- 7.4. Asia-Pacific
- 7.4.1. Key market trends, growth factors and opportunities
- 7.4.2. Market size and forecast, by Product
- 7.4.3. Market size and forecast, by Process
- 7.4.4. Market size and forecast, by End-use
- 7.4.5. Market size and forecast, by country
- 7.4.5.1. China
- 7.4.5.1.1. Market size and forecast, by Product
- 7.4.5.1.2. Market size and forecast, by Process
- 7.4.5.1.3. Market size and forecast, by End-use
- 7.4.5.2. India
- 7.4.5.2.1. Market size and forecast, by Product
- 7.4.5.2.2. Market size and forecast, by Process
- 7.4.5.2.3. Market size and forecast, by End-use
- 7.4.5.3. Japan
- 7.4.5.3.1. Market size and forecast, by Product
- 7.4.5.3.2. Market size and forecast, by Process
- 7.4.5.3.3. Market size and forecast, by End-use
- 7.4.5.4. South Korea
- 7.4.5.4.1. Market size and forecast, by Product
- 7.4.5.4.2. Market size and forecast, by Process
- 7.4.5.4.3. Market size and forecast, by End-use
- 7.4.5.5. Australia
- 7.4.5.5.1. Market size and forecast, by Product
- 7.4.5.5.2. Market size and forecast, by Process
- 7.4.5.5.3. Market size and forecast, by End-use
- 7.4.5.6. Rest of Asia-Pacific
- 7.4.5.6.1. Market size and forecast, by Product
- 7.4.5.6.2. Market size and forecast, by Process
- 7.4.5.6.3. Market size and forecast, by End-use
- 7.5. LAMEA
- 7.5.1. Key market trends, growth factors and opportunities
- 7.5.2. Market size and forecast, by Product
- 7.5.3. Market size and forecast, by Process
- 7.5.4. Market size and forecast, by End-use
- 7.5.5. Market size and forecast, by country
- 7.5.5.1. Brazil
- 7.5.5.1.1. Market size and forecast, by Product
- 7.5.5.1.2. Market size and forecast, by Process
- 7.5.5.1.3. Market size and forecast, by End-use
- 7.5.5.2. Saudi Arabia
- 7.5.5.2.1. Market size and forecast, by Product
- 7.5.5.2.2. Market size and forecast, by Process
- 7.5.5.2.3. Market size and forecast, by End-use
- 7.5.5.3. South Africa
- 7.5.5.3.1. Market size and forecast, by Product
- 7.5.5.3.2. Market size and forecast, by Process
- 7.5.5.3.3. Market size and forecast, by End-use
- 7.5.5.4. Rest of LAMEA
- 7.5.5.4.1. Market size and forecast, by Product
- 7.5.5.4.2. Market size and forecast, by Process
- 7.5.5.4.3. Market size and forecast, by End-use
CHAPTER 8: COMPETITIVE LANDSCAPE
- 8.1. Introduction
- 8.2. Top winning strategies
- 8.3. Product mapping of top 10 player
- 8.4. Competitive dashboard
- 8.5. Competitive heatmap
- 8.6. Top player positioning, 2022
CHAPTER 9: COMPANY PROFILES
- 9.1. Indium Corporation
- 9.1.1. Company overview
- 9.1.2. Key executives
- 9.1.3. Company snapshot
- 9.1.4. Operating business segments
- 9.1.5. Product portfolio
- 9.1.6. Business performance
- 9.1.7. Key strategic moves and developments
- 9.2. Alpha Assembly Solutions
- 9.2.1. Company overview
- 9.2.2. Key executives
- 9.2.3. Company snapshot
- 9.2.4. Operating business segments
- 9.2.5. Product portfolio
- 9.2.6. Business performance
- 9.2.7. Key strategic moves and developments
- 9.3. Kester
- 9.3.1. Company overview
- 9.3.2. Key executives
- 9.3.3. Company snapshot
- 9.3.4. Operating business segments
- 9.3.5. Product portfolio
- 9.3.6. Business performance
- 9.3.7. Key strategic moves and developments
- 9.4. Senju Metal Industry Co., Ltd
- 9.4.1. Company overview
- 9.4.2. Key executives
- 9.4.3. Company snapshot
- 9.4.4. Operating business segments
- 9.4.5. Product portfolio
- 9.4.6. Business performance
- 9.4.7. Key strategic moves and developments
- 9.5. AIM Solder, LLC
- 9.5.1. Company overview
- 9.5.2. Key executives
- 9.5.3. Company snapshot
- 9.5.4. Operating business segments
- 9.5.5. Product portfolio
- 9.5.6. Business performance
- 9.5.7. Key strategic moves and developments
- 9.6. Weller Tools GmbH
- 9.6.1. Company overview
- 9.6.2. Key executives
- 9.6.3. Company snapshot
- 9.6.4. Operating business segments
- 9.6.5. Product portfolio
- 9.6.6. Business performance
- 9.6.7. Key strategic moves and developments
- 9.7. Nihon Superior Co., Ltd.
- 9.7.1. Company overview
- 9.7.2. Key executives
- 9.7.3. Company snapshot
- 9.7.4. Operating business segments
- 9.7.5. Product portfolio
- 9.7.6. Business performance
- 9.7.7. Key strategic moves and developments
- 9.8. KMG Chemicals, Inc.
- 9.8.1. Company overview
- 9.8.2. Key executives
- 9.8.3. Company snapshot
- 9.8.4. Operating business segments
- 9.8.5. Product portfolio
- 9.8.6. Business performance
- 9.8.7. Key strategic moves and developments
- 9.9. Balver Zinn
- 9.9.1. Company overview
- 9.9.2. Key executives
- 9.9.3. Company snapshot
- 9.9.4. Operating business segments
- 9.9.5. Product portfolio
- 9.9.6. Business performance
- 9.9.7. Key strategic moves and developments
- 9.10. Qualitek International, Inc.
- 9.10.1. Company overview
- 9.10.2. Key executives
- 9.10.3. Company snapshot
- 9.10.4. Operating business segments
- 9.10.5. Product portfolio
- 9.10.6. Business performance
- 9.10.7. Key strategic moves and developments
LIST OF TABLES
- TABLE 01. GLOBAL SOLDER MATERIALS MARKET, BY PRODUCT, 2022-2032 ($MILLION)
- TABLE 02. SOLDER MATERIALS MARKET FOR BAR, BY REGION, 2022-2032 ($MILLION)
- TABLE 03. SOLDER MATERIALS MARKET FOR WIRE, BY REGION, 2022-2032 ($MILLION)
- TABLE 04. SOLDER MATERIALS MARKET FOR PASTE, BY REGION, 2022-2032 ($MILLION)
- TABLE 05. SOLDER MATERIALS MARKET FOR OTHERS, BY REGION, 2022-2032 ($MILLION)
- TABLE 06. GLOBAL SOLDER MATERIALS MARKET, BY PROCESS, 2022-2032 ($MILLION)
- TABLE 07. SOLDER MATERIALS MARKET FOR WAVE/REFLOW, BY REGION, 2022-2032 ($MILLION)
- TABLE 08. SOLDER MATERIALS MARKET FOR SCREEN PRINTING, BY REGION, 2022-2032 ($MILLION)
- TABLE 09. SOLDER MATERIALS MARKET FOR ROBOTIC, BY REGION, 2022-2032 ($MILLION)
- TABLE 10. SOLDER MATERIALS MARKET FOR OTHERS, BY REGION, 2022-2032 ($MILLION)
- TABLE 11. GLOBAL SOLDER MATERIALS MARKET, BY END-USE, 2022-2032 ($MILLION)
- TABLE 12. SOLDER MATERIALS MARKET FOR AUTOMOTIVE, BY REGION, 2022-2032 ($MILLION)
- TABLE 13. SOLDER MATERIALS MARKET FOR CONSUMER ELECTRONICS, BY REGION, 2022-2032 ($MILLION)
- TABLE 14. SOLDER MATERIALS MARKET FOR OTHERS, BY REGION, 2022-2032 ($MILLION)
- TABLE 15. SOLDER MATERIALS MARKET, BY REGION, 2022-2032 ($MILLION)
- TABLE 16. NORTH AMERICA SOLDER MATERIALS MARKET, BY PRODUCT, 2022-2032 ($MILLION)
- TABLE 17. NORTH AMERICA SOLDER MATERIALS MARKET, BY PROCESS, 2022-2032 ($MILLION)
- TABLE 18. NORTH AMERICA SOLDER MATERIALS MARKET, BY END-USE, 2022-2032 ($MILLION)
- TABLE 19. NORTH AMERICA SOLDER MATERIALS MARKET, BY COUNTRY, 2022-2032 ($MILLION)
- TABLE 20. U.S. SOLDER MATERIALS MARKET, BY PRODUCT, 2022-2032 ($MILLION)
- TABLE 21. U.S. SOLDER MATERIALS MARKET, BY PROCESS, 2022-2032 ($MILLION)
- TABLE 22. U.S. SOLDER MATERIALS MARKET, BY END-USE, 2022-2032 ($MILLION)
- TABLE 23. CANADA SOLDER MATERIALS MARKET, BY PRODUCT, 2022-2032 ($MILLION)
- TABLE 24. CANADA SOLDER MATERIALS MARKET, BY PROCESS, 2022-2032 ($MILLION)
- TABLE 25. CANADA SOLDER MATERIALS MARKET, BY END-USE, 2022-2032 ($MILLION)
- TABLE 26. MEXICO SOLDER MATERIALS MARKET, BY PRODUCT, 2022-2032 ($MILLION)
- TABLE 27. MEXICO SOLDER MATERIALS MARKET, BY PROCESS, 2022-2032 ($MILLION)
- TABLE 28. MEXICO SOLDER MATERIALS MARKET, BY END-USE, 2022-2032 ($MILLION)
- TABLE 29. EUROPE SOLDER MATERIALS MARKET, BY PRODUCT, 2022-2032 ($MILLION)
- TABLE 30. EUROPE SOLDER MATERIALS MARKET, BY PROCESS, 2022-2032 ($MILLION)
- TABLE 31. EUROPE SOLDER MATERIALS MARKET, BY END-USE, 2022-2032 ($MILLION)
- TABLE 32. EUROPE SOLDER MATERIALS MARKET, BY COUNTRY, 2022-2032 ($MILLION)
- TABLE 33. GERMANY SOLDER MATERIALS MARKET, BY PRODUCT, 2022-2032 ($MILLION)
- TABLE 34. GERMANY SOLDER MATERIALS MARKET, BY PROCESS, 2022-2032 ($MILLION)
- TABLE 35. GERMANY SOLDER MATERIALS MARKET, BY END-USE, 2022-2032 ($MILLION)
- TABLE 36. FRANCE SOLDER MATERIALS MARKET, BY PRODUCT, 2022-2032 ($MILLION)
- TABLE 37. FRANCE SOLDER MATERIALS MARKET, BY PROCESS, 2022-2032 ($MILLION)
- TABLE 38. FRANCE SOLDER MATERIALS MARKET, BY END-USE, 2022-2032 ($MILLION)
- TABLE 39. ITALY SOLDER MATERIALS MARKET, BY PRODUCT, 2022-2032 ($MILLION)
- TABLE 40. ITALY SOLDER MATERIALS MARKET, BY PROCESS, 2022-2032 ($MILLION)
- TABLE 41. ITALY SOLDER MATERIALS MARKET, BY END-USE, 2022-2032 ($MILLION)
- TABLE 42. UK SOLDER MATERIALS MARKET, BY PRODUCT, 2022-2032 ($MILLION)
- TABLE 43. UK SOLDER MATERIALS MARKET, BY PROCESS, 2022-2032 ($MILLION)
- TABLE 44. UK SOLDER MATERIALS MARKET, BY END-USE, 2022-2032 ($MILLION)
- TABLE 45. SPAIN SOLDER MATERIALS MARKET, BY PRODUCT, 2022-2032 ($MILLION)
- TABLE 46. SPAIN SOLDER MATERIALS MARKET, BY PROCESS, 2022-2032 ($MILLION)
- TABLE 47. SPAIN SOLDER MATERIALS MARKET, BY END-USE, 2022-2032 ($MILLION)
- TABLE 48. REST OF EUROPE SOLDER MATERIALS MARKET, BY PRODUCT, 2022-2032 ($MILLION)
- TABLE 49. REST OF EUROPE SOLDER MATERIALS MARKET, BY PROCESS, 2022-2032 ($MILLION)
- TABLE 50. REST OF EUROPE SOLDER MATERIALS MARKET, BY END-USE, 2022-2032 ($MILLION)
- TABLE 51. ASIA-PACIFIC SOLDER MATERIALS MARKET, BY PRODUCT, 2022-2032 ($MILLION)
- TABLE 52. ASIA-PACIFIC SOLDER MATERIALS MARKET, BY PROCESS, 2022-2032 ($MILLION)
- TABLE 53. ASIA-PACIFIC SOLDER MATERIALS MARKET, BY END-USE, 2022-2032 ($MILLION)
- TABLE 54. ASIA-PACIFIC SOLDER MATERIALS MARKET, BY COUNTRY, 2022-2032 ($MILLION)
- TABLE 55. CHINA SOLDER MATERIALS MARKET, BY PRODUCT, 2022-2032 ($MILLION)
- TABLE 56. CHINA SOLDER MATERIALS MARKET, BY PROCESS, 2022-2032 ($MILLION)
- TABLE 57. CHINA SOLDER MATERIALS MARKET, BY END-USE, 2022-2032 ($MILLION)
- TABLE 58. INDIA SOLDER MATERIALS MARKET, BY PRODUCT, 2022-2032 ($MILLION)
- TABLE 59. INDIA SOLDER MATERIALS MARKET, BY PROCESS, 2022-2032 ($MILLION)
- TABLE 60. INDIA SOLDER MATERIALS MARKET, BY END-USE, 2022-2032 ($MILLION)
- TABLE 61. JAPAN SOLDER MATERIALS MARKET, BY PRODUCT, 2022-2032 ($MILLION)
- TABLE 62. JAPAN SOLDER MATERIALS MARKET, BY PROCESS, 2022-2032 ($MILLION)
- TABLE 63. JAPAN SOLDER MATERIALS MARKET, BY END-USE, 2022-2032 ($MILLION)
- TABLE 64. SOUTH KOREA SOLDER MATERIALS MARKET, BY PRODUCT, 2022-2032 ($MILLION)
- TABLE 65. SOUTH KOREA SOLDER MATERIALS MARKET, BY PROCESS, 2022-2032 ($MILLION)
- TABLE 66. SOUTH KOREA SOLDER MATERIALS MARKET, BY END-USE, 2022-2032 ($MILLION)
- TABLE 67. AUSTRALIA SOLDER MATERIALS MARKET, BY PRODUCT, 2022-2032 ($MILLION)
- TABLE 68. AUSTRALIA SOLDER MATERIALS MARKET, BY PROCESS, 2022-2032 ($MILLION)
- TABLE 69. AUSTRALIA SOLDER MATERIALS MARKET, BY END-USE, 2022-2032 ($MILLION)
- TABLE 70. REST OF ASIA-PACIFIC SOLDER MATERIALS MARKET, BY PRODUCT, 2022-2032 ($MILLION)
- TABLE 71. REST OF ASIA-PACIFIC SOLDER MATERIALS MARKET, BY PROCESS, 2022-2032 ($MILLION)
- TABLE 72. REST OF ASIA-PACIFIC SOLDER MATERIALS MARKET, BY END-USE, 2022-2032 ($MILLION)
- TABLE 73. LAMEA SOLDER MATERIALS MARKET, BY PRODUCT, 2022-2032 ($MILLION)
- TABLE 74. LAMEA SOLDER MATERIALS MARKET, BY PROCESS, 2022-2032 ($MILLION)
- TABLE 75. LAMEA SOLDER MATERIALS MARKET, BY END-USE, 2022-2032 ($MILLION)
- TABLE 76. LAMEA SOLDER MATERIALS MARKET, BY COUNTRY, 2022-2032 ($MILLION)
- TABLE 77. BRAZIL SOLDER MATERIALS MARKET, BY PRODUCT, 2022-2032 ($MILLION)
- TABLE 78. BRAZIL SOLDER MATERIALS MARKET, BY PROCESS, 2022-2032 ($MILLION)
- TABLE 79. BRAZIL SOLDER MATERIALS MARKET, BY END-USE, 2022-2032 ($MILLION)
- TABLE 80. SAUDI ARABIA SOLDER MATERIALS MARKET, BY PRODUCT, 2022-2032 ($MILLION)
- TABLE 81. SAUDI ARABIA SOLDER MATERIALS MARKET, BY PROCESS, 2022-2032 ($MILLION)
- TABLE 82. SAUDI ARABIA SOLDER MATERIALS MARKET, BY END-USE, 2022-2032 ($MILLION)
- TABLE 83. SOUTH AFRICA SOLDER MATERIALS MARKET, BY PRODUCT, 2022-2032 ($MILLION)
- TABLE 84. SOUTH AFRICA SOLDER MATERIALS MARKET, BY PROCESS, 2022-2032 ($MILLION)
- TABLE 85. SOUTH AFRICA SOLDER MATERIALS MARKET, BY END-USE, 2022-2032 ($MILLION)
- TABLE 86. REST OF LAMEA SOLDER MATERIALS MARKET, BY PRODUCT, 2022-2032 ($MILLION)
- TABLE 87. REST OF LAMEA SOLDER MATERIALS MARKET, BY PROCESS, 2022-2032 ($MILLION)
- TABLE 88. REST OF LAMEA SOLDER MATERIALS MARKET, BY END-USE, 2022-2032 ($MILLION)
- TABLE 89. INDIUM CORPORATION: KEY EXECUTIVES
- TABLE 90. INDIUM CORPORATION: COMPANY SNAPSHOT
- TABLE 91. INDIUM CORPORATION: PRODUCT SEGMENTS
- TABLE 92. INDIUM CORPORATION: SERVICE SEGMENTS
- TABLE 93. INDIUM CORPORATION: PRODUCT PORTFOLIO
- TABLE 94. INDIUM CORPORATION: KEY STRATERGIES
- TABLE 95. ALPHA ASSEMBLY SOLUTIONS: KEY EXECUTIVES
- TABLE 96. ALPHA ASSEMBLY SOLUTIONS: COMPANY SNAPSHOT
- TABLE 97. ALPHA ASSEMBLY SOLUTIONS: PRODUCT SEGMENTS
- TABLE 98. ALPHA ASSEMBLY SOLUTIONS: SERVICE SEGMENTS
- TABLE 99. ALPHA ASSEMBLY SOLUTIONS: PRODUCT PORTFOLIO
- TABLE 100. ALPHA ASSEMBLY SOLUTIONS: KEY STRATERGIES
- TABLE 101. KESTER: KEY EXECUTIVES
- TABLE 102. KESTER: COMPANY SNAPSHOT
- TABLE 103. KESTER: PRODUCT SEGMENTS
- TABLE 104. KESTER: SERVICE SEGMENTS
- TABLE 105. KESTER: PRODUCT PORTFOLIO
- TABLE 106. KESTER: KEY STRATERGIES
- TABLE 107. SENJU METAL INDUSTRY CO., LTD: KEY EXECUTIVES
- TABLE 108. SENJU METAL INDUSTRY CO., LTD: COMPANY SNAPSHOT
- TABLE 109. SENJU METAL INDUSTRY CO., LTD: PRODUCT SEGMENTS
- TABLE 110. SENJU METAL INDUSTRY CO., LTD: SERVICE SEGMENTS
- TABLE 111. SENJU METAL INDUSTRY CO., LTD: PRODUCT PORTFOLIO
- TABLE 112. SENJU METAL INDUSTRY CO., LTD: KEY STRATERGIES
- TABLE 113. AIM SOLDER, LLC: KEY EXECUTIVES
- TABLE 114. AIM SOLDER, LLC: COMPANY SNAPSHOT
- TABLE 115. AIM SOLDER, LLC: PRODUCT SEGMENTS
- TABLE 116. AIM SOLDER, LLC: SERVICE SEGMENTS
- TABLE 117. AIM SOLDER, LLC: PRODUCT PORTFOLIO
- TABLE 118. AIM SOLDER, LLC: KEY STRATERGIES
- TABLE 119. WELLER TOOLS GMBH: KEY EXECUTIVES
- TABLE 120. WELLER TOOLS GMBH: COMPANY SNAPSHOT
- TABLE 121. WELLER TOOLS GMBH: PRODUCT SEGMENTS
- TABLE 122. WELLER TOOLS GMBH: SERVICE SEGMENTS
- TABLE 123. WELLER TOOLS GMBH: PRODUCT PORTFOLIO
- TABLE 124. WELLER TOOLS GMBH: KEY STRATERGIES
- TABLE 125. NIHON SUPERIOR CO., LTD.: KEY EXECUTIVES
- TABLE 126. NIHON SUPERIOR CO., LTD.: COMPANY SNAPSHOT
- TABLE 127. NIHON SUPERIOR CO., LTD.: PRODUCT SEGMENTS
- TABLE 128. NIHON SUPERIOR CO., LTD.: SERVICE SEGMENTS
- TABLE 129. NIHON SUPERIOR CO., LTD.: PRODUCT PORTFOLIO
- TABLE 130. NIHON SUPERIOR CO., LTD.: KEY STRATERGIES
- TABLE 131. KMG CHEMICALS, INC.: KEY EXECUTIVES
- TABLE 132. KMG CHEMICALS, INC.: COMPANY SNAPSHOT
- TABLE 133. KMG CHEMICALS, INC.: PRODUCT SEGMENTS
- TABLE 134. KMG CHEMICALS, INC.: SERVICE SEGMENTS
- TABLE 135. KMG CHEMICALS, INC.: PRODUCT PORTFOLIO
- TABLE 136. KMG CHEMICALS, INC.: KEY STRATERGIES
- TABLE 137. BALVER ZINN: KEY EXECUTIVES
- TABLE 138. BALVER ZINN: COMPANY SNAPSHOT
- TABLE 139. BALVER ZINN: PRODUCT SEGMENTS
- TABLE 140. BALVER ZINN: SERVICE SEGMENTS
- TABLE 141. BALVER ZINN: PRODUCT PORTFOLIO
- TABLE 142. BALVER ZINN: KEY STRATERGIES
- TABLE 143. QUALITEK INTERNATIONAL, INC.: KEY EXECUTIVES
- TABLE 144. QUALITEK INTERNATIONAL, INC.: COMPANY SNAPSHOT
- TABLE 145. QUALITEK INTERNATIONAL, INC.: PRODUCT SEGMENTS
- TABLE 146. QUALITEK INTERNATIONAL, INC.: SERVICE SEGMENTS
- TABLE 147. QUALITEK INTERNATIONAL, INC.: PRODUCT PORTFOLIO
- TABLE 148. QUALITEK INTERNATIONAL, INC.: KEY STRATERGIES
LIST OF FIGURES
- FIGURE 01. SOLDER MATERIALS MARKET, 2022-2032
- FIGURE 02. SEGMENTATION OF SOLDER MATERIALS MARKET,2022-2032
- FIGURE 03. TOP IMPACTING FACTORS IN SOLDER MATERIALS MARKET
- FIGURE 04. TOP INVESTMENT POCKETS IN SOLDER MATERIALS MARKET (2023-2032)
- FIGURE 05. BARGAINING POWER OF SUPPLIERS
- FIGURE 06. BARGAINING POWER OF BUYERS
- FIGURE 07. THREAT OF SUBSTITUTION
- FIGURE 08. THREAT OF SUBSTITUTION
- FIGURE 09. COMPETITIVE RIVALRY
- FIGURE 10. GLOBAL SOLDER MATERIALS MARKET:DRIVERS, RESTRAINTS AND OPPORTUNITIES
- FIGURE 11. IMPACT OF KEY REGULATION: SOLDER MATERIALS MARKET
- FIGURE 12. PATENT ANALYSIS BY COMPANY
- FIGURE 13. PATENT ANALYSIS BY COUNTRY
- FIGURE 14. SOLDER MATERIALS MARKET, BY PRODUCT, 2022 AND 2032(%)
- FIGURE 15. COMPARATIVE SHARE ANALYSIS OF SOLDER MATERIALS MARKET FOR BAR, BY COUNTRY 2022 AND 2032(%)
- FIGURE 16. COMPARATIVE SHARE ANALYSIS OF SOLDER MATERIALS MARKET FOR WIRE, BY COUNTRY 2022 AND 2032(%)
- FIGURE 17. COMPARATIVE SHARE ANALYSIS OF SOLDER MATERIALS MARKET FOR PASTE, BY COUNTRY 2022 AND 2032(%)
- FIGURE 18. COMPARATIVE SHARE ANALYSIS OF SOLDER MATERIALS MARKET FOR OTHERS, BY COUNTRY 2022 AND 2032(%)
- FIGURE 19. SOLDER MATERIALS MARKET, BY PROCESS, 2022 AND 2032(%)
- FIGURE 20. COMPARATIVE SHARE ANALYSIS OF SOLDER MATERIALS MARKET FOR WAVE/REFLOW, BY COUNTRY 2022 AND 2032(%)
- FIGURE 21. COMPARATIVE SHARE ANALYSIS OF SOLDER MATERIALS MARKET FOR SCREEN PRINTING, BY COUNTRY 2022 AND 2032(%)
- FIGURE 22. COMPARATIVE SHARE ANALYSIS OF SOLDER MATERIALS MARKET FOR ROBOTIC, BY COUNTRY 2022 AND 2032(%)
- FIGURE 23. COMPARATIVE SHARE ANALYSIS OF SOLDER MATERIALS MARKET FOR OTHERS, BY COUNTRY 2022 AND 2032(%)
- FIGURE 24. SOLDER MATERIALS MARKET, BY END-USE, 2022 AND 2032(%)
- FIGURE 25. COMPARATIVE SHARE ANALYSIS OF SOLDER MATERIALS MARKET FOR AUTOMOTIVE, BY COUNTRY 2022 AND 2032(%)
- FIGURE 26. COMPARATIVE SHARE ANALYSIS OF SOLDER MATERIALS MARKET FOR CONSUMER ELECTRONICS, BY COUNTRY 2022 AND 2032(%)
- FIGURE 27. COMPARATIVE SHARE ANALYSIS OF SOLDER MATERIALS MARKET FOR OTHERS, BY COUNTRY 2022 AND 2032(%)
- FIGURE 28. SOLDER MATERIALS MARKET BY REGION, 2022 AND 2032(%)
- FIGURE 29. U.S. SOLDER MATERIALS MARKET, 2022-2032 ($MILLION)
- FIGURE 30. CANADA SOLDER MATERIALS MARKET, 2022-2032 ($MILLION)
- FIGURE 31. MEXICO SOLDER MATERIALS MARKET, 2022-2032 ($MILLION)
- FIGURE 32. GERMANY SOLDER MATERIALS MARKET, 2022-2032 ($MILLION)
- FIGURE 33. FRANCE SOLDER MATERIALS MARKET, 2022-2032 ($MILLION)
- FIGURE 34. ITALY SOLDER MATERIALS MARKET, 2022-2032 ($MILLION)
- FIGURE 35. UK SOLDER MATERIALS MARKET, 2022-2032 ($MILLION)
- FIGURE 36. SPAIN SOLDER MATERIALS MARKET, 2022-2032 ($MILLION)
- FIGURE 37. REST OF EUROPE SOLDER MATERIALS MARKET, 2022-2032 ($MILLION)
- FIGURE 38. CHINA SOLDER MATERIALS MARKET, 2022-2032 ($MILLION)
- FIGURE 39. INDIA SOLDER MATERIALS MARKET, 2022-2032 ($MILLION)
- FIGURE 40. JAPAN SOLDER MATERIALS MARKET, 2022-2032 ($MILLION)
- FIGURE 41. SOUTH KOREA SOLDER MATERIALS MARKET, 2022-2032 ($MILLION)
- FIGURE 42. AUSTRALIA SOLDER MATERIALS MARKET, 2022-2032 ($MILLION)
- FIGURE 43. REST OF ASIA-PACIFIC SOLDER MATERIALS MARKET, 2022-2032 ($MILLION)
- FIGURE 44. BRAZIL SOLDER MATERIALS MARKET, 2022-2032 ($MILLION)
- FIGURE 45. SAUDI ARABIA SOLDER MATERIALS MARKET, 2022-2032 ($MILLION)
- FIGURE 46. SOUTH AFRICA SOLDER MATERIALS MARKET, 2022-2032 ($MILLION)
- FIGURE 47. REST OF LAMEA SOLDER MATERIALS MARKET, 2022-2032 ($MILLION)
- FIGURE 48. TOP WINNING STRATEGIES, BY YEAR
- FIGURE 49. TOP WINNING STRATEGIES, BY DEVELOPMENT
- FIGURE 50. TOP WINNING STRATEGIES, BY COMPANY
- FIGURE 51. PRODUCT MAPPING OF TOP 10 PLAYERS
- FIGURE 52. COMPETITIVE DASHBOARD
- FIGURE 53. COMPETITIVE HEATMAP: SOLDER MATERIALS MARKET
- FIGURE 54. TOP PLAYER POSITIONING, 2022
 預成型焊片的全球市場 - 市場佔有率和排行榜,整體銷售額與需求預測(2024年~2030年)
 歐洲、中東和非洲和亞太地區焊接材料市場規模和預測(2020 - 2030 年)、區域佔有率、趨勢和成長機會分析報告範圍:按產品(焊膏、棒材、線材、球體等)和工藝(印表機、雷射、波峰焊接、回流焊接及其他)
 2024 年世界焊接材料市場報告
 焊料材料市場報告:2030 年趨勢、預測與競爭分析
 焊料的全球市場,實際成果與預測(2018年~2029年)
 世界助焊劑市場
 焊接材料市場:按產品(焊條、助焊劑、焊膏)、類型(無鉛、鉛)、工藝、最終用戶 - 2023-2030 年全球預測
 到2028年的焊接材料市場預測-按產品(焊條、線材、焊膏、助焊劑、其他)、按類型、按工藝、全球分析用戶和地區
 焊接材料市場規模、份額、趨勢分析報告:按產品、按工藝、按地區、細分市場預測,2023-2032 年
 2023-2027 年全球焊接材料市場