


 |
市場調查報告書
商品編碼
1513326
次世代定序儀市場:按產品、應用、技術和最終用戶分類:2024-2035 年全球機會分析和產業預測Next Generation Sequencing Market By PRODUCT, By APPLICATION, By TECHNOLOGY, By END USER : Global Opportunity Analysis and Industry Forecast, 2024-2035 |
||||||
價格
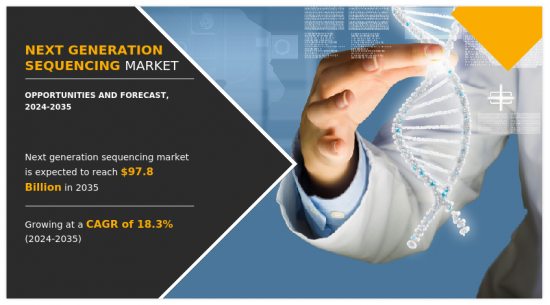
次世代定序儀市場預計到2023年將達到130億美元,預計到2035年將達到978億美元,2024年至2035年的複合年成長率為18.3%。次世代定序儀(NGS)是一種低成本、高速、高效能確定基因組鹼基序列的新方法。 NGS,也稱為深度定序或平行定序,是一項徹底改變分子生物學和基因組學研究的技術。 NGS 是一種高通量、非桑格定序方法。次世代定序儀使基因組定序變得極為快速且具有成本效益。這種方法可以對數十億條 DNA 鏈進行高效序列測定。次世代定序儀使得輕鬆對整個基因組進行定序並分析各種 DNA-蛋白質交互作用成為可能。這項技術使研究人員能夠專注、研究和解釋深層序列目標區域。次世代定序儀可以透過多種干預措施加以利用,包括腫瘤學、生物標記研究、藥物發現、生殖健康理解和個人化基因組學。推動 NGS 市場成長的關鍵因素包括不斷進步的技術、越來越多的研究合作和夥伴關係以促進 NGS 在醫院和研究中心的使用,以及全球基因組作圖計畫的數量不斷增加。例如,2023 年 3 月,Qiagen NVNV 宣布推出新的 QIAseq 平台合作夥伴計劃,並與醫療資料分析提供商 SOPHiA GENETICSTM 首次合作,該計劃整合了用於次世代定序儀(NGS) 的QIAseq 技術和SOPHiA DDMTM 數位分析平台宣布。同樣,2021 年 6 月,全球生命科學公司 Labcorp 和 Rosewell Park 綜合癌症中心的分子診斷公司 OmniSeq 宣布推出次世代定序儀平台 OmniSeq,以推進精準腫瘤學並改善患者治療結果。依產品分類,市場分為消耗品、平台和服務。按應用分類,市場分為生物標記/癌症、診斷、生殖醫學、個人化醫療、農業/動物研究和其他應用。依技術分類,市場分為合成定序、離子半導體定序、基於連接的定序、焦磷酸測序、單分子即時定序和其他技術。最終用戶分為學術和政府研究機構、製藥公司、生技公司、醫院和診所。按地區分類,我們有北美(美國、加拿大、墨西哥)、歐洲(德國、法國、英國、義大利、西班牙其他歐洲國家地區)、亞太地區(中國、日本、印度、澳洲、韓國、其他亞太地區),在亞太地區(巴西、南非、北非以及中東和非洲其他地區)進行分析。次世代定序儀市場的主要企業有 Agilent Technologies、BGI Group、F. Hoffmann-La Roche AG、Illumina Inc.、Precigen Inc.(Intrexon Bioinformatics 德國有限公司)、Pacific Biosciences of California, Inc.、PerkinElmer、 Inc.、 PierianDx Inc.、Qiend usern NV 和Thermo Fisher Scientific Inc.。主要參與者已將產品發布、產品開拓、聯盟、合作夥伴關係和產品核可作為在競爭激烈的市場中立足的關鍵策略。
 利害關係人的主要利益該報告定量分析了 2023 年至 2035 年次世代定序儀市場分析的細分市場、當前趨勢、估計和動態,並概述了次世代定序儀市場的總體情況,識別機會。市場研究提供與關鍵促進因素、限制因素和機會相關的資訊。波特的五力分析揭示了買家和供應商幫助相關人員做出以利潤為導向的商業決策並加強其供應商-買家網路的潛力。對次世代定序儀市場細分的詳細分析有助於確定當前的市場機會。每個地區的主要國家都根據其對全球市場的收益貢獻繪製了地圖。參與者定位有助於基準化分析,並提供對市場參與者當前位置的清晰了解。該報告包括對區域和全球次世代定序儀市場趨勢、主要參與者、細分市場、應用領域和市場成長策略的分析。
目錄
第1章簡介
第 2 章執行摘要
第3章市場概況
- 市場定義和範圍
- 主要發現
- 影響因素
- 主要投資機會
- 波特五力分析
- 市場動態
- 促進因素
- 抑制因素
- 機會
第 4 章次世代定序儀市場:按產品
- 概述
- 消耗品
- 按消耗品類型分類的下一代次世代定序儀市場
- 樣品製備耗材次世代定序儀市場:依類型
- 按消耗品類型分類的下一代次世代定序儀市場
- 平台
- 平台次世代定序儀市場:按類型
- 服務
- 服務次世代定序儀市場:按類型
- 定序服務次世代定序儀市場:按類型
- 按資料管理服務類型分類的下一代次世代定序儀市場
- 服務次世代定序儀市場:按類型
第5章次世代定序儀市場:依應用分類
- 概述
- 診斷劑
- 生物標記和癌症
- 生殖健康
- 個人化醫療
- 農業和動物研究
- 其他
第6章次世代定序儀市場:依技術分類
- 概述
- 邊合成邊定序 (SBS)
- 離子半導體序列(IOS)
- 連接定序 (SBL)
- 焦磷酸測序
- 單分子即時定序(SMRT)
- 其他
第 7 章次世代定序儀市場:按最終用戶分類
- 概述
- 學術/臨床研究中心
- 製藥和生物技術公司
- 醫院/診所
- 其他
第8章次世代定序儀市場:按地區
- 概述
- 北美洲
- 美國
- 加拿大
- 墨西哥
- 歐洲
- 德國
- 法國
- 英國
- 義大利
- 西班牙
- 其他
- 亞太地區
- 日本
- 中國
- 印度
- 澳洲
- 韓國
- 其他
- 拉丁美洲/中東/非洲
- 巴西
- 沙烏地阿拉伯
- 南非
- 其他
第9章 競爭格局
- 介紹
- 關鍵成功策略
- 10家主要企業產品圖譜
- 競爭對手儀表板
- 競爭熱圖
- 2023年主要企業定位
第10章 公司簡介
- ILLUMINA INC.
- F. HOFFMANN-LA ROCHE AG
- Qiagen NV
- ABGI group
- PerkinElmer, Inc
- Agilent Technologies, Inc.
- Pacific Biosciences of California
- Thermo Fisher Scientific Inc.
- PRECIGEN INC
Product Code: A01718
The next generation sequencing market was valued at $ 13 billion in 2023 and is estimated to reach $97.8 billion by 2035, exhibiting a CAGR of 18.3% from 2024 to 2035. Next generation sequencing (NGS) is a novel procedure for sequencing genomes at low costs and high speed with improved efficiency. NGS, also known as deep sequencing and parallel sequencing, is a technology that has revolutionized molecular biology and genomics research. It is a high throughput, non-Sanger based sequencing method. Next generation sequencing has made sequencing of genomes very rapid and cost-effective. Through this method, billions of DNA strands can be sequenced efficiently. Next generation sequencing has made it possible to conveniently sequence whole genomes and analyze various DNA-protein interactions. This technique allows the researcher to focus, study, and interpret deep sequence target regions. Next generation sequencing can be utilized through varied interventions such as oncology, biomarker studies, drug discovery, understanding reproductive health, and personalized genomics.The major factors driving the growth of the NGS market include rise in technological advancements, rise in the number of collaborations & partnerships to promote the use of NGS in hospitals & research centers, and increase in genome mapping programs throughout the world. For instance, in March 2023, Qiagen N.V. N.V. announced the launch of the new QIAseq Platform Partnership program and the first partnership with medical data-analysis provider SOPHiA GENETICSTM that will bring together its QIAseq technology for next-generation sequencing (NGS) with the SOPHiA DDMTM digital analytics platform. Similarly, in June 2021, Labcorp, a global leading life science company, and OmniSeq, a molecular diagnostic of Rosewell Park Comprehensive Cancer Center, together announced the launch of OmniSeq INSIGHT, which is a next generation sequencing platform to advance the precision oncology and improve patient outcome.The next generation sequencing market is segmented into product, application, technology, end user, and region. By product, the market is classified into consumables, platforms, and services. On the basis of application, the market is fragmented into biomarkers & cancer, diagnostics, reproductive health, personalized medicine, agriculture & animal research, and other applications. On the basis of technology, the market is segmented into sequencing by synthesis, ion semiconductor sequencing, sequencing by ligation, pyrosequencing, single molecule real time sequencing, and other technologies. By end user, the market is divided into academic & government research institutes, pharmaceutical companies, biotechnology companies, and hospitals & clinics. Region-wise, it is analyzed across North America (U.S., Canada, and Mexico), Europe (Germany, France, UK, Italy, Spain, and rest of Europe), Asia-Pacific (China, Japan, India, Australia, South Korea, and rest of Asia-Pacific), and LAMEA (Brazil, South Africa, North Africa, Middle East & Africa).The key players that operate in the next generation sequencing market are Agilent Technologies, Inc., BGI Group, F. Hoffmann-La Roche AG, Illumina Inc, Precigen Inc., (Intrexon Bioinformatics Germany GmbH), Pacific Biosciences of California, Inc., PerkinElmer, Inc., PierianDx Inc., Qiend usern N.V., and Thermo Fisher Scientific Inc. The key players have adopted product launch, product development, collaboration, partnership, and product approval as the key strategies to strengthen their foothold in the competitive market. Additional benefits you will get with this purchase are:
- Quarterly Update and* (only available with a corporate license, on listed price)
- 5 additional Company Profile of client Choice pre- or Post-purchase, as a free update.
- Free Upcoming Version on the Purchase of Five and Enterprise User License.
- 16 analyst hours of support* (post-purchase, if you find additional data requirements upon review of the report, you may receive support amounting to 16 analyst hours to solve questions, and post-sale queries)
- 15% Free Customization* (in case the scope or segment of the report does not match your requirements, 15% is equivalent to 3 working days of free work, applicable once)
- Free data Pack on the Five and Enterprise User License. (Excel version of the report)
- Free Updated report if the report is 6-12 months old or older.
- 24-hour priority response*
- Free Industry updates and white papers.Possible Customization with this report (with additional cost and timeline, please talk to the sales executive to know more)
- Regulatory Guidelines
- Additional company profiles with specific to client's interest
- Additional country or region analysis- market size and forecast
- Expanded list for Company Profiles
- Historic market data
- Key player details (including location, contact details, supplier/vendor network etc. in excel format)
Key Market Segments
By TECHNOLOGY
- Sequencing by synthesis (SBS)
- Ion semiconductor sequencing (IOS)
- Sequencing by Ligation (SBL)
- Pyrosequencing
- Single-molecule-real-time sequencing (SMRT)
- Others
By END USER
- Academic and clinical research centers
- Pharmaceutical and biotechnology companies
- Hospitals and clinics
- Others
By PRODUCT
- Consumables
- Type
- Sample Preparation Consumables◦
- Type
- Other Consumables
- Platforms
- Type
- MiSeq
- Ion Torrent
- SOLiD
- Pacbio Rs II and Sequel System
- Others
- Services
- Type
- Sequencing Services◦
- Type
- Data Management Services◦
- Type
By APPLICATION
- Diagnostics
- Biomarkers and Cancer
- Reproductive Health
- Personalized medicine
- Agriculture and animal research
- Others
By Region
- North America
- U.S.
- Canada
- Mexico
- Europe
- Germany
- France
- UK
- Italy
- Spain
- Rest of Europe
- Asia-Pacific
- Japan
- China
- India
- Australia
- South Korea
- Rest of Asia-Pacific
- LAMEA
- Brazil
- Saudi Arabia
- South Africa
- Rest of LAMEA
Key Market Players:
- ILLUMINA INC.
- F. HOFFMANN-LA ROCHE AG
- Qiagen N.V
- abgi group
- PerkinElmer, Inc
- Agilent Technologies, Inc.
- Pacific Biosciences of California
- Thermo Fisher Scientific Inc.
- PRECIGEN INC
TABLE OF CONTENTS
CHAPTER 1: INTRODUCTION
- 1.1. Report description
- 1.2. Key market segments
- 1.3. Key benefits to the stakeholders
- 1.4. Research methodology
- 1.4.1. Primary research
- 1.4.2. Secondary research
- 1.4.3. Analyst tools and models
CHAPTER 2: EXECUTIVE SUMMARY
- 2.1. CXO perspective
CHAPTER 3: MARKET OVERVIEW
- 3.1. Market definition and scope
- 3.2. Key findings
- 3.2.1. Top impacting factors
- 3.2.2. Top investment pockets
- 3.3. Porter's five forces analysis
- 3.4. Market dynamics
- 3.4.1. Drivers
- 3.4.2. Restraints
- 3.4.3. Opportunities
CHAPTER 4: NEXT GENERATION SEQUENCING MARKET, BY PRODUCT
- 4.1. Overview
- 4.1.1. Market size and forecast
- 4.2. Consumables
- 4.2.1. Key market trends, growth factors and opportunities
- 4.2.2. Market size and forecast, by region
- 4.2.3. Market share analysis by country
- 4.2.4. Consumables Next Generation Sequencing Market by Type
- 4.2.4.1. Sample Preparation Consumables Next Generation Sequencing Market by Type
- 4.3. Platforms
- 4.3.1. Key market trends, growth factors and opportunities
- 4.3.2. Market size and forecast, by region
- 4.3.3. Market share analysis by country
- 4.3.4. Platforms Next Generation Sequencing Market by Type
- 4.4. Services
- 4.4.1. Key market trends, growth factors and opportunities
- 4.4.2. Market size and forecast, by region
- 4.4.3. Market share analysis by country
- 4.4.4. Services Next Generation Sequencing Market by Type
- 4.4.4.1. Sequencing Services Next Generation Sequencing Market by Type
- 4.4.4.2. Data Management Services Next Generation Sequencing Market by Type
CHAPTER 5: NEXT GENERATION SEQUENCING MARKET, BY APPLICATION
- 5.1. Overview
- 5.1.1. Market size and forecast
- 5.2. Diagnostics
- 5.2.1. Key market trends, growth factors and opportunities
- 5.2.2. Market size and forecast, by region
- 5.2.3. Market share analysis by country
- 5.3. Biomarkers and Cancer
- 5.3.1. Key market trends, growth factors and opportunities
- 5.3.2. Market size and forecast, by region
- 5.3.3. Market share analysis by country
- 5.4. Reproductive Health
- 5.4.1. Key market trends, growth factors and opportunities
- 5.4.2. Market size and forecast, by region
- 5.4.3. Market share analysis by country
- 5.5. Personalized medicine
- 5.5.1. Key market trends, growth factors and opportunities
- 5.5.2. Market size and forecast, by region
- 5.5.3. Market share analysis by country
- 5.6. Agriculture and animal research
- 5.6.1. Key market trends, growth factors and opportunities
- 5.6.2. Market size and forecast, by region
- 5.6.3. Market share analysis by country
- 5.7. Others
- 5.7.1. Key market trends, growth factors and opportunities
- 5.7.2. Market size and forecast, by region
- 5.7.3. Market share analysis by country
CHAPTER 6: NEXT GENERATION SEQUENCING MARKET, BY TECHNOLOGY
- 6.1. Overview
- 6.1.1. Market size and forecast
- 6.2. Sequencing by synthesis (SBS)
- 6.2.1. Key market trends, growth factors and opportunities
- 6.2.2. Market size and forecast, by region
- 6.2.3. Market share analysis by country
- 6.3. Ion semiconductor sequencing (IOS)
- 6.3.1. Key market trends, growth factors and opportunities
- 6.3.2. Market size and forecast, by region
- 6.3.3. Market share analysis by country
- 6.4. Sequencing by Ligation (SBL)
- 6.4.1. Key market trends, growth factors and opportunities
- 6.4.2. Market size and forecast, by region
- 6.4.3. Market share analysis by country
- 6.5. Pyrosequencing
- 6.5.1. Key market trends, growth factors and opportunities
- 6.5.2. Market size and forecast, by region
- 6.5.3. Market share analysis by country
- 6.6. Single-molecule-real-time sequencing (SMRT)
- 6.6.1. Key market trends, growth factors and opportunities
- 6.6.2. Market size and forecast, by region
- 6.6.3. Market share analysis by country
- 6.7. Others
- 6.7.1. Key market trends, growth factors and opportunities
- 6.7.2. Market size and forecast, by region
- 6.7.3. Market share analysis by country
CHAPTER 7: NEXT GENERATION SEQUENCING MARKET, BY END USER
- 7.1. Overview
- 7.1.1. Market size and forecast
- 7.2. Academic and clinical research centers
- 7.2.1. Key market trends, growth factors and opportunities
- 7.2.2. Market size and forecast, by region
- 7.2.3. Market share analysis by country
- 7.3. Pharmaceutical and biotechnology companies
- 7.3.1. Key market trends, growth factors and opportunities
- 7.3.2. Market size and forecast, by region
- 7.3.3. Market share analysis by country
- 7.4. Hospitals and clinics
- 7.4.1. Key market trends, growth factors and opportunities
- 7.4.2. Market size and forecast, by region
- 7.4.3. Market share analysis by country
- 7.5. Others
- 7.5.1. Key market trends, growth factors and opportunities
- 7.5.2. Market size and forecast, by region
- 7.5.3. Market share analysis by country
CHAPTER 8: NEXT GENERATION SEQUENCING MARKET, BY REGION
- 8.1. Overview
- 8.1.1. Market size and forecast By Region
- 8.2. North America
- 8.2.1. Key market trends, growth factors and opportunities
- 8.2.2. Market size and forecast, by PRODUCT
- 8.2.3. Market size and forecast, by APPLICATION
- 8.2.4. Market size and forecast, by TECHNOLOGY
- 8.2.5. Market size and forecast, by END USER
- 8.2.6. Market size and forecast, by country
- 8.2.6.1. U.S.
- 8.2.6.1.1. Market size and forecast, by PRODUCT
- 8.2.6.1.2. Market size and forecast, by APPLICATION
- 8.2.6.1.3. Market size and forecast, by TECHNOLOGY
- 8.2.6.1.4. Market size and forecast, by END USER
- 8.2.6.2. Canada
- 8.2.6.2.1. Market size and forecast, by PRODUCT
- 8.2.6.2.2. Market size and forecast, by APPLICATION
- 8.2.6.2.3. Market size and forecast, by TECHNOLOGY
- 8.2.6.2.4. Market size and forecast, by END USER
- 8.2.6.3. Mexico
- 8.2.6.3.1. Market size and forecast, by PRODUCT
- 8.2.6.3.2. Market size and forecast, by APPLICATION
- 8.2.6.3.3. Market size and forecast, by TECHNOLOGY
- 8.2.6.3.4. Market size and forecast, by END USER
- 8.3. Europe
- 8.3.1. Key market trends, growth factors and opportunities
- 8.3.2. Market size and forecast, by PRODUCT
- 8.3.3. Market size and forecast, by APPLICATION
- 8.3.4. Market size and forecast, by TECHNOLOGY
- 8.3.5. Market size and forecast, by END USER
- 8.3.6. Market size and forecast, by country
- 8.3.6.1. Germany
- 8.3.6.1.1. Market size and forecast, by PRODUCT
- 8.3.6.1.2. Market size and forecast, by APPLICATION
- 8.3.6.1.3. Market size and forecast, by TECHNOLOGY
- 8.3.6.1.4. Market size and forecast, by END USER
- 8.3.6.2. France
- 8.3.6.2.1. Market size and forecast, by PRODUCT
- 8.3.6.2.2. Market size and forecast, by APPLICATION
- 8.3.6.2.3. Market size and forecast, by TECHNOLOGY
- 8.3.6.2.4. Market size and forecast, by END USER
- 8.3.6.3. UK
- 8.3.6.3.1. Market size and forecast, by PRODUCT
- 8.3.6.3.2. Market size and forecast, by APPLICATION
- 8.3.6.3.3. Market size and forecast, by TECHNOLOGY
- 8.3.6.3.4. Market size and forecast, by END USER
- 8.3.6.4. Italy
- 8.3.6.4.1. Market size and forecast, by PRODUCT
- 8.3.6.4.2. Market size and forecast, by APPLICATION
- 8.3.6.4.3. Market size and forecast, by TECHNOLOGY
- 8.3.6.4.4. Market size and forecast, by END USER
- 8.3.6.5. Spain
- 8.3.6.5.1. Market size and forecast, by PRODUCT
- 8.3.6.5.2. Market size and forecast, by APPLICATION
- 8.3.6.5.3. Market size and forecast, by TECHNOLOGY
- 8.3.6.5.4. Market size and forecast, by END USER
- 8.3.6.6. Rest of Europe
- 8.3.6.6.1. Market size and forecast, by PRODUCT
- 8.3.6.6.2. Market size and forecast, by APPLICATION
- 8.3.6.6.3. Market size and forecast, by TECHNOLOGY
- 8.3.6.6.4. Market size and forecast, by END USER
- 8.4. Asia-Pacific
- 8.4.1. Key market trends, growth factors and opportunities
- 8.4.2. Market size and forecast, by PRODUCT
- 8.4.3. Market size and forecast, by APPLICATION
- 8.4.4. Market size and forecast, by TECHNOLOGY
- 8.4.5. Market size and forecast, by END USER
- 8.4.6. Market size and forecast, by country
- 8.4.6.1. Japan
- 8.4.6.1.1. Market size and forecast, by PRODUCT
- 8.4.6.1.2. Market size and forecast, by APPLICATION
- 8.4.6.1.3. Market size and forecast, by TECHNOLOGY
- 8.4.6.1.4. Market size and forecast, by END USER
- 8.4.6.2. China
- 8.4.6.2.1. Market size and forecast, by PRODUCT
- 8.4.6.2.2. Market size and forecast, by APPLICATION
- 8.4.6.2.3. Market size and forecast, by TECHNOLOGY
- 8.4.6.2.4. Market size and forecast, by END USER
- 8.4.6.3. India
- 8.4.6.3.1. Market size and forecast, by PRODUCT
- 8.4.6.3.2. Market size and forecast, by APPLICATION
- 8.4.6.3.3. Market size and forecast, by TECHNOLOGY
- 8.4.6.3.4. Market size and forecast, by END USER
- 8.4.6.4. Australia
- 8.4.6.4.1. Market size and forecast, by PRODUCT
- 8.4.6.4.2. Market size and forecast, by APPLICATION
- 8.4.6.4.3. Market size and forecast, by TECHNOLOGY
- 8.4.6.4.4. Market size and forecast, by END USER
- 8.4.6.5. South Korea
- 8.4.6.5.1. Market size and forecast, by PRODUCT
- 8.4.6.5.2. Market size and forecast, by APPLICATION
- 8.4.6.5.3. Market size and forecast, by TECHNOLOGY
- 8.4.6.5.4. Market size and forecast, by END USER
- 8.4.6.6. Rest of Asia-Pacific
- 8.4.6.6.1. Market size and forecast, by PRODUCT
- 8.4.6.6.2. Market size and forecast, by APPLICATION
- 8.4.6.6.3. Market size and forecast, by TECHNOLOGY
- 8.4.6.6.4. Market size and forecast, by END USER
- 8.5. LAMEA
- 8.5.1. Key market trends, growth factors and opportunities
- 8.5.2. Market size and forecast, by PRODUCT
- 8.5.3. Market size and forecast, by APPLICATION
- 8.5.4. Market size and forecast, by TECHNOLOGY
- 8.5.5. Market size and forecast, by END USER
- 8.5.6. Market size and forecast, by country
- 8.5.6.1. Brazil
- 8.5.6.1.1. Market size and forecast, by PRODUCT
- 8.5.6.1.2. Market size and forecast, by APPLICATION
- 8.5.6.1.3. Market size and forecast, by TECHNOLOGY
- 8.5.6.1.4. Market size and forecast, by END USER
- 8.5.6.2. Saudi Arabia
- 8.5.6.2.1. Market size and forecast, by PRODUCT
- 8.5.6.2.2. Market size and forecast, by APPLICATION
- 8.5.6.2.3. Market size and forecast, by TECHNOLOGY
- 8.5.6.2.4. Market size and forecast, by END USER
- 8.5.6.3. South Africa
- 8.5.6.3.1. Market size and forecast, by PRODUCT
- 8.5.6.3.2. Market size and forecast, by APPLICATION
- 8.5.6.3.3. Market size and forecast, by TECHNOLOGY
- 8.5.6.3.4. Market size and forecast, by END USER
- 8.5.6.4. Rest of LAMEA
- 8.5.6.4.1. Market size and forecast, by PRODUCT
- 8.5.6.4.2. Market size and forecast, by APPLICATION
- 8.5.6.4.3. Market size and forecast, by TECHNOLOGY
- 8.5.6.4.4. Market size and forecast, by END USER
CHAPTER 9: COMPETITIVE LANDSCAPE
- 9.1. Introduction
- 9.2. Top winning strategies
- 9.3. Product mapping of top 10 player
- 9.4. Competitive dashboard
- 9.5. Competitive heatmap
- 9.6. Top player positioning, 2023
CHAPTER 10: COMPANY PROFILES
- 10.1. ILLUMINA INC.
- 10.1.1. Company overview
- 10.1.2. Key executives
- 10.1.3. Company snapshot
- 10.1.4. Operating business segments
- 10.1.5. Product portfolio
- 10.1.6. Business performance
- 10.1.7. Key strategic moves and developments
- 10.2. F. HOFFMANN-LA ROCHE AG
- 10.2.1. Company overview
- 10.2.2. Key executives
- 10.2.3. Company snapshot
- 10.2.4. Operating business segments
- 10.2.5. Product portfolio
- 10.2.6. Business performance
- 10.2.7. Key strategic moves and developments
- 10.3. Qiagen N.V
- 10.3.1. Company overview
- 10.3.2. Key executives
- 10.3.3. Company snapshot
- 10.3.4. Operating business segments
- 10.3.5. Product portfolio
- 10.3.6. Business performance
- 10.3.7. Key strategic moves and developments
- 10.4. ABGI group
- 10.4.1. Company overview
- 10.4.2. Key executives
- 10.4.3. Company snapshot
- 10.4.4. Operating business segments
- 10.4.5. Product portfolio
- 10.4.6. Business performance
- 10.4.7. Key strategic moves and developments
- 10.5. PerkinElmer, Inc
- 10.5.1. Company overview
- 10.5.2. Key executives
- 10.5.3. Company snapshot
- 10.5.4. Operating business segments
- 10.5.5. Product portfolio
- 10.5.6. Business performance
- 10.5.7. Key strategic moves and developments
- 10.6. Agilent Technologies, Inc.
- 10.6.1. Company overview
- 10.6.2. Key executives
- 10.6.3. Company snapshot
- 10.6.4. Operating business segments
- 10.6.5. Product portfolio
- 10.6.6. Business performance
- 10.6.7. Key strategic moves and developments
- 10.7. Pacific Biosciences of California
- 10.7.1. Company overview
- 10.7.2. Key executives
- 10.7.3. Company snapshot
- 10.7.4. Operating business segments
- 10.7.5. Product portfolio
- 10.7.6. Business performance
- 10.7.7. Key strategic moves and developments
- 10.8. Thermo Fisher Scientific Inc.
- 10.8.1. Company overview
- 10.8.2. Key executives
- 10.8.3. Company snapshot
- 10.8.4. Operating business segments
- 10.8.5. Product portfolio
- 10.8.6. Business performance
- 10.8.7. Key strategic moves and developments
- 10.9. PRECIGEN INC
- 10.9.1. Company overview
- 10.9.2. Key executives
- 10.9.3. Company snapshot
- 10.9.4. Operating business segments
- 10.9.5. Product portfolio
- 10.9.6. Business performance
- 10.9.7. Key strategic moves and developments
LIST OF TABLES
- TABLE 01. GLOBAL NEXT GENERATION SEQUENCING MARKET, BY PRODUCT, 2023-2035 ($MILLION)
- TABLE 02. NEXT GENERATION SEQUENCING MARKET FOR CONSUMABLES, BY REGION, 2023-2035 ($MILLION)
- TABLE 03. GLOBAL CONSUMABLES NEXT GENERATION SEQUENCING MARKET, BY TYPE, 2023-2035 ($MILLION)
- TABLE 04. GLOBAL SAMPLE PREPARATION CONSUMABLES NEXT GENERATION SEQUENCING MARKET, BY TYPE, 2023-2035 ($MILLION)
- TABLE 05. NEXT GENERATION SEQUENCING MARKET FOR PLATFORMS, BY REGION, 2023-2035 ($MILLION)
- TABLE 06. GLOBAL PLATFORMS NEXT GENERATION SEQUENCING MARKET, BY TYPE, 2023-2035 ($MILLION)
- TABLE 07. NEXT GENERATION SEQUENCING MARKET FOR SERVICES, BY REGION, 2023-2035 ($MILLION)
- TABLE 08. GLOBAL SERVICES NEXT GENERATION SEQUENCING MARKET, BY TYPE, 2023-2035 ($MILLION)
- TABLE 09. GLOBAL SEQUENCING SERVICES NEXT GENERATION SEQUENCING MARKET, BY TYPE, 2023-2035 ($MILLION)
- TABLE 10. GLOBAL DATA MANAGEMENT SERVICES NEXT GENERATION SEQUENCING MARKET, BY TYPE, 2023-2035 ($MILLION)
- TABLE 11. GLOBAL NEXT GENERATION SEQUENCING MARKET, BY APPLICATION, 2023-2035 ($MILLION)
- TABLE 12. NEXT GENERATION SEQUENCING MARKET FOR DIAGNOSTICS, BY REGION, 2023-2035 ($MILLION)
- TABLE 13. NEXT GENERATION SEQUENCING MARKET FOR BIOMARKERS AND CANCER, BY REGION, 2023-2035 ($MILLION)
- TABLE 14. NEXT GENERATION SEQUENCING MARKET FOR REPRODUCTIVE HEALTH, BY REGION, 2023-2035 ($MILLION)
- TABLE 15. NEXT GENERATION SEQUENCING MARKET FOR PERSONALIZED MEDICINE, BY REGION, 2023-2035 ($MILLION)
- TABLE 16. NEXT GENERATION SEQUENCING MARKET FOR AGRICULTURE AND ANIMAL RESEARCH, BY REGION, 2023-2035 ($MILLION)
- TABLE 17. NEXT GENERATION SEQUENCING MARKET FOR OTHERS, BY REGION, 2023-2035 ($MILLION)
- TABLE 18. GLOBAL NEXT GENERATION SEQUENCING MARKET, BY TECHNOLOGY, 2023-2035 ($MILLION)
- TABLE 19. NEXT GENERATION SEQUENCING MARKET FOR SEQUENCING BY SYNTHESIS (SBS), BY REGION, 2023-2035 ($MILLION)
- TABLE 20. NEXT GENERATION SEQUENCING MARKET FOR ION SEMICONDUCTOR SEQUENCING (IOS), BY REGION, 2023-2035 ($MILLION)
- TABLE 21. NEXT GENERATION SEQUENCING MARKET FOR SEQUENCING BY LIGATION (SBL), BY REGION, 2023-2035 ($MILLION)
- TABLE 22. NEXT GENERATION SEQUENCING MARKET FOR PYROSEQUENCING, BY REGION, 2023-2035 ($MILLION)
- TABLE 23. NEXT GENERATION SEQUENCING MARKET FOR SINGLE-MOLECULE-REAL-TIME SEQUENCING (SMRT), BY REGION, 2023-2035 ($MILLION)
- TABLE 24. NEXT GENERATION SEQUENCING MARKET FOR OTHERS, BY REGION, 2023-2035 ($MILLION)
- TABLE 25. GLOBAL NEXT GENERATION SEQUENCING MARKET, BY END USER, 2023-2035 ($MILLION)
- TABLE 26. NEXT GENERATION SEQUENCING MARKET FOR ACADEMIC AND CLINICAL RESEARCH CENTERS, BY REGION, 2023-2035 ($MILLION)
- TABLE 27. NEXT GENERATION SEQUENCING MARKET FOR PHARMACEUTICAL AND BIOTECHNOLOGY COMPANIES, BY REGION, 2023-2035 ($MILLION)
- TABLE 28. NEXT GENERATION SEQUENCING MARKET FOR HOSPITALS AND CLINICS, BY REGION, 2023-2035 ($MILLION)
- TABLE 29. NEXT GENERATION SEQUENCING MARKET FOR OTHERS, BY REGION, 2023-2035 ($MILLION)
- TABLE 30. NEXT GENERATION SEQUENCING MARKET, BY REGION, 2023-2035 ($MILLION)
- TABLE 31. NORTH AMERICA NEXT GENERATION SEQUENCING MARKET, BY PRODUCT, 2023-2035 ($MILLION)
- TABLE 32. NORTH AMERICA NEXT GENERATION SEQUENCING MARKET, BY APPLICATION, 2023-2035 ($MILLION)
- TABLE 33. NORTH AMERICA NEXT GENERATION SEQUENCING MARKET, BY TECHNOLOGY, 2023-2035 ($MILLION)
- TABLE 34. NORTH AMERICA NEXT GENERATION SEQUENCING MARKET, BY END USER, 2023-2035 ($MILLION)
- TABLE 35. NORTH AMERICA NEXT GENERATION SEQUENCING MARKET, BY COUNTRY, 2023-2035 ($MILLION)
- TABLE 36. U.S. NEXT GENERATION SEQUENCING MARKET, BY PRODUCT, 2023-2035 ($MILLION)
- TABLE 37. U.S. NEXT GENERATION SEQUENCING MARKET, BY APPLICATION, 2023-2035 ($MILLION)
- TABLE 38. U.S. NEXT GENERATION SEQUENCING MARKET, BY TECHNOLOGY, 2023-2035 ($MILLION)
- TABLE 39. U.S. NEXT GENERATION SEQUENCING MARKET, BY END USER, 2023-2035 ($MILLION)
- TABLE 40. CANADA NEXT GENERATION SEQUENCING MARKET, BY PRODUCT, 2023-2035 ($MILLION)
- TABLE 41. CANADA NEXT GENERATION SEQUENCING MARKET, BY APPLICATION, 2023-2035 ($MILLION)
- TABLE 42. CANADA NEXT GENERATION SEQUENCING MARKET, BY TECHNOLOGY, 2023-2035 ($MILLION)
- TABLE 43. CANADA NEXT GENERATION SEQUENCING MARKET, BY END USER, 2023-2035 ($MILLION)
- TABLE 44. MEXICO NEXT GENERATION SEQUENCING MARKET, BY PRODUCT, 2023-2035 ($MILLION)
- TABLE 45. MEXICO NEXT GENERATION SEQUENCING MARKET, BY APPLICATION, 2023-2035 ($MILLION)
- TABLE 46. MEXICO NEXT GENERATION SEQUENCING MARKET, BY TECHNOLOGY, 2023-2035 ($MILLION)
- TABLE 47. MEXICO NEXT GENERATION SEQUENCING MARKET, BY END USER, 2023-2035 ($MILLION)
- TABLE 48. EUROPE NEXT GENERATION SEQUENCING MARKET, BY PRODUCT, 2023-2035 ($MILLION)
- TABLE 49. EUROPE NEXT GENERATION SEQUENCING MARKET, BY APPLICATION, 2023-2035 ($MILLION)
- TABLE 50. EUROPE NEXT GENERATION SEQUENCING MARKET, BY TECHNOLOGY, 2023-2035 ($MILLION)
- TABLE 51. EUROPE NEXT GENERATION SEQUENCING MARKET, BY END USER, 2023-2035 ($MILLION)
- TABLE 52. EUROPE NEXT GENERATION SEQUENCING MARKET, BY COUNTRY, 2023-2035 ($MILLION)
- TABLE 53. GERMANY NEXT GENERATION SEQUENCING MARKET, BY PRODUCT, 2023-2035 ($MILLION)
- TABLE 54. GERMANY NEXT GENERATION SEQUENCING MARKET, BY APPLICATION, 2023-2035 ($MILLION)
- TABLE 55. GERMANY NEXT GENERATION SEQUENCING MARKET, BY TECHNOLOGY, 2023-2035 ($MILLION)
- TABLE 56. GERMANY NEXT GENERATION SEQUENCING MARKET, BY END USER, 2023-2035 ($MILLION)
- TABLE 57. FRANCE NEXT GENERATION SEQUENCING MARKET, BY PRODUCT, 2023-2035 ($MILLION)
- TABLE 58. FRANCE NEXT GENERATION SEQUENCING MARKET, BY APPLICATION, 2023-2035 ($MILLION)
- TABLE 59. FRANCE NEXT GENERATION SEQUENCING MARKET, BY TECHNOLOGY, 2023-2035 ($MILLION)
- TABLE 60. FRANCE NEXT GENERATION SEQUENCING MARKET, BY END USER, 2023-2035 ($MILLION)
- TABLE 61. UK NEXT GENERATION SEQUENCING MARKET, BY PRODUCT, 2023-2035 ($MILLION)
- TABLE 62. UK NEXT GENERATION SEQUENCING MARKET, BY APPLICATION, 2023-2035 ($MILLION)
- TABLE 63. UK NEXT GENERATION SEQUENCING MARKET, BY TECHNOLOGY, 2023-2035 ($MILLION)
- TABLE 64. UK NEXT GENERATION SEQUENCING MARKET, BY END USER, 2023-2035 ($MILLION)
- TABLE 65. ITALY NEXT GENERATION SEQUENCING MARKET, BY PRODUCT, 2023-2035 ($MILLION)
- TABLE 66. ITALY NEXT GENERATION SEQUENCING MARKET, BY APPLICATION, 2023-2035 ($MILLION)
- TABLE 67. ITALY NEXT GENERATION SEQUENCING MARKET, BY TECHNOLOGY, 2023-2035 ($MILLION)
- TABLE 68. ITALY NEXT GENERATION SEQUENCING MARKET, BY END USER, 2023-2035 ($MILLION)
- TABLE 69. SPAIN NEXT GENERATION SEQUENCING MARKET, BY PRODUCT, 2023-2035 ($MILLION)
- TABLE 70. SPAIN NEXT GENERATION SEQUENCING MARKET, BY APPLICATION, 2023-2035 ($MILLION)
- TABLE 71. SPAIN NEXT GENERATION SEQUENCING MARKET, BY TECHNOLOGY, 2023-2035 ($MILLION)
- TABLE 72. SPAIN NEXT GENERATION SEQUENCING MARKET, BY END USER, 2023-2035 ($MILLION)
- TABLE 73. REST OF EUROPE NEXT GENERATION SEQUENCING MARKET, BY PRODUCT, 2023-2035 ($MILLION)
- TABLE 74. REST OF EUROPE NEXT GENERATION SEQUENCING MARKET, BY APPLICATION, 2023-2035 ($MILLION)
- TABLE 75. REST OF EUROPE NEXT GENERATION SEQUENCING MARKET, BY TECHNOLOGY, 2023-2035 ($MILLION)
- TABLE 76. REST OF EUROPE NEXT GENERATION SEQUENCING MARKET, BY END USER, 2023-2035 ($MILLION)
- TABLE 77. ASIA-PACIFIC NEXT GENERATION SEQUENCING MARKET, BY PRODUCT, 2023-2035 ($MILLION)
- TABLE 78. ASIA-PACIFIC NEXT GENERATION SEQUENCING MARKET, BY APPLICATION, 2023-2035 ($MILLION)
- TABLE 79. ASIA-PACIFIC NEXT GENERATION SEQUENCING MARKET, BY TECHNOLOGY, 2023-2035 ($MILLION)
- TABLE 80. ASIA-PACIFIC NEXT GENERATION SEQUENCING MARKET, BY END USER, 2023-2035 ($MILLION)
- TABLE 81. ASIA-PACIFIC NEXT GENERATION SEQUENCING MARKET, BY COUNTRY, 2023-2035 ($MILLION)
- TABLE 82. JAPAN NEXT GENERATION SEQUENCING MARKET, BY PRODUCT, 2023-2035 ($MILLION)
- TABLE 83. JAPAN NEXT GENERATION SEQUENCING MARKET, BY APPLICATION, 2023-2035 ($MILLION)
- TABLE 84. JAPAN NEXT GENERATION SEQUENCING MARKET, BY TECHNOLOGY, 2023-2035 ($MILLION)
- TABLE 85. JAPAN NEXT GENERATION SEQUENCING MARKET, BY END USER, 2023-2035 ($MILLION)
- TABLE 86. CHINA NEXT GENERATION SEQUENCING MARKET, BY PRODUCT, 2023-2035 ($MILLION)
- TABLE 87. CHINA NEXT GENERATION SEQUENCING MARKET, BY APPLICATION, 2023-2035 ($MILLION)
- TABLE 88. CHINA NEXT GENERATION SEQUENCING MARKET, BY TECHNOLOGY, 2023-2035 ($MILLION)
- TABLE 89. CHINA NEXT GENERATION SEQUENCING MARKET, BY END USER, 2023-2035 ($MILLION)
- TABLE 90. INDIA NEXT GENERATION SEQUENCING MARKET, BY PRODUCT, 2023-2035 ($MILLION)
- TABLE 91. INDIA NEXT GENERATION SEQUENCING MARKET, BY APPLICATION, 2023-2035 ($MILLION)
- TABLE 92. INDIA NEXT GENERATION SEQUENCING MARKET, BY TECHNOLOGY, 2023-2035 ($MILLION)
- TABLE 93. INDIA NEXT GENERATION SEQUENCING MARKET, BY END USER, 2023-2035 ($MILLION)
- TABLE 94. AUSTRALIA NEXT GENERATION SEQUENCING MARKET, BY PRODUCT, 2023-2035 ($MILLION)
- TABLE 95. AUSTRALIA NEXT GENERATION SEQUENCING MARKET, BY APPLICATION, 2023-2035 ($MILLION)
- TABLE 96. AUSTRALIA NEXT GENERATION SEQUENCING MARKET, BY TECHNOLOGY, 2023-2035 ($MILLION)
- TABLE 97. AUSTRALIA NEXT GENERATION SEQUENCING MARKET, BY END USER, 2023-2035 ($MILLION)
- TABLE 98. SOUTH KOREA NEXT GENERATION SEQUENCING MARKET, BY PRODUCT, 2023-2035 ($MILLION)
- TABLE 99. SOUTH KOREA NEXT GENERATION SEQUENCING MARKET, BY APPLICATION, 2023-2035 ($MILLION)
- TABLE 100. SOUTH KOREA NEXT GENERATION SEQUENCING MARKET, BY TECHNOLOGY, 2023-2035 ($MILLION)
- TABLE 101. SOUTH KOREA NEXT GENERATION SEQUENCING MARKET, BY END USER, 2023-2035 ($MILLION)
- TABLE 102. REST OF ASIA-PACIFIC NEXT GENERATION SEQUENCING MARKET, BY PRODUCT, 2023-2035 ($MILLION)
- TABLE 103. REST OF ASIA-PACIFIC NEXT GENERATION SEQUENCING MARKET, BY APPLICATION, 2023-2035 ($MILLION)
- TABLE 104. REST OF ASIA-PACIFIC NEXT GENERATION SEQUENCING MARKET, BY TECHNOLOGY, 2023-2035 ($MILLION)
- TABLE 105. REST OF ASIA-PACIFIC NEXT GENERATION SEQUENCING MARKET, BY END USER, 2023-2035 ($MILLION)
- TABLE 106. LAMEA NEXT GENERATION SEQUENCING MARKET, BY PRODUCT, 2023-2035 ($MILLION)
- TABLE 107. LAMEA NEXT GENERATION SEQUENCING MARKET, BY APPLICATION, 2023-2035 ($MILLION)
- TABLE 108. LAMEA NEXT GENERATION SEQUENCING MARKET, BY TECHNOLOGY, 2023-2035 ($MILLION)
- TABLE 109. LAMEA NEXT GENERATION SEQUENCING MARKET, BY END USER, 2023-2035 ($MILLION)
- TABLE 110. LAMEA NEXT GENERATION SEQUENCING MARKET, BY COUNTRY, 2023-2035 ($MILLION)
- TABLE 111. BRAZIL NEXT GENERATION SEQUENCING MARKET, BY PRODUCT, 2023-2035 ($MILLION)
- TABLE 112. BRAZIL NEXT GENERATION SEQUENCING MARKET, BY APPLICATION, 2023-2035 ($MILLION)
- TABLE 113. BRAZIL NEXT GENERATION SEQUENCING MARKET, BY TECHNOLOGY, 2023-2035 ($MILLION)
- TABLE 114. BRAZIL NEXT GENERATION SEQUENCING MARKET, BY END USER, 2023-2035 ($MILLION)
- TABLE 115. SAUDI ARABIA NEXT GENERATION SEQUENCING MARKET, BY PRODUCT, 2023-2035 ($MILLION)
- TABLE 116. SAUDI ARABIA NEXT GENERATION SEQUENCING MARKET, BY APPLICATION, 2023-2035 ($MILLION)
- TABLE 117. SAUDI ARABIA NEXT GENERATION SEQUENCING MARKET, BY TECHNOLOGY, 2023-2035 ($MILLION)
- TABLE 118. SAUDI ARABIA NEXT GENERATION SEQUENCING MARKET, BY END USER, 2023-2035 ($MILLION)
- TABLE 119. SOUTH AFRICA NEXT GENERATION SEQUENCING MARKET, BY PRODUCT, 2023-2035 ($MILLION)
- TABLE 120. SOUTH AFRICA NEXT GENERATION SEQUENCING MARKET, BY APPLICATION, 2023-2035 ($MILLION)
- TABLE 121. SOUTH AFRICA NEXT GENERATION SEQUENCING MARKET, BY TECHNOLOGY, 2023-2035 ($MILLION)
- TABLE 122. SOUTH AFRICA NEXT GENERATION SEQUENCING MARKET, BY END USER, 2023-2035 ($MILLION)
- TABLE 123. REST OF LAMEA NEXT GENERATION SEQUENCING MARKET, BY PRODUCT, 2023-2035 ($MILLION)
- TABLE 124. REST OF LAMEA NEXT GENERATION SEQUENCING MARKET, BY APPLICATION, 2023-2035 ($MILLION)
- TABLE 125. REST OF LAMEA NEXT GENERATION SEQUENCING MARKET, BY TECHNOLOGY, 2023-2035 ($MILLION)
- TABLE 126. REST OF LAMEA NEXT GENERATION SEQUENCING MARKET, BY END USER, 2023-2035 ($MILLION)
- TABLE 127. ILLUMINA INC.: KEY EXECUTIVES
- TABLE 128. ILLUMINA INC.: COMPANY SNAPSHOT
- TABLE 129. ILLUMINA INC.: PRODUCT SEGMENTS
- TABLE 130. ILLUMINA INC.: SERVICE SEGMENTS
- TABLE 131. ILLUMINA INC.: PRODUCT PORTFOLIO
- TABLE 132. ILLUMINA INC.: KEY STRATEGIES
- TABLE 133. F. HOFFMANN-LA ROCHE AG: KEY EXECUTIVES
- TABLE 134. F. HOFFMANN-LA ROCHE AG: COMPANY SNAPSHOT
- TABLE 135. F. HOFFMANN-LA ROCHE AG: PRODUCT SEGMENTS
- TABLE 136. F. HOFFMANN-LA ROCHE AG: SERVICE SEGMENTS
- TABLE 137. F. HOFFMANN-LA ROCHE AG: PRODUCT PORTFOLIO
- TABLE 138. F. HOFFMANN-LA ROCHE AG: KEY STRATEGIES
- TABLE 139. QIAGEN N.V: KEY EXECUTIVES
- TABLE 140. QIAGEN N.V: COMPANY SNAPSHOT
- TABLE 141. QIAGEN N.V: PRODUCT SEGMENTS
- TABLE 142. QIAGEN N.V: SERVICE SEGMENTS
- TABLE 143. QIAGEN N.V: PRODUCT PORTFOLIO
- TABLE 144. QIAGEN N.V: KEY STRATEGIES
- TABLE 145. ABGI GROUP: KEY EXECUTIVES
- TABLE 146. ABGI GROUP: COMPANY SNAPSHOT
- TABLE 147. ABGI GROUP: PRODUCT SEGMENTS
- TABLE 148. ABGI GROUP: SERVICE SEGMENTS
- TABLE 149. ABGI GROUP: PRODUCT PORTFOLIO
- TABLE 150. ABGI GROUP: KEY STRATEGIES
- TABLE 151. PERKINELMER, INC: KEY EXECUTIVES
- TABLE 152. PERKINELMER, INC: COMPANY SNAPSHOT
- TABLE 153. PERKINELMER, INC: PRODUCT SEGMENTS
- TABLE 154. PERKINELMER, INC: SERVICE SEGMENTS
- TABLE 155. PERKINELMER, INC: PRODUCT PORTFOLIO
- TABLE 156. PERKINELMER, INC: KEY STRATEGIES
- TABLE 157. AGILENT TECHNOLOGIES, INC.: KEY EXECUTIVES
- TABLE 158. AGILENT TECHNOLOGIES, INC.: COMPANY SNAPSHOT
- TABLE 159. AGILENT TECHNOLOGIES, INC.: PRODUCT SEGMENTS
- TABLE 160. AGILENT TECHNOLOGIES, INC.: SERVICE SEGMENTS
- TABLE 161. AGILENT TECHNOLOGIES, INC.: PRODUCT PORTFOLIO
- TABLE 162. AGILENT TECHNOLOGIES, INC.: KEY STRATEGIES
- TABLE 163. PACIFIC BIOSCIENCES OF CALIFORNIA: KEY EXECUTIVES
- TABLE 164. PACIFIC BIOSCIENCES OF CALIFORNIA: COMPANY SNAPSHOT
- TABLE 165. PACIFIC BIOSCIENCES OF CALIFORNIA: PRODUCT SEGMENTS
- TABLE 166. PACIFIC BIOSCIENCES OF CALIFORNIA: SERVICE SEGMENTS
- TABLE 167. PACIFIC BIOSCIENCES OF CALIFORNIA: PRODUCT PORTFOLIO
- TABLE 168. PACIFIC BIOSCIENCES OF CALIFORNIA: KEY STRATEGIES
- TABLE 169. THERMO FISHER SCIENTIFIC INC. : KEY EXECUTIVES
- TABLE 170. THERMO FISHER SCIENTIFIC INC. : COMPANY SNAPSHOT
- TABLE 171. THERMO FISHER SCIENTIFIC INC. : PRODUCT SEGMENTS
- TABLE 172. THERMO FISHER SCIENTIFIC INC. : SERVICE SEGMENTS
- TABLE 173. THERMO FISHER SCIENTIFIC INC. : PRODUCT PORTFOLIO
- TABLE 174. THERMO FISHER SCIENTIFIC INC. : KEY STRATEGIES
- TABLE 175. PRECIGEN INC: KEY EXECUTIVES
- TABLE 176. PRECIGEN INC: COMPANY SNAPSHOT
- TABLE 177. PRECIGEN INC: PRODUCT SEGMENTS
- TABLE 178. PRECIGEN INC: SERVICE SEGMENTS
- TABLE 179. PRECIGEN INC: PRODUCT PORTFOLIO
- TABLE 180. PRECIGEN INC: KEY STRATEGIES
LIST OF FIGURES
- FIGURE 01. NEXT GENERATION SEQUENCING MARKET, 2023-2035
- FIGURE 02. SEGMENTATION OF NEXT GENERATION SEQUENCING MARKET,2023-2035
- FIGURE 03. TOP IMPACTING FACTORS IN NEXT GENERATION SEQUENCING MARKET
- FIGURE 04. TOP INVESTMENT POCKETS IN NEXT GENERATION SEQUENCING MARKET (2024-2035)
- FIGURE 05. BARGAINING POWER OF SUPPLIERS
- FIGURE 06. BARGAINING POWER OF BUYERS
- FIGURE 07. THREAT OF SUBSTITUTION
- FIGURE 08. THREAT OF SUBSTITUTION
- FIGURE 09. COMPETITIVE RIVALRY
- FIGURE 10. GLOBAL NEXT GENERATION SEQUENCING MARKET:DRIVERS, RESTRAINTS AND OPPORTUNITIES
- FIGURE 11. NEXT GENERATION SEQUENCING MARKET, BY PRODUCT, 2023 AND 2035(%)
- FIGURE 12. COMPARATIVE SHARE ANALYSIS OF NEXT GENERATION SEQUENCING MARKET FOR CONSUMABLES, BY COUNTRY 2023 AND 2035(%)
- FIGURE 13. COMPARATIVE SHARE ANALYSIS OF NEXT GENERATION SEQUENCING MARKET FOR PLATFORMS, BY COUNTRY 2023 AND 2035(%)
- FIGURE 14. COMPARATIVE SHARE ANALYSIS OF NEXT GENERATION SEQUENCING MARKET FOR SERVICES, BY COUNTRY 2023 AND 2035(%)
- FIGURE 15. NEXT GENERATION SEQUENCING MARKET, BY APPLICATION, 2023 AND 2035(%)
- FIGURE 16. COMPARATIVE SHARE ANALYSIS OF NEXT GENERATION SEQUENCING MARKET FOR DIAGNOSTICS, BY COUNTRY 2023 AND 2035(%)
- FIGURE 17. COMPARATIVE SHARE ANALYSIS OF NEXT GENERATION SEQUENCING MARKET FOR BIOMARKERS AND CANCER, BY COUNTRY 2023 AND 2035(%)
- FIGURE 18. COMPARATIVE SHARE ANALYSIS OF NEXT GENERATION SEQUENCING MARKET FOR REPRODUCTIVE HEALTH, BY COUNTRY 2023 AND 2035(%)
- FIGURE 19. COMPARATIVE SHARE ANALYSIS OF NEXT GENERATION SEQUENCING MARKET FOR PERSONALIZED MEDICINE, BY COUNTRY 2023 AND 2035(%)
- FIGURE 20. COMPARATIVE SHARE ANALYSIS OF NEXT GENERATION SEQUENCING MARKET FOR AGRICULTURE AND ANIMAL RESEARCH, BY COUNTRY 2023 AND 2035(%)
- FIGURE 21. COMPARATIVE SHARE ANALYSIS OF NEXT GENERATION SEQUENCING MARKET FOR OTHERS, BY COUNTRY 2023 AND 2035(%)
- FIGURE 22. NEXT GENERATION SEQUENCING MARKET, BY TECHNOLOGY, 2023 AND 2035(%)
- FIGURE 23. COMPARATIVE SHARE ANALYSIS OF NEXT GENERATION SEQUENCING MARKET FOR SEQUENCING BY SYNTHESIS (SBS), BY COUNTRY 2023 AND 2035(%)
- FIGURE 24. COMPARATIVE SHARE ANALYSIS OF NEXT GENERATION SEQUENCING MARKET FOR ION SEMICONDUCTOR SEQUENCING (IOS), BY COUNTRY 2023 AND 2035(%)
- FIGURE 25. COMPARATIVE SHARE ANALYSIS OF NEXT GENERATION SEQUENCING MARKET FOR SEQUENCING BY LIGATION (SBL), BY COUNTRY 2023 AND 2035(%)
- FIGURE 26. COMPARATIVE SHARE ANALYSIS OF NEXT GENERATION SEQUENCING MARKET FOR PYROSEQUENCING, BY COUNTRY 2023 AND 2035(%)
- FIGURE 27. COMPARATIVE SHARE ANALYSIS OF NEXT GENERATION SEQUENCING MARKET FOR SINGLE-MOLECULE-REAL-TIME SEQUENCING (SMRT), BY COUNTRY 2023 AND 2035(%)
- FIGURE 28. COMPARATIVE SHARE ANALYSIS OF NEXT GENERATION SEQUENCING MARKET FOR OTHERS, BY COUNTRY 2023 AND 2035(%)
- FIGURE 29. NEXT GENERATION SEQUENCING MARKET, BY END USER, 2023 AND 2035(%)
- FIGURE 30. COMPARATIVE SHARE ANALYSIS OF NEXT GENERATION SEQUENCING MARKET FOR ACADEMIC AND CLINICAL RESEARCH CENTERS, BY COUNTRY 2023 AND 2035(%)
- FIGURE 31. COMPARATIVE SHARE ANALYSIS OF NEXT GENERATION SEQUENCING MARKET FOR PHARMACEUTICAL AND BIOTECHNOLOGY COMPANIES, BY COUNTRY 2023 AND 2035(%)
- FIGURE 32. COMPARATIVE SHARE ANALYSIS OF NEXT GENERATION SEQUENCING MARKET FOR HOSPITALS AND CLINICS, BY COUNTRY 2023 AND 2035(%)
- FIGURE 33. COMPARATIVE SHARE ANALYSIS OF NEXT GENERATION SEQUENCING MARKET FOR OTHERS, BY COUNTRY 2023 AND 2035(%)
- FIGURE 34. NEXT GENERATION SEQUENCING MARKET BY REGION, 2023 AND 2035(%)
- FIGURE 35. U.S. NEXT GENERATION SEQUENCING MARKET, 2023-2035 ($MILLION)
- FIGURE 36. CANADA NEXT GENERATION SEQUENCING MARKET, 2023-2035 ($MILLION)
- FIGURE 37. MEXICO NEXT GENERATION SEQUENCING MARKET, 2023-2035 ($MILLION)
- FIGURE 38. GERMANY NEXT GENERATION SEQUENCING MARKET, 2023-2035 ($MILLION)
- FIGURE 39. FRANCE NEXT GENERATION SEQUENCING MARKET, 2023-2035 ($MILLION)
- FIGURE 40. UK NEXT GENERATION SEQUENCING MARKET, 2023-2035 ($MILLION)
- FIGURE 41. ITALY NEXT GENERATION SEQUENCING MARKET, 2023-2035 ($MILLION)
- FIGURE 42. SPAIN NEXT GENERATION SEQUENCING MARKET, 2023-2035 ($MILLION)
- FIGURE 43. REST OF EUROPE NEXT GENERATION SEQUENCING MARKET, 2023-2035 ($MILLION)
- FIGURE 44. JAPAN NEXT GENERATION SEQUENCING MARKET, 2023-2035 ($MILLION)
- FIGURE 45. CHINA NEXT GENERATION SEQUENCING MARKET, 2023-2035 ($MILLION)
- FIGURE 46. INDIA NEXT GENERATION SEQUENCING MARKET, 2023-2035 ($MILLION)
- FIGURE 47. AUSTRALIA NEXT GENERATION SEQUENCING MARKET, 2023-2035 ($MILLION)
- FIGURE 48. SOUTH KOREA NEXT GENERATION SEQUENCING MARKET, 2023-2035 ($MILLION)
- FIGURE 49. REST OF ASIA-PACIFIC NEXT GENERATION SEQUENCING MARKET, 2023-2035 ($MILLION)
- FIGURE 50. BRAZIL NEXT GENERATION SEQUENCING MARKET, 2023-2035 ($MILLION)
- FIGURE 51. SAUDI ARABIA NEXT GENERATION SEQUENCING MARKET, 2023-2035 ($MILLION)
- FIGURE 52. SOUTH AFRICA NEXT GENERATION SEQUENCING MARKET, 2023-2035 ($MILLION)
- FIGURE 53. REST OF LAMEA NEXT GENERATION SEQUENCING MARKET, 2023-2035 ($MILLION)
- FIGURE 54. TOP WINNING STRATEGIES, BY YEAR
- FIGURE 55. TOP WINNING STRATEGIES, BY DEVELOPMENT
- FIGURE 56. TOP WINNING STRATEGIES, BY COMPANY
- FIGURE 57. PRODUCT MAPPING OF TOP 10 PLAYERS
- FIGURE 58. COMPETITIVE DASHBOARD
- FIGURE 59. COMPETITIVE HEATMAP: NEXT GENERATION SEQUENCING MARKET
- FIGURE 60. TOP PLAYER POSITIONING, 2023
02-2729-4219
+886-2-2729-4219
 次世代定序儀市場:按技術、產品類型、應用和最終用戶分類 - 2025-2030 年全球預測
 次世代定序的全球市場:2024-2034年
 下一代定序 (NGS) 資訊學市場,按產品、按應用、最終用戶、國家和地區 - 2024-2032 年行業分析、市場規模、市場佔有率和預測
 下一代定序 (NGS) 全球市場分析與預測 (-2033):類型、產品、服務、技術、應用、最終用戶、組件、流程、功能
 下一代定序(NGS)市場:依產品供應、應用和最終用戶劃分的產業展望,到2031年的全球預測
 次世代定序市場規模、佔有率和成長分析:按產品/服務、技術、最終用戶、地區分類 - 產業預測,2024-2031 年
 下一代定序儀市場:依細分市場劃分的規模、佔有率、法規、償付、安裝基礎、到2033年的預測
 下一代定序市場、佔有率、規模、趨勢、行業分析報告:依應用、依技術、依產品、依最終用途、依地區、依細分市場、預測,2024-2032年
 次世代定序(NGS)檢驗的開發平台(管線) - 開發階段,市場區隔,地區和國家,法規途徑,主要企業(2024年版)
 下一代定序市場,按產品類型、按定序類型、按應用、按最終用戶、按地理位置
▼