


 |
市場調查報告書
商品編碼
1513380
全球汽車運輸市場:按類型、最終用戶分類 - 機會分析和產業預測,2023-2032 年Car Carrier Market By Type (Open-Air Car Carrier, Enclosed Car Carrier), By End User (Automotive Sales Service Shop 4S, Terminals, Others): Global Opportunity Analysis and Industry Forecast, 2023-2032 |
||||||
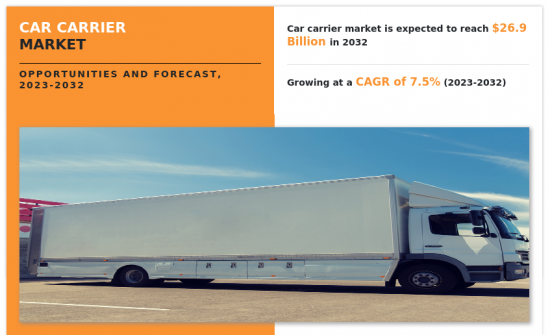
2022年,汽車運輸公司的全球市場佔有率為132億美元,預計到2032年將達到269億美元,2023年至2032年的複合年成長率為7.5%。
汽車運輸服務是汽車產業的一部分。汽車運輸服務在將汽車從一處運送到另一處的過程中發揮著重要作用。汽車承運服務確保安全且有效率地交付您的車輛。汽車運輸服務是汽車行業的一個重要方面。汽車承運服務的意義延伸到汽車使用者和供應商的各個方面。汽車承運服務專門運輸整個車隊的客車、豪華車和汽車,提供安全可靠的運輸方式。汽車運輸服務使個人和家庭的搬遷援助過程變得非常方便和有效率。汽車經銷商嚴重依賴汽車運輸服務來接收庫存。新車的高效運輸對於業務運作至關重要。
人口和汽車需求的增加以及汽車行業技術的快速進步是推動汽車運輸市場成長的兩個關鍵因素。隨著人們向城市和都市區轉移,通勤、獲得服務和休閒等因素也增加了對個人汽車的需求。汽車承運商依靠車輛監控系統遠端監控運輸過程中的車輛狀況,檢查溫度、濕度和安全性等因素。此外,政府法規的變化和燃料價格的波動是阻礙市場成長的兩個關鍵因素。各國政府正在實施嚴格的排放標準,以消除污染和氣候相關問題。為了滿足這些標準,汽車運輸公司必須滿足新標準並承擔更換舊車輛方法的成本。燃油價格的波動導致汽車運輸公司的成本波動。與燃料相關的成本佔運輸公司營運成本的很大一部分。此外,汽車供應鏈的日益全球化和電子商務平台的成長是提供市場成長機會的兩個主要因素。全球化使汽車製造商能夠進入新市場,並接觸到汽車行業以前薄弱地區的客戶。汽車運輸公司透過提供端到端運輸在促進這種擴張方面發揮關鍵作用。電子商務平台使汽車製造商能夠繞過傳統的經銷商網路,直接在網路上向消費者銷售汽車。這一趨勢增加了汽車承運商將車輛從製造工廠和配送中心直接運送到客戶所在地的需求。
2023 年 8 月,總部位於亞特蘭大的 FVL 承運人 Jack Cooper Transport 簽訂了收購 Moore Transport 資產的最終協議。 Jack Cooper 收購 Moore Transport 將為 Jack Cooper 的持有增加 240 輛汽車運輸卡車。此次收購顯著增強了 Jack Cooper 在東海岸和中西部地區的影響力。
2023年5月,東風商用車推出主打智慧物流的高階大型車「東風天龍GX」。從概念到量產,東風天龍GX遵循中國最嚴格的研發流程。該車搭載東風康明斯Z14引擎、Endurant 12速自排變速箱、東風德納後軸等完美匹配的動力傳動系統系統,這就是東風天龍GX。與同類自動手排變速箱(AMT)產品相比,換檔次數減少了25%。車輛擁有覆蓋不同工況的13種駕駛模式,可最大限度地提高油耗並最大限度地減少駕駛員介入。該技術提供了與國外卡車相當的高效能性能和卓越的燃油效率。主要功能包括先進緊急煞車系統(AEBS)、電子穩定控制系統(ESC)、車道偏離警告系統(LDWS)、前方碰撞警報系統(FCWS)、駕駛疲勞監測系統(DMS)、環視監控系統(AVM )、輪胎壓力監測系統(TPMS)等
2022年,全球將銷售約6.6萬輛電動客車和6萬輛中重型卡車,分別佔汽車銷量的1.2%及客車總銷量的約4.5%。中國在燃料電池和電動卡車和公共汽車的製造和銷售方面繼續處於行業領先地位。 2022年,中國將銷售新電動客車5.4萬輛,預計中國將銷售電動中重型卡車5.2萬輛,分別佔中國總銷量的18%和4%,全球整體的4%它們分別約佔銷量的80% 和85%。此外,在北美、歐洲和拉丁美洲銷售的許多客車和卡車都是中國品牌。
AP 穆勒-馬士基與 Kodiak Robotics 合作,在休士頓和奧克拉荷馬市之間開闢第一條商業自動卡車車道。這條貨運通道標誌著科迪亞克與馬士基之間合作的擴大,合作始於 2022 年 11 月首次自動貨運,這是馬士基全球研發中心計畫的一部分。自八月以來,Kodiak 每週為馬士基客戶運送貨物八次,由一名安全司機駕駛。
汽車運輸車市場的主要參與者有 Miller Industries、Boydstan、Cottrell、Randall、Kentucky Trailers、Delavan、Wally Moe Trailers、Infinity Trailers、Tech Equipment Inc. 和東風卡車。追蹤和監控市場營運公司所採用的產品發布和合作等關鍵策略。
相關人員的主要利益
- 本報告定量分析了 2022 年至 2032 年汽車運輸市場分析的細分市場、當前趨勢、估計/趨勢和動態,並總體上確定了汽車運輸市場的機會。
- 我們提供市場研究以及與市場促進因素、市場限制和市場機會相關的資訊。
- 波特的五力分析揭示了買家和供應商的潛力,幫助相關人員做出利潤驅動的業務決策並加強供應商和買家網路。
- 對汽車承運商市場細分的詳細分析有助於識別市場機會。
- 每個地區的主要國家都根據其對全球市場的收益貢獻繪製了地圖。
- 市場公司定位有助於基準化分析並提供對市場公司當前地位的清晰了解。
- 該報告包括對區域和全球汽車運輸市場趨勢、主要企業、細分市場、應用領域和市場成長策略的分析。
該報告可以客製化(需要單獨的費用和時間表)。
- 投資機會
- 按產品/細分市場分類的公司市場佔有率分析
- 新產品開發/主要企業產品矩陣
- 主要企業詳細資料(Excel 格式,包括位置、聯絡資訊、供應商/供應商網路等)
- 全球/區域/國家層級公司的市場佔有率分析
目錄
第1章簡介
第 2 章執行摘要
第3章市場概況
- 市場定義和範圍
- 主要發現
- 影響因素
- 主要投資機會
- 波特五力分析
- 市場動態
- 促進因素
- 抑制因素
- 機會
第4章汽車營運商市場:按類型
- 概述
- 敞篷汽車運輸車
- 封閉式汽車運輸車
第5章 汽車營運商市場:依最終用戶分類
- 概述
- 汽車銷售服務商店
- 終端
- 其他
第6章 汽車運輸市場:依地區
- 概述
- 北美洲
- 美國
- 加拿大
- 墨西哥
- 歐洲
- 英國
- 德國
- 法國
- 義大利
- 西班牙
- 其他
- 亞太地區
- 中國
- 印度
- 日本
- 韓國
- 澳洲
- 其他
- 拉丁美洲
- 巴西
- 阿根廷
- 其他
- 中東/非洲
- 海灣合作理事會國家
- 南非
- 其他
第7章 競爭格局
- 介紹
- 關鍵成功策略
- 10家主要企業產品圖譜
- 競爭對手儀表板
- 競爭熱圖
- 2022年主要企業定位
第8章 公司簡介
- Miller Industries
- Landoll Corporation
- Kentucky Trailers
- Delavan
- Tec Equipment Inc.
- Boydstun Equipment Manufacturing
- Wally-Mo Inc
- Infinity Trailers
- Dongfeng Motor Company
- Cottrell Trailers
The global car carrier market share was valued at $13.2 billion in 2022, and is projected to reach $26.9 billion by 2032, growing at a CAGR of 7.5% from 2023 to 2032.
Car carrier services are a part of the automotive industry. The car carrier services play an important role in the transportation of vehicles from one point to the other point. Car carrier services ensure the safe and efficient delivery of vehicles. Car carrier services are an important aspect of the auto industry. The significance of car services is extended to various aspects of automotive users and suppliers. Car carrier services specialize in the transportation of passenger car vehicles, luxury vehicles, entire fleet of cars, as they provide a safe and reliable means. Car carrier services make the process of individual and family relocation assistance very convenient and efficient. Car dealerships heavily rely on car carrier services to receive inventory. The efficient transportation of new vehicles is important for business operations.
Increasing population and demand for automotive vehicles and rapid technological advancements in the automotive industry are the two significant factors driving the growth of car carrier market. The people are shifting to cities and urban areas, and the requirement for personal vehicles is also growing due to factors such as work commute, accessing services and recreational activities. Car carriers are utilizing vehicle monitoring systems to remotely monitor vehicle conditions during transportation for checking factors such as temperature, humidity and security. Furthermore, changing government regulations and fluctuating fuel prices are two significant factors hampering the growth of the market. Governments are imposing strict emission standards to eliminate pollution and climate related problems. In order to meet these standards, the car carrier companies will have to incur costs to meet the new standards and displace the old fleet methods. Fluctuating fuel prices are leading to volatility of cost for car carrier companies. The expenses related to fuel comprise a substantial portion of operating costs for transportation companies. Moreover, rising globalization in automotive supply chains and growing e-commerce platforms are the two main significant factors providing an opportunity for the market growth. Globalization has enabled automotive manufacturers to enter new markets and reach customers in regions where earlier there was a limited presence of automotive industry. Car carriers are playing an important role in facilitating this expansion by offering end-to-end transportation. E-commerce platforms are enabling automotive manufacturers to sell vehicles directly to consumers online, bypassing traditional dealership networks. This trend is increasing the requirement for car carriers to transport vehicles from manufacturing facilities and distribution centers directly to the customer's location.
In August 2023, Atlanta based FVL hauler Jack Cooper Transport entered into a definitive agreement and acquired assets of Moore Transport including a fleet of 240 car carrier trucks. The purchase of Moore Transport by Jack Cooper will add an additional 240 car carrying trucks to Jack Cooper's fleet. The acquisition will significantly enhance the logistics firm's footprint along the East Coast and within the Midwest region.
In May 2023, Dongfeng commercial vehicles launched a high-end heavy-duty vehicle named Dongfeng Tianlong GX with an emphasis on intelligent logistics. The Dongfeng Tianlong GX follows China's most rigorous R&D procedure from conception to mass production. With a flawlessly matched powertrain system consisting of a Dongfeng Cummins Z14 engine, an Endurant 12-speed automatic transmission, and a Dongfeng Dana rear axle, the truck is a Dongfeng Tianlong GX. By 25%, it lessens the number of gear changes when compared to analogous automated manual transmission (AMT) goods. The vehicle can maximize fuel consumption and minimize driver intervention due to its 13 operating modes, which cover a range of working circumstances. The technology offers efficient performance and better fuel efficiency that is on level with foreign trucks. The main features include advanced emergency braking system (AEBS), electronic stability control (ESC), lane departure warning system (LDWS), forward collision warning system (FCWS), driver fatigue monitoring system (DMS), around view monitoring system (AVM), and tire pressure monitoring system (TPMS).
Approximately 66,000 electric buses and 60,000 medium- and heavy-duty trucks were sold globally in 2022, accounting for 1.2% of vehicle sales and approximately 4.5% of all bus sales. China is still the industry leader in the manufacture and distribution of fuel cell and electric trucks and buses. 54,000 brand-new electric buses and 52,000 predicted electric medium- and heavy-duty trucks were sold in China in 2022; these figures accounted for 18% and 4% of China's overall sales as well as around 80% and 85% of worldwide sales, respectively. Furthermore, a large number of buses and trucks marketed in North America, Europe, and Latin America are Chinese brands.
AP Moller Maersk collaborated with Kodiak Robotics Inc. and launched the first commercial autonomous trucking lane between Houston and Oklahoma City. The freight lane marks an expansion of the collaboration between Kodiak and Maersk, that started during the first autonomous freight deliveries together in November 2022 as part of Maersk's Global Innovation Center Program. Kodiak has been delivering eight loads per week, with a safety driver behind the wheel, for Maersk customers since August.
The key players in the car carrier market are Miller Industries, Boydstun, Cottrell, Landoll, Kentucky Trailers, Delavan, Wally-Mo Trailer, Infinity Trailer, Tec Equipment Inc., and Dongfeng Trucks. Major strategies such as product launch and collaboration were applied by players operating in the market are tracked and monitored.
Key Benefits For Stakeholders
- This report provides a quantitative analysis of the market segments, current trends, estimations, and dynamics of the car carrier market analysis from 2022 to 2032 to identify the prevailing car carrier market opportunities.
- The market research is offered along with information related to key drivers, restraints, and opportunities.
- Porter's five forces analysis highlights the potency of buyers and suppliers to enable stakeholders make profit-oriented business decisions and strengthen their supplier-buyer network.
- In-depth analysis of the car carrier market segmentation assists to determine the prevailing market opportunities.
- Major countries in each region are mapped according to their revenue contribution to the global market.
- Market player positioning facilitates benchmarking and provides a clear understanding of the present position of the market players.
- The report includes the analysis of the regional as well as global car carrier market trends, key players, market segments, application areas, and market growth strategies.
Additional benefits you will get with this purchase are:
- Quarterly Update and* (only available with a corporate license, on listed price)
- 5 additional Company Profile of client Choice pre- or Post-purchase, as a free update.
- Free Upcoming Version on the Purchase of Five and Enterprise User License.
- 16 analyst hours of support* (post-purchase, if you find additional data requirements upon review of the report, you may receive support amounting to 16 analyst hours to solve questions, and post-sale queries)
- 15% Free Customization* (in case the scope or segment of the report does not match your requirements, 15% is equivalent to 3 working days of free work, applicable once)
- Free data Pack on the Five and Enterprise User License. (Excel version of the report)
- Free Updated report if the report is 6-12 months old or older.
- 24-hour priority response*
- Free Industry updates and white papers.
Possible Customization with this report (with additional cost and timeline, please talk to the sales executive to know more)
- Investment Opportunities
- Market share analysis of players by products/segments
- New Product Development/ Product Matrix of Key Players
- Key player details (including location, contact details, supplier/vendor network etc. in excel format)
- Market share analysis of players at global/region/country level
Key Market Segments
By Type
- Open-Air Car Carrier
- Enclosed Car Carrier
By End User
- Automotive Sales Service Shop 4S
- Terminals
- Others
By Region
- North America
- U.S.
- Canada
- Mexico
- Europe
- UK
- Germany
- France
- Italy
- Spain
- Rest of Europe
- Asia-Pacific
- China
- India
- Japan
- South Korea
- Australia
- Rest of Asia-Pacific
- Latin America
- Brazil
- Argentina
- Rest of Latin America
- Middle East and Africa
- GCC Countries
- South Africa
- Rest of Middle East And Africa
Key Market Players:
- Miller Industries
- Landoll Corporation
- Kentucky Trailers
- Delavan
- Tec Equipment Inc.
- Boydstun Equipment Manufacturing
- Wally-Mo Inc
- Infinity Trailers
- Dongfeng Motor Company
- Cottrell Trailers
TABLE OF CONTENTS
CHAPTER 1: INTRODUCTION
- 1.1. Report Description
- 1.2. Key market segments
- 1.3. Key benefits to the stakeholders
- 1.4. Research methodology
- 1.4.1. Primary research
- 1.4.2. Secondary research
- 1.4.3. Analyst tools and models
CHAPTER 2: EXECUTIVE SUMMARY
- 2.1. CXO perspective
CHAPTER 3: MARKET OVERVIEW
- 3.1. Market definition and scope
- 3.2. Key findings
- 3.2.1. Top impacting factors
- 3.2.2. Top investment pockets
- 3.3. Porter's Five Forces Analysis
- 3.4. Market dynamics
- 3.4.1. Drivers
- 3.4.2. Restraints
- 3.4.3. Opportunities
CHAPTER 4: CAR CARRIER MARKET, BY TYPE
- 4.1. Overview
- 4.1.1. Market size and forecast
- 4.2. Open-Air Car Carrier
- 4.2.1. Key market trends, growth factors and opportunities
- 4.2.2. Market size and forecast, by region
- 4.2.3. Market share analysis by country
- 4.3. Enclosed Car Carrier
- 4.3.1. Key market trends, growth factors and opportunities
- 4.3.2. Market size and forecast, by region
- 4.3.3. Market share analysis by country
CHAPTER 5: CAR CARRIER MARKET, BY END USER
- 5.1. Overview
- 5.1.1. Market size and forecast
- 5.2. Automotive Sales Service Shop 4S
- 5.2.1. Key market trends, growth factors and opportunities
- 5.2.2. Market size and forecast, by region
- 5.2.3. Market share analysis by country
- 5.3. Terminals
- 5.3.1. Key market trends, growth factors and opportunities
- 5.3.2. Market size and forecast, by region
- 5.3.3. Market share analysis by country
- 5.4. Others
- 5.4.1. Key market trends, growth factors and opportunities
- 5.4.2. Market size and forecast, by region
- 5.4.3. Market share analysis by country
CHAPTER 6: CAR CARRIER MARKET, BY REGION
- 6.1. Overview
- 6.1.1. Market size and forecast By Region
- 6.2. North America
- 6.2.1. Key market trends, growth factors and opportunities
- 6.2.2. Market size and forecast, by Type
- 6.2.3. Market size and forecast, by End User
- 6.2.4. Market size and forecast, by country
- 6.2.4.1. U.S.
- 6.2.4.1.1. Market size and forecast, by Type
- 6.2.4.1.2. Market size and forecast, by End User
- 6.2.4.2. Canada
- 6.2.4.2.1. Market size and forecast, by Type
- 6.2.4.2.2. Market size and forecast, by End User
- 6.2.4.3. Mexico
- 6.2.4.3.1. Market size and forecast, by Type
- 6.2.4.3.2. Market size and forecast, by End User
- 6.3. Europe
- 6.3.1. Key market trends, growth factors and opportunities
- 6.3.2. Market size and forecast, by Type
- 6.3.3. Market size and forecast, by End User
- 6.3.4. Market size and forecast, by country
- 6.3.4.1. UK
- 6.3.4.1.1. Market size and forecast, by Type
- 6.3.4.1.2. Market size and forecast, by End User
- 6.3.4.2. Germany
- 6.3.4.2.1. Market size and forecast, by Type
- 6.3.4.2.2. Market size and forecast, by End User
- 6.3.4.3. France
- 6.3.4.3.1. Market size and forecast, by Type
- 6.3.4.3.2. Market size and forecast, by End User
- 6.3.4.4. Italy
- 6.3.4.4.1. Market size and forecast, by Type
- 6.3.4.4.2. Market size and forecast, by End User
- 6.3.4.5. Spain
- 6.3.4.5.1. Market size and forecast, by Type
- 6.3.4.5.2. Market size and forecast, by End User
- 6.3.4.6. Rest of Europe
- 6.3.4.6.1. Market size and forecast, by Type
- 6.3.4.6.2. Market size and forecast, by End User
- 6.4. Asia-Pacific
- 6.4.1. Key market trends, growth factors and opportunities
- 6.4.2. Market size and forecast, by Type
- 6.4.3. Market size and forecast, by End User
- 6.4.4. Market size and forecast, by country
- 6.4.4.1. China
- 6.4.4.1.1. Market size and forecast, by Type
- 6.4.4.1.2. Market size and forecast, by End User
- 6.4.4.2. India
- 6.4.4.2.1. Market size and forecast, by Type
- 6.4.4.2.2. Market size and forecast, by End User
- 6.4.4.3. Japan
- 6.4.4.3.1. Market size and forecast, by Type
- 6.4.4.3.2. Market size and forecast, by End User
- 6.4.4.4. South Korea
- 6.4.4.4.1. Market size and forecast, by Type
- 6.4.4.4.2. Market size and forecast, by End User
- 6.4.4.5. Australia
- 6.4.4.5.1. Market size and forecast, by Type
- 6.4.4.5.2. Market size and forecast, by End User
- 6.4.4.6. Rest of Asia-Pacific
- 6.4.4.6.1. Market size and forecast, by Type
- 6.4.4.6.2. Market size and forecast, by End User
- 6.5. Latin America
- 6.5.1. Key market trends, growth factors and opportunities
- 6.5.2. Market size and forecast, by Type
- 6.5.3. Market size and forecast, by End User
- 6.5.4. Market size and forecast, by country
- 6.5.4.1. Brazil
- 6.5.4.1.1. Market size and forecast, by Type
- 6.5.4.1.2. Market size and forecast, by End User
- 6.5.4.2. Argentina
- 6.5.4.2.1. Market size and forecast, by Type
- 6.5.4.2.2. Market size and forecast, by End User
- 6.5.4.3. Rest of Latin America
- 6.5.4.3.1. Market size and forecast, by Type
- 6.5.4.3.2. Market size and forecast, by End User
- 6.6. Middle East and Africa
- 6.6.1. Key market trends, growth factors and opportunities
- 6.6.2. Market size and forecast, by Type
- 6.6.3. Market size and forecast, by End User
- 6.6.4. Market size and forecast, by country
- 6.6.4.1. GCC Countries
- 6.6.4.1.1. Market size and forecast, by Type
- 6.6.4.1.2. Market size and forecast, by End User
- 6.6.4.2. South Africa
- 6.6.4.2.1. Market size and forecast, by Type
- 6.6.4.2.2. Market size and forecast, by End User
- 6.6.4.3. Rest of Middle East And Africa
- 6.6.4.3.1. Market size and forecast, by Type
- 6.6.4.3.2. Market size and forecast, by End User
CHAPTER 7: COMPETITIVE LANDSCAPE
- 7.1. Introduction
- 7.2. Top winning strategies
- 7.3. Product mapping of top 10 player
- 7.4. Competitive dashboard
- 7.5. Competitive heatmap
- 7.6. Top player positioning, 2022
CHAPTER 8: COMPANY PROFILES
- 8.1. Miller Industries
- 8.1.1. Company overview
- 8.1.2. Key executives
- 8.1.3. Company snapshot
- 8.1.4. Operating business segments
- 8.1.5. Product portfolio
- 8.1.6. Business performance
- 8.1.7. Key strategic moves and developments
- 8.2. Landoll Corporation
- 8.2.1. Company overview
- 8.2.2. Key executives
- 8.2.3. Company snapshot
- 8.2.4. Operating business segments
- 8.2.5. Product portfolio
- 8.2.6. Business performance
- 8.2.7. Key strategic moves and developments
- 8.3. Kentucky Trailers
- 8.3.1. Company overview
- 8.3.2. Key executives
- 8.3.3. Company snapshot
- 8.3.4. Operating business segments
- 8.3.5. Product portfolio
- 8.3.6. Business performance
- 8.3.7. Key strategic moves and developments
- 8.4. Delavan
- 8.4.1. Company overview
- 8.4.2. Key executives
- 8.4.3. Company snapshot
- 8.4.4. Operating business segments
- 8.4.5. Product portfolio
- 8.4.6. Business performance
- 8.4.7. Key strategic moves and developments
- 8.5. Tec Equipment Inc.
- 8.5.1. Company overview
- 8.5.2. Key executives
- 8.5.3. Company snapshot
- 8.5.4. Operating business segments
- 8.5.5. Product portfolio
- 8.5.6. Business performance
- 8.5.7. Key strategic moves and developments
- 8.6. Boydstun Equipment Manufacturing
- 8.6.1. Company overview
- 8.6.2. Key executives
- 8.6.3. Company snapshot
- 8.6.4. Operating business segments
- 8.6.5. Product portfolio
- 8.6.6. Business performance
- 8.6.7. Key strategic moves and developments
- 8.7. Wally-Mo Inc
- 8.7.1. Company overview
- 8.7.2. Key executives
- 8.7.3. Company snapshot
- 8.7.4. Operating business segments
- 8.7.5. Product portfolio
- 8.7.6. Business performance
- 8.7.7. Key strategic moves and developments
- 8.8. Infinity Trailers
- 8.8.1. Company overview
- 8.8.2. Key executives
- 8.8.3. Company snapshot
- 8.8.4. Operating business segments
- 8.8.5. Product portfolio
- 8.8.6. Business performance
- 8.8.7. Key strategic moves and developments
- 8.9. Dongfeng Motor Company
- 8.9.1. Company overview
- 8.9.2. Key executives
- 8.9.3. Company snapshot
- 8.9.4. Operating business segments
- 8.9.5. Product portfolio
- 8.9.6. Business performance
- 8.9.7. Key strategic moves and developments
- 8.10. Cottrell Trailers
- 8.10.1. Company overview
- 8.10.2. Key executives
- 8.10.3. Company snapshot
- 8.10.4. Operating business segments
- 8.10.5. Product portfolio
- 8.10.6. Business performance
- 8.10.7. Key strategic moves and development
LIST OF TABLES
- TABLE 01. GLOBAL CAR CARRIER MARKET, BY TYPE, 2022-2032 ($BILLION)
- TABLE 02. CAR CARRIER MARKET FOR OPEN-AIR CAR CARRIER, BY REGION, 2022-2032 ($BILLION)
- TABLE 03. CAR CARRIER MARKET FOR ENCLOSED CAR CARRIER, BY REGION, 2022-2032 ($BILLION)
- TABLE 04. GLOBAL CAR CARRIER MARKET, BY END USER, 2022-2032 ($BILLION)
- TABLE 05. CAR CARRIER MARKET FOR AUTOMOTIVE SALES SERVICE SHOP 4S, BY REGION, 2022-2032 ($BILLION)
- TABLE 06. CAR CARRIER MARKET FOR TERMINALS, BY REGION, 2022-2032 ($BILLION)
- TABLE 07. CAR CARRIER MARKET FOR OTHERS, BY REGION, 2022-2032 ($BILLION)
- TABLE 08. CAR CARRIER MARKET, BY REGION, 2022-2032 ($BILLION)
- TABLE 09. NORTH AMERICA CAR CARRIER MARKET, BY TYPE, 2022-2032 ($BILLION)
- TABLE 10. NORTH AMERICA CAR CARRIER MARKET, BY END USER, 2022-2032 ($BILLION)
- TABLE 11. NORTH AMERICA CAR CARRIER MARKET, BY COUNTRY, 2022-2032 ($BILLION)
- TABLE 12. U.S. CAR CARRIER MARKET, BY TYPE, 2022-2032 ($BILLION)
- TABLE 13. U.S. CAR CARRIER MARKET, BY END USER, 2022-2032 ($BILLION)
- TABLE 14. CANADA CAR CARRIER MARKET, BY TYPE, 2022-2032 ($BILLION)
- TABLE 15. CANADA CAR CARRIER MARKET, BY END USER, 2022-2032 ($BILLION)
- TABLE 16. MEXICO CAR CARRIER MARKET, BY TYPE, 2022-2032 ($BILLION)
- TABLE 17. MEXICO CAR CARRIER MARKET, BY END USER, 2022-2032 ($BILLION)
- TABLE 18. EUROPE CAR CARRIER MARKET, BY TYPE, 2022-2032 ($BILLION)
- TABLE 19. EUROPE CAR CARRIER MARKET, BY END USER, 2022-2032 ($BILLION)
- TABLE 20. EUROPE CAR CARRIER MARKET, BY COUNTRY, 2022-2032 ($BILLION)
- TABLE 21. UK CAR CARRIER MARKET, BY TYPE, 2022-2032 ($BILLION)
- TABLE 22. UK CAR CARRIER MARKET, BY END USER, 2022-2032 ($BILLION)
- TABLE 23. GERMANY CAR CARRIER MARKET, BY TYPE, 2022-2032 ($BILLION)
- TABLE 24. GERMANY CAR CARRIER MARKET, BY END USER, 2022-2032 ($BILLION)
- TABLE 25. FRANCE CAR CARRIER MARKET, BY TYPE, 2022-2032 ($BILLION)
- TABLE 26. FRANCE CAR CARRIER MARKET, BY END USER, 2022-2032 ($BILLION)
- TABLE 27. ITALY CAR CARRIER MARKET, BY TYPE, 2022-2032 ($BILLION)
- TABLE 28. ITALY CAR CARRIER MARKET, BY END USER, 2022-2032 ($BILLION)
- TABLE 29. SPAIN CAR CARRIER MARKET, BY TYPE, 2022-2032 ($BILLION)
- TABLE 30. SPAIN CAR CARRIER MARKET, BY END USER, 2022-2032 ($BILLION)
- TABLE 31. REST OF EUROPE CAR CARRIER MARKET, BY TYPE, 2022-2032 ($BILLION)
- TABLE 32. REST OF EUROPE CAR CARRIER MARKET, BY END USER, 2022-2032 ($BILLION)
- TABLE 33. ASIA-PACIFIC CAR CARRIER MARKET, BY TYPE, 2022-2032 ($BILLION)
- TABLE 34. ASIA-PACIFIC CAR CARRIER MARKET, BY END USER, 2022-2032 ($BILLION)
- TABLE 35. ASIA-PACIFIC CAR CARRIER MARKET, BY COUNTRY, 2022-2032 ($BILLION)
- TABLE 36. CHINA CAR CARRIER MARKET, BY TYPE, 2022-2032 ($BILLION)
- TABLE 37. CHINA CAR CARRIER MARKET, BY END USER, 2022-2032 ($BILLION)
- TABLE 38. INDIA CAR CARRIER MARKET, BY TYPE, 2022-2032 ($BILLION)
- TABLE 39. INDIA CAR CARRIER MARKET, BY END USER, 2022-2032 ($BILLION)
- TABLE 40. JAPAN CAR CARRIER MARKET, BY TYPE, 2022-2032 ($BILLION)
- TABLE 41. JAPAN CAR CARRIER MARKET, BY END USER, 2022-2032 ($BILLION)
- TABLE 42. SOUTH KOREA CAR CARRIER MARKET, BY TYPE, 2022-2032 ($BILLION)
- TABLE 43. SOUTH KOREA CAR CARRIER MARKET, BY END USER, 2022-2032 ($BILLION)
- TABLE 44. AUSTRALIA CAR CARRIER MARKET, BY TYPE, 2022-2032 ($BILLION)
- TABLE 45. AUSTRALIA CAR CARRIER MARKET, BY END USER, 2022-2032 ($BILLION)
- TABLE 46. REST OF ASIA-PACIFIC CAR CARRIER MARKET, BY TYPE, 2022-2032 ($BILLION)
- TABLE 47. REST OF ASIA-PACIFIC CAR CARRIER MARKET, BY END USER, 2022-2032 ($BILLION)
- TABLE 48. LATIN AMERICA CAR CARRIER MARKET, BY TYPE, 2022-2032 ($BILLION)
- TABLE 49. LATIN AMERICA CAR CARRIER MARKET, BY END USER, 2022-2032 ($BILLION)
- TABLE 50. LATIN AMERICA CAR CARRIER MARKET, BY COUNTRY, 2022-2032 ($BILLION)
- TABLE 51. BRAZIL CAR CARRIER MARKET, BY TYPE, 2022-2032 ($BILLION)
- TABLE 52. BRAZIL CAR CARRIER MARKET, BY END USER, 2022-2032 ($BILLION)
- TABLE 53. ARGENTINA CAR CARRIER MARKET, BY TYPE, 2022-2032 ($BILLION)
- TABLE 54. ARGENTINA CAR CARRIER MARKET, BY END USER, 2022-2032 ($BILLION)
- TABLE 55. REST OF LATIN AMERICA CAR CARRIER MARKET, BY TYPE, 2022-2032 ($BILLION)
- TABLE 56. REST OF LATIN AMERICA CAR CARRIER MARKET, BY END USER, 2022-2032 ($BILLION)
- TABLE 57. MIDDLE EAST AND AFRICA CAR CARRIER MARKET, BY TYPE, 2022-2032 ($BILLION)
- TABLE 58. MIDDLE EAST AND AFRICA CAR CARRIER MARKET, BY END USER, 2022-2032 ($BILLION)
- TABLE 59. MIDDLE EAST AND AFRICA CAR CARRIER MARKET, BY COUNTRY, 2022-2032 ($BILLION)
- TABLE 60. GCC COUNTRIES CAR CARRIER MARKET, BY TYPE, 2022-2032 ($BILLION)
- TABLE 61. GCC COUNTRIES CAR CARRIER MARKET, BY END USER, 2022-2032 ($BILLION)
- TABLE 62. SOUTH AFRICA CAR CARRIER MARKET, BY TYPE, 2022-2032 ($BILLION)
- TABLE 63. SOUTH AFRICA CAR CARRIER MARKET, BY END USER, 2022-2032 ($BILLION)
- TABLE 64. REST OF MIDDLE EAST AND AFRICA CAR CARRIER MARKET, BY TYPE, 2022-2032 ($BILLION)
- TABLE 65. REST OF MIDDLE EAST AND AFRICA CAR CARRIER MARKET, BY END USER, 2022-2032 ($BILLION)
- TABLE 66. MILLER INDUSTRIES, INC: KEY EXECUTIVES
- TABLE 67. MILLER INDUSTRIES, INC: COMPANY SNAPSHOT
- TABLE 68. MILLER INDUSTRIES, INC: PRODUCT SEGMENTS
- TABLE 69. MILLER INDUSTRIES, INC: SERVICE SEGMENTS
- TABLE 70. MILLER INDUSTRIES, INC: PRODUCT PORTFOLIO
- TABLE 71. MILLER INDUSTRIES, INC: KEY STRATEGIES
- TABLE 72. LANDOLL COMPANY, LLC: KEY EXECUTIVES
- TABLE 73. LANDOLL COMPANY, LLC: COMPANY SNAPSHOT
- TABLE 74. LANDOLL COMPANY, LLC: PRODUCT SEGMENTS
- TABLE 75. LANDOLL COMPANY, LLC: SERVICE SEGMENTS
- TABLE 76. LANDOLL COMPANY, LLC: PRODUCT PORTFOLIO
- TABLE 77. LANDOLL COMPANY, LLC: KEY STRATEGIES
- TABLE 78. KENTUCKY TRAILERS: KEY EXECUTIVES
- TABLE 79. KENTUCKY TRAILERS: COMPANY SNAPSHOT
- TABLE 80. KENTUCKY TRAILERS: PRODUCT SEGMENTS
- TABLE 81. KENTUCKY TRAILERS: SERVICE SEGMENTS
- TABLE 82. KENTUCKY TRAILERS: PRODUCT PORTFOLIO
- TABLE 83. KENTUCKY TRAILERS: KEY STRATEGIES
- TABLE 84. DELAVAN: KEY EXECUTIVES
- TABLE 85. DELAVAN: COMPANY SNAPSHOT
- TABLE 86. DELAVAN: PRODUCT SEGMENTS
- TABLE 87. DELAVAN: SERVICE SEGMENTS
- TABLE 88. DELAVAN: PRODUCT PORTFOLIO
- TABLE 89. DELAVAN: KEY STRATEGIES
- TABLE 90. TECEQUIPMENT.: KEY EXECUTIVES
- TABLE 91. TECEQUIPMENT.: COMPANY SNAPSHOT
- TABLE 92. TECEQUIPMENT.: PRODUCT SEGMENTS
- TABLE 93. TECEQUIPMENT.: SERVICE SEGMENTS
- TABLE 94. TECEQUIPMENT.: PRODUCT PORTFOLIO
- TABLE 95. TECEQUIPMENT.: KEY STRATEGIES
- TABLE 96. BOYDSTUN: KEY EXECUTIVES
- TABLE 97. BOYDSTUN: COMPANY SNAPSHOT
- TABLE 98. BOYDSTUN: PRODUCT SEGMENTS
- TABLE 99. BOYDSTUN: SERVICE SEGMENTS
- TABLE 100. BOYDSTUN: PRODUCT PORTFOLIO
- TABLE 101. BOYDSTUN: KEY STRATEGIES
- TABLE 102. WALLY-MO INC: KEY EXECUTIVES
- TABLE 103. WALLY-MO INC: COMPANY SNAPSHOT
- TABLE 104. WALLY-MO INC: PRODUCT SEGMENTS
- TABLE 105. WALLY-MO INC: SERVICE SEGMENTS
- TABLE 106. WALLY-MO INC: PRODUCT PORTFOLIO
- TABLE 107. WALLY-MO INC: KEY STRATEGIES
- TABLE 108. INFINITY TRAILERS: KEY EXECUTIVES
- TABLE 109. INFINITY TRAILERS: COMPANY SNAPSHOT
- TABLE 110. INFINITY TRAILERS: PRODUCT SEGMENTS
- TABLE 111. INFINITY TRAILERS: SERVICE SEGMENTS
- TABLE 112. INFINITY TRAILERS: PRODUCT PORTFOLIO
- TABLE 113. INFINITY TRAILERS: KEY STRATEGIES
- TABLE 114. DONGFENG MOTOR COMPANY: KEY EXECUTIVES
- TABLE 115. DONGFENG MOTOR COMPANY: COMPANY SNAPSHOT
- TABLE 116. DONGFENG MOTOR COMPANY: PRODUCT SEGMENTS
- TABLE 117. DONGFENG MOTOR COMPANY: SERVICE SEGMENTS
- TABLE 118. DONGFENG MOTOR COMPANY: PRODUCT PORTFOLIO
- TABLE 119. DONGFENG MOTOR COMPANY: KEY STRATEGIES
- TABLE 120. COTTRELL TRAILERS: KEY EXECUTIVES
- TABLE 121. COTTRELL TRAILERS: COMPANY SNAPSHOT
- TABLE 122. COTTRELL TRAILERS: PRODUCT SEGMENTS
- TABLE 123. COTTRELL TRAILERS: SERVICE SEGMENTS
- TABLE 124. COTTRELL TRAILERS: PRODUCT PORTFOLIO
- TABLE 125. COTTRELL TRAILERS: KEY STRATEGIES
LIST OF FIGURES
- FIGURE 01. CAR CARRIER MARKET, 2022-2032
- FIGURE 02. SEGMENTATION OF CAR CARRIER MARKET,2022-2032
- FIGURE 03. TOP IMPACTING FACTORS IN CAR CARRIER MARKET
- FIGURE 04. TOP INVESTMENT POCKETS IN CAR CARRIER MARKET (2023-2032)
- FIGURE 05. BARGAINING POWER OF SUPPLIERS
- FIGURE 06. BARGAINING POWER OF BUYERS
- FIGURE 07. THREAT OF SUBSTITUTION
- FIGURE 08. THREAT OF SUBSTITUTION
- FIGURE 09. COMPETITIVE RIVALRY
- FIGURE 10. GLOBAL CAR CARRIER MARKET:DRIVERS, RESTRAINTS AND OPPORTUNITIES
- FIGURE 11. CAR CARRIER MARKET, BY TYPE, 2022 AND 2032(%)
- FIGURE 12. COMPARATIVE SHARE ANALYSIS OF CAR CARRIER MARKET FOR OPEN-AIR CAR CARRIER, BY COUNTRY 2022 AND 2032(%)
- FIGURE 13. COMPARATIVE SHARE ANALYSIS OF CAR CARRIER MARKET FOR ENCLOSED CAR CARRIER, BY COUNTRY 2022 AND 2032(%)
- FIGURE 14. CAR CARRIER MARKET, BY END USER, 2022 AND 2032(%)
- FIGURE 15. COMPARATIVE SHARE ANALYSIS OF CAR CARRIER MARKET FOR AUTOMOTIVE SALES SERVICE SHOP 4S, BY COUNTRY 2022 AND 2032(%)
- FIGURE 16. COMPARATIVE SHARE ANALYSIS OF CAR CARRIER MARKET FOR TERMINALS, BY COUNTRY 2022 AND 2032(%)
- FIGURE 17. COMPARATIVE SHARE ANALYSIS OF CAR CARRIER MARKET FOR OTHERS, BY COUNTRY 2022 AND 2032(%)
- FIGURE 18. CAR CARRIER MARKET BY REGION, 2022 AND 2032(%)
- FIGURE 19. U.S. CAR CARRIER MARKET, 2022-2032 ($BILLION)
- FIGURE 20. CANADA CAR CARRIER MARKET, 2022-2032 ($BILLION)
- FIGURE 21. MEXICO CAR CARRIER MARKET, 2022-2032 ($BILLION)
- FIGURE 22. UK CAR CARRIER MARKET, 2022-2032 ($BILLION)
- FIGURE 23. GERMANY CAR CARRIER MARKET, 2022-2032 ($BILLION)
- FIGURE 24. FRANCE CAR CARRIER MARKET, 2022-2032 ($BILLION)
- FIGURE 25. ITALY CAR CARRIER MARKET, 2022-2032 ($BILLION)
- FIGURE 26. SPAIN CAR CARRIER MARKET, 2022-2032 ($BILLION)
- FIGURE 27. REST OF EUROPE CAR CARRIER MARKET, 2022-2032 ($BILLION)
- FIGURE 28. CHINA CAR CARRIER MARKET, 2022-2032 ($BILLION)
- FIGURE 29. INDIA CAR CARRIER MARKET, 2022-2032 ($BILLION)
- FIGURE 30. JAPAN CAR CARRIER MARKET, 2022-2032 ($BILLION)
- FIGURE 31. SOUTH KOREA CAR CARRIER MARKET, 2022-2032 ($BILLION)
- FIGURE 32. AUSTRALIA CAR CARRIER MARKET, 2022-2032 ($BILLION)
- FIGURE 33. REST OF ASIA-PACIFIC CAR CARRIER MARKET, 2022-2032 ($BILLION)
- FIGURE 34. BRAZIL CAR CARRIER MARKET, 2022-2032 ($BILLION)
- FIGURE 35. ARGENTINA CAR CARRIER MARKET, 2022-2032 ($BILLION)
- FIGURE 36. REST OF LATIN AMERICA CAR CARRIER MARKET, 2022-2032 ($BILLION)
- FIGURE 37. GCC COUNTRIES CAR CARRIER MARKET, 2022-2032 ($BILLION)
- FIGURE 38. SOUTH AFRICA CAR CARRIER MARKET, 2022-2032 ($BILLION)
- FIGURE 39. REST OF MIDDLE EAST AND AFRICA CAR CARRIER MARKET, 2022-2032 ($BILLION)
- FIGURE 40. TOP WINNING STRATEGIES, BY YEAR
- FIGURE 41. TOP WINNING STRATEGIES, BY DEVELOPMENT
- FIGURE 42. TOP WINNING STRATEGIES, BY COMPANY
- FIGURE 43. PRODUCT MAPPING OF TOP 10 PLAYERS
- FIGURE 44. COMPETITIVE DASHBOARD
- FIGURE 45. COMPETITIVE HEATMAP: CAR CARRIER MARKET
- FIGURE 46. TOP PLAYER POSITIONING, 2022
 2024年汽車裝運船隻全球市場報告
 全球汽車架市場
 全球汽車裝運船隻市場:規模、佔有率、趨勢分析報告(按類型、最終用戶、區域展望和預測,2024-2031)
 全球汽車自行車架市場 2024-2028
 2024-2028年全球汽車架市場
 汽車架市場:按車型、類型和地區分類
 自行車運輸市場:按類型、數量、分銷管道分類 - 2024-2030 年全球預測
 汽車架 - 市場佔有率分析、產業趨勢與統計、成長預測(2024 - 2029)
 2024 年卡車貨架世界市場報告
 汽車車頂架市場-全球產業規模、佔有率、趨勢、機會和預測,按產品類型(高架導軌、車頂安裝、天溝)、按車輛類型(乘用車、商用車)、按地區、競爭細分,2018- 2028年