


 |
市場調查報告書
商品編碼
1641813
全球智慧電錶市場(按相位類型和最終用途行業)- 機會分析和行業預測,2024 年至 2033 年Smart Electricity Meter Market By Phase Type (Single Phase, Three Phase) , By End-Use Industry (Residential, Commercial, Industrial) : Global Opportunity Analysis and Industry Forecast, 2024-2033 |
||||||
智慧電錶市場
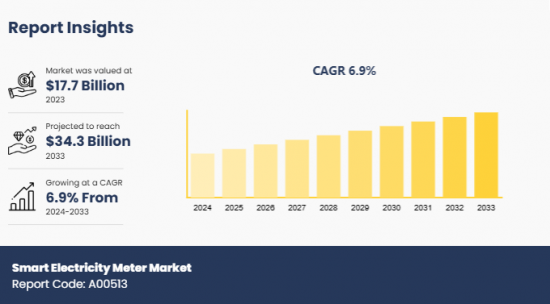
智慧電錶市場規模預計在 2023 年達到 177 億美元,到 2033 年將達到 343 億美元,2024 年至 2033 年的複合年成長率為 6.9%。
智慧電錶以數位方式即時測量和記錄住宅和商業空間的電力消耗,提供全面的消費模式見解,幫助消費者最佳化使用並減少電費。智慧電錶的主要功能包括遠端雙向通訊、自動收費、整合到智慧家庭系統和先進的安全通訊協定。
人們對電力消耗不斷成長的擔憂日益加劇,這刺激了智慧電錶的採用,因為它們能夠透過即時監控來提高能源效率。此外,物聯網設備的日益使用使得對電力消耗進行管理的需求成為必要,這反過來又推動了智慧電錶的採用,有助於市場的發展。預計未來幾年會流行的一個新興趨勢是將人工智慧功能整合到儀表中,以透過預測性維護來增強公共產業營運。此外,人工智慧將實現智慧電錶與區塊鏈技術的結合,以防止能源盜竊。
然而,智慧電錶相對於傳統電錶的成本較高,使得一些精打細算的消費者和組織對於投資智慧電錶猶豫不決,阻礙了市場的發展。此外,將先進的智慧電錶與現有基礎設施同步在技術上很複雜,需要大量專業知識。缺乏熟練的技術人員和不當實施的可能性嚴重限制了智慧電錶市場的成長。相反,擴大使用再生能源來源來滿足能源需求預計將為智慧電錶市場帶來豐厚的機會。這是因為智慧電錶對於管理和分配太陽能板和風力發電機產生的剩餘能源至關重要。根據國際能源總署 (IEA) 的數據,到 2030 年,電力、暖氣和運輸領域的可再生能源消耗預計將增加 60%。這表明在不久的將來對智慧電錶的需求可能會增加。
部分回顧
智慧電錶市場根據相類型、最終使用產業和地區進行細分。根據相位類型,市場分為單相和三相。根據最終用途產業,它們被分為住宅、商業用和工業。按地區分析,涵蓋北美、歐洲、亞太、拉丁美洲以及中東和非洲。
主要發現
根據相類型,預計單相部分將在預測期內佔據市場主導地位。
根據終端使用產業,預計住宅領域將在 2024 年至 2033 年間佔據相當大的佔有率。
按地區分類,預計到 2033 年北美將創造最高收益。
此報告可進行客製化(可能需要支付額外費用和製定時間表)
- 生產能力
- 產品生命週期
- 新進者(按地區)
- 科技趨勢分析
- 打入市場策略
- 按產品/細分市場進行市場細分
- 主要參與者的新產品開發/產品矩陣
- 監管指南
- 根據客戶興趣客製的其他公司簡介
- 擴展公司簡介列表
- 歷史市場資料
- Excel 格式的主要企業詳細資料(包括位置、聯絡資訊、供應商/供應商網路等)
- SWOT 分析
目錄
第 1 章 簡介
第 2 章執行摘要
第3章 市場狀況
- 市場定義和範圍
- 主要發現
- 重大投資機會
- 關鍵成功策略
- 波特五力分析
- 市場動態
- 驅動程式
- 限制因素
- 機會
第電錶章。
- 市場概況
- 單相
- 三相
第電錶章。
- 市場概況
- 住宅
- 商業的
- 工業的
第6章 智慧電錶市場(按區域)
- 市場概況
- 北美洲
- 主要市場趨勢和機遇
- 美國智慧電錶市場
- 加拿大智慧電錶市場
- 墨西哥智慧電錶市場
- 歐洲
- 主要市場趨勢和機遇
- 法國智慧電錶市場
- 德國智慧電錶市場
- 義大利智慧電錶市場
- 西班牙智慧電錶市場
- 英國智慧電錶市場
- 其他歐洲國家智慧電錶市場
- 亞太地區
- 主要市場趨勢和機遇
- 中國智慧電錶市場
- 日本智慧電錶市場
- 印度智慧電錶市場
- 韓國智慧電錶市場
- 澳洲智慧電錶市場
- 亞太地區其他智慧電錶市場
- 拉丁美洲、中東和非洲
- 主要市場趨勢和機遇
- 巴西智慧電錶市場
- 南非智慧電錶市場
- 沙烏地阿拉伯的智慧電錶市場
- 拉丁美洲其他地區、中東和非洲智慧電錶市場
第7章 競爭格局
- 介紹
- 關鍵成功策略
- 前 10 家公司的產品映射
- 競爭儀錶板
- 競爭熱圖
- 2023年主要企業的定位
第8章 公司簡介
- Itron Inc
- Xylem Inc.
- Schneider Electric
- Siemens
- Honeywell International Inc
- Hubbell
- Tantalus Systems
- Jiangsu Linyang Energy Co
- Apator SA
Smart Electricity Meter Market
The smart electricity meter market was valued at $17.7 billion in 2023 and is projected to reach $34.3 billion by 2033, growing at a CAGR of 6.9% from 2024 to 2033.
A smart electricity meter digitally measures & records the consumption of electricity in residential and commercial spaces in real time, offering comprehensive insights into consumption patterns and helping consumers to optimize their usage & reduce billing. The key features of smart electricity meters include remote two-way communication, automated billing, integration into smart home systems, and advanced security protocols.
Increase in concerns regarding upsurging electricity consumption has fueled the adoption of smart meters owing to their ability to facilitate energy efficiency through real-time monitoring. Furthermore, rise in the usage of the Internet of Things devices has necessitated the management of electricity consumption, which boosts the usage of smart meters and propels the development of the market. An emerging trend poised to acquire traction in the coming years is the integration of AI capabilities into the meter to enhance utility operations through predictive maintenance. Moreover, AI enables the integration of smart meters with blockchain technology to prevent energy theft.
However, the higher cost of smart electricity meters as compared to the conventional ones deters several budget-sensitive consumers and organizations from investing in them, thereby hampering the development of the market. In addition, synchronizing the advanced smart meters with the existing infrastructure requires significant expertise owing to the technical complexities. Due to lack of skilled technicians and probability of improper implementation the growth of the smart electricity meter market is restrained notably. Contrarily, rise in the usage of renewable sources to meet the energy requirements is projected to present remunerative opportunities for the smart electricity meter market. This is attributed to the essentiality of smart meters for the management and distribution of excess energy generated by solar panels or wind turbines. According to the International Energy Agency, the consumption of renewable energy in the power, heat, and transport sectors is projected to increase by 60% by 2030. This indicates the potential increase in demand for smart meters in the near future.
Segment Review
The smart electricity meter market is segmented into phase type, end-use industry, and region. On the basis of phase type, the market is bifurcated into single phase and three phase. Depending on end-use industry, it is categorized into residential, commercial, and industrial. Region wise, it is analyzed across North America, Europe, Asia-Pacific, and LAMEA.
Key Findings
On the basis of phase type, the single phase segment is expected to dominate the market during the forecast period.
Depending on end-use industry, the residential segment is projected to acquire a notable stake from 2024 to 2033.
Region wise, North America is anticipated to be the highest revenue generator by 2033.
Competition Analysis
The leading players operating in the global smart electricity meter market include Itron Inc., Xylem Inc., Schneider Electric, Siemens, Honeywell International Inc., Hubbell, Tantalus Systems, Jiangsu Linyang Energy Co., and Apator S.A. These major players have adopted various key development strategies such as business expansion, new product launches, and partnerships to strengthen their foothold in the competitive market.
Additional benefits you will get with this purchase are:
- Quarterly Update and* (only available with a corporate license, on listed price)
- 5 additional Company Profile of client Choice pre- or Post-purchase, as a free update.
- Free Upcoming Version on the Purchase of Five and Enterprise User License.
- 16 analyst hours of support* (post-purchase, if you find additional data requirements upon review of the report, you may receive support amounting to 16 analyst hours to solve questions, and post-sale queries)
- 15% Free Customization* (in case the scope or segment of the report does not match your requirements, 15% is equivalent to 3 working days of free work, applicable once)
- Free data Pack on the Five and Enterprise User License. (Excel version of the report)
- Free Updated report if the report is 6-12 months old or older.
- 24-hour priority response*
- Free Industry updates and white papers.
Possible Customization with this report (with additional cost and timeline, please talk to the sales executive to know more)
- Manufacturing Capacity
- Product Life Cycles
- Upcoming/New Entrant by Regions
- Technology Trend Analysis
- Go To Market Strategy
- Market share analysis of players by products/segments
- New Product Development/ Product Matrix of Key Players
- Regulatory Guidelines
- Additional company profiles with specific to client's interest
- Expanded list for Company Profiles
- Historic market data
- Key player details (including location, contact details, supplier/vendor network etc. in excel format)
- SWOT Analysis
Key Market Segments
By Phase Type
- Single Phase
- Three Phase
By End-Use Industry
- Residential
- Commercial
- Industrial
By Region
- North America
- U.S.
- Canada
- Mexico
- Europe
- France
- Germany
- Italy
- Spain
- UK
- Rest of Europe
- Asia-Pacific
- China
- Japan
- India
- South Korea
- Australia
- Rest of Asia-Pacific
- LAMEA
- Brazil
- South Africa
- Saudi Arabia
- Rest of LAMEA
Key Market Players:
- Itron Inc
- Xylem Inc.
- Schneider Electric
- Siemens
- Honeywell International Inc
- Hubbell
- Tantalus Systems
- Jiangsu Linyang Energy Co
- Apator S.A
TABLE OF CONTENTS
CHAPTER 1: INTRODUCTION
- 1.1. Report Description
- 1.2. Key Market Segments
- 1.3. Key Benefits
- 1.4. Research Methodology
- 1.4.1. Primary Research
- 1.4.2. Secondary Research
- 1.4.3. Analyst Tools and Models
CHAPTER 2: EXECUTIVE SUMMARY
- 2.1. CXO Perspective
CHAPTER 3: MARKET LANDSCAPE
- 3.1. Market Definition and Scope
- 3.2. Key Findings
- 3.2.1. Top Investment Pockets
- 3.2.2. Top Winning Strategies
- 3.3. Porter's Five Forces Analysis
- 3.3.1. Bargaining Power of Suppliers
- 3.3.2. Threat of New Entrants
- 3.3.3. Threat of Substitutes
- 3.3.4. Competitive Rivalry
- 3.3.5. Bargaining Power among Buyers
- 3.4. Market Dynamics
- 3.4.1. Drivers
- 3.4.2. Restraints
- 3.4.3. Opportunities
CHAPTER 4: SMART ELECTRICITY METER MARKET, BY PHASE TYPE
- 4.1. Market Overview
- 4.1.1 Market Size and Forecast, By Phase Type
- 4.2. Single Phase
- 4.2.1. Key Market Trends, Growth Factors and Opportunities
- 4.2.2. Market Size and Forecast, By Region
- 4.2.3. Market Share Analysis, By Country
- 4.3. Three Phase
- 4.3.1. Key Market Trends, Growth Factors and Opportunities
- 4.3.2. Market Size and Forecast, By Region
- 4.3.3. Market Share Analysis, By Country
CHAPTER 5: SMART ELECTRICITY METER MARKET, BY END-USE INDUSTRY
- 5.1. Market Overview
- 5.1.1 Market Size and Forecast, By End-use Industry
- 5.2. Residential
- 5.2.1. Key Market Trends, Growth Factors and Opportunities
- 5.2.2. Market Size and Forecast, By Region
- 5.2.3. Market Share Analysis, By Country
- 5.3. Commercial
- 5.3.1. Key Market Trends, Growth Factors and Opportunities
- 5.3.2. Market Size and Forecast, By Region
- 5.3.3. Market Share Analysis, By Country
- 5.4. Industrial
- 5.4.1. Key Market Trends, Growth Factors and Opportunities
- 5.4.2. Market Size and Forecast, By Region
- 5.4.3. Market Share Analysis, By Country
CHAPTER 6: SMART ELECTRICITY METER MARKET, BY REGION
- 6.1. Market Overview
- 6.1.1 Market Size and Forecast, By Region
- 6.2. North America
- 6.2.1. Key Market Trends and Opportunities
- 6.2.2. Market Size and Forecast, By Phase Type
- 6.2.3. Market Size and Forecast, By End-use Industry
- 6.2.4. Market Size and Forecast, By Country
- 6.2.5. U.S. Smart Electricity Meter Market
- 6.2.5.1. Market Size and Forecast, By Phase Type
- 6.2.5.2. Market Size and Forecast, By End-use Industry
- 6.2.6. Canada Smart Electricity Meter Market
- 6.2.6.1. Market Size and Forecast, By Phase Type
- 6.2.6.2. Market Size and Forecast, By End-use Industry
- 6.2.7. Mexico Smart Electricity Meter Market
- 6.2.7.1. Market Size and Forecast, By Phase Type
- 6.2.7.2. Market Size and Forecast, By End-use Industry
- 6.3. Europe
- 6.3.1. Key Market Trends and Opportunities
- 6.3.2. Market Size and Forecast, By Phase Type
- 6.3.3. Market Size and Forecast, By End-use Industry
- 6.3.4. Market Size and Forecast, By Country
- 6.3.5. France Smart Electricity Meter Market
- 6.3.5.1. Market Size and Forecast, By Phase Type
- 6.3.5.2. Market Size and Forecast, By End-use Industry
- 6.3.6. Germany Smart Electricity Meter Market
- 6.3.6.1. Market Size and Forecast, By Phase Type
- 6.3.6.2. Market Size and Forecast, By End-use Industry
- 6.3.7. Italy Smart Electricity Meter Market
- 6.3.7.1. Market Size and Forecast, By Phase Type
- 6.3.7.2. Market Size and Forecast, By End-use Industry
- 6.3.8. Spain Smart Electricity Meter Market
- 6.3.8.1. Market Size and Forecast, By Phase Type
- 6.3.8.2. Market Size and Forecast, By End-use Industry
- 6.3.9. UK Smart Electricity Meter Market
- 6.3.9.1. Market Size and Forecast, By Phase Type
- 6.3.9.2. Market Size and Forecast, By End-use Industry
- 6.3.10. Rest Of Europe Smart Electricity Meter Market
- 6.3.10.1. Market Size and Forecast, By Phase Type
- 6.3.10.2. Market Size and Forecast, By End-use Industry
- 6.4. Asia-Pacific
- 6.4.1. Key Market Trends and Opportunities
- 6.4.2. Market Size and Forecast, By Phase Type
- 6.4.3. Market Size and Forecast, By End-use Industry
- 6.4.4. Market Size and Forecast, By Country
- 6.4.5. China Smart Electricity Meter Market
- 6.4.5.1. Market Size and Forecast, By Phase Type
- 6.4.5.2. Market Size and Forecast, By End-use Industry
- 6.4.6. Japan Smart Electricity Meter Market
- 6.4.6.1. Market Size and Forecast, By Phase Type
- 6.4.6.2. Market Size and Forecast, By End-use Industry
- 6.4.7. India Smart Electricity Meter Market
- 6.4.7.1. Market Size and Forecast, By Phase Type
- 6.4.7.2. Market Size and Forecast, By End-use Industry
- 6.4.8. South Korea Smart Electricity Meter Market
- 6.4.8.1. Market Size and Forecast, By Phase Type
- 6.4.8.2. Market Size and Forecast, By End-use Industry
- 6.4.9. Australia Smart Electricity Meter Market
- 6.4.9.1. Market Size and Forecast, By Phase Type
- 6.4.9.2. Market Size and Forecast, By End-use Industry
- 6.4.10. Rest of Asia-Pacific Smart Electricity Meter Market
- 6.4.10.1. Market Size and Forecast, By Phase Type
- 6.4.10.2. Market Size and Forecast, By End-use Industry
- 6.5. LAMEA
- 6.5.1. Key Market Trends and Opportunities
- 6.5.2. Market Size and Forecast, By Phase Type
- 6.5.3. Market Size and Forecast, By End-use Industry
- 6.5.4. Market Size and Forecast, By Country
- 6.5.5. Brazil Smart Electricity Meter Market
- 6.5.5.1. Market Size and Forecast, By Phase Type
- 6.5.5.2. Market Size and Forecast, By End-use Industry
- 6.5.6. South Africa Smart Electricity Meter Market
- 6.5.6.1. Market Size and Forecast, By Phase Type
- 6.5.6.2. Market Size and Forecast, By End-use Industry
- 6.5.7. Saudi Arabia Smart Electricity Meter Market
- 6.5.7.1. Market Size and Forecast, By Phase Type
- 6.5.7.2. Market Size and Forecast, By End-use Industry
- 6.5.8. Rest of LAMEA Smart Electricity Meter Market
- 6.5.8.1. Market Size and Forecast, By Phase Type
- 6.5.8.2. Market Size and Forecast, By End-use Industry
CHAPTER 7: COMPETITIVE LANDSCAPE
- 7.1. Introduction
- 7.2. Top Winning Strategies
- 7.3. Product Mapping Of Top 10 Player
- 7.4. Competitive Dashboard
- 7.5. Competitive Heatmap
- 7.6. Top Player Positioning, 2023
CHAPTER 8: COMPANY PROFILES
- 8.1. Itron Inc
- 8.1.1. Company Overview
- 8.1.2. Key Executives
- 8.1.3. Company Snapshot
- 8.1.4. Operating Business Segments
- 8.1.5. Product Portfolio
- 8.1.6. Business Performance
- 8.1.7. Key Strategic Moves and Developments
- 8.2. Xylem Inc.
- 8.2.1. Company Overview
- 8.2.2. Key Executives
- 8.2.3. Company Snapshot
- 8.2.4. Operating Business Segments
- 8.2.5. Product Portfolio
- 8.2.6. Business Performance
- 8.2.7. Key Strategic Moves and Developments
- 8.3. Schneider Electric
- 8.3.1. Company Overview
- 8.3.2. Key Executives
- 8.3.3. Company Snapshot
- 8.3.4. Operating Business Segments
- 8.3.5. Product Portfolio
- 8.3.6. Business Performance
- 8.3.7. Key Strategic Moves and Developments
- 8.4. Siemens
- 8.4.1. Company Overview
- 8.4.2. Key Executives
- 8.4.3. Company Snapshot
- 8.4.4. Operating Business Segments
- 8.4.5. Product Portfolio
- 8.4.6. Business Performance
- 8.4.7. Key Strategic Moves and Developments
- 8.5. Honeywell International Inc
- 8.5.1. Company Overview
- 8.5.2. Key Executives
- 8.5.3. Company Snapshot
- 8.5.4. Operating Business Segments
- 8.5.5. Product Portfolio
- 8.5.6. Business Performance
- 8.5.7. Key Strategic Moves and Developments
- 8.6. Hubbell
- 8.6.1. Company Overview
- 8.6.2. Key Executives
- 8.6.3. Company Snapshot
- 8.6.4. Operating Business Segments
- 8.6.5. Product Portfolio
- 8.6.6. Business Performance
- 8.6.7. Key Strategic Moves and Developments
- 8.7. Tantalus Systems
- 8.7.1. Company Overview
- 8.7.2. Key Executives
- 8.7.3. Company Snapshot
- 8.7.4. Operating Business Segments
- 8.7.5. Product Portfolio
- 8.7.6. Business Performance
- 8.7.7. Key Strategic Moves and Developments
- 8.8. Jiangsu Linyang Energy Co
- 8.8.1. Company Overview
- 8.8.2. Key Executives
- 8.8.3. Company Snapshot
- 8.8.4. Operating Business Segments
- 8.8.5. Product Portfolio
- 8.8.6. Business Performance
- 8.8.7. Key Strategic Moves and Developments
- 8.9. Apator S.A
- 8.9.1. Company Overview
- 8.9.2. Key Executives
- 8.9.3. Company Snapshot
- 8.9.4. Operating Business Segments
- 8.9.5. Product Portfolio
- 8.9.6. Business Performance
- 8.9.7. Key Strategic Moves and Developments
 商業智慧電錶市場-全球產業規模、佔有率、趨勢、機會與預測(按類型、按階段、按地區、按競爭細分,2020-2030 年)2025 年全球智慧電錶市場報告
 智慧電錶:市場佔有率分析、產業趨勢與統計、成長預測(2025-2030 年)
 智慧電錶市場規模、佔有率、成長分析、按類型、按技術、按組件、按最終用戶、按通訊、按地區 - 行業預測,2025-2032 年2024年三相智慧電錶全球市場報告
 AMR 智慧電錶市場機會、成長促進因素、產業趨勢分析與預測 2024 - 2032 年PLC 智慧電錶市場機會、成長促進因素、產業趨勢分析與預測 2024 - 2032 年
 智慧電錶市場:按階段、技術和最終用戶分類 - 2025-2030 年全球預測智慧電錶市場:按階段、通訊技術、最終用戶 - 全球預測 2025-2030商用射頻智慧電錶市場機會、成長動力、產業趨勢分析與預測 2024 - 2032