


 |
市場調查報告書
商品編碼
1645729
全球疏水交互作用層析法市場(按產品/服務、樣品類型、應用和最終用戶分類)- 機會分析和行業預測,2024 年至 2033 年Hydrophobic Interaction Chromatography Market By Product and Service, By Sample type, By Application, By End user : Global Opportunity Analysis and Industry Forecast, 2024-2033 |
||||||
疏水交互作用層析法市場
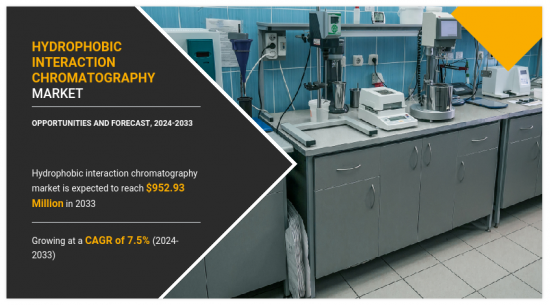
疏水交互作用層析法市場規模在 2023 年預計為 4.6189 億美元,預計到 2033 年將達到 9.5293 億美元,2024 年至 2033 年的複合年成長率為 7.5%。
疏水交互作用層析法(HIC) 是一種生物分子分離技術,可根據蛋白質和其他生物分子的疏水性將其區分。 HIC的運行原理是蛋白質在流動相離子強度的影響下可逆地與固定基質上的疏水基團結合。此技術可應用於生物技術和製藥行業中的抗體分離、蛋白質精製和疏水化合物的分離。
疏水交互作用層析法市場主要受到全球生物製藥行業擴張的推動,因為在藥物和疫苗開發過程中需要使用疏水性相互作用色譜。此外,政府和私人組織對生物技術和研究的投資不斷增加,推動了市場的成長。疏水交互作用層析法市場的一個顯著趨勢是在食品和營養保健品行業中使用 HIC。 HIC用於分離和精製蛋白質和胜肽,以改善其口感和營養價值。
然而,由於該技術無法擴大規模以滿足廣泛的精製要求,其市場發展受到阻礙。此外,HIC是一種相對耗時的技術,面臨著親和色譜和離子交換層析法等替代技術的激烈競爭。這降低了 HIC 的效用並嚴重抑制了市場成長。另一方面,生物創投公司的增加和投資的激增預計將為疏水交互作用層析法市場提供有利的成長機會。麥肯錫的資料顯示,針對生物新興企業的創業投資從 2016 年的 2,200 筆增加到了 2021 年的 3,100 筆。此外,2021 年初新興企業將在全球籌集超過 340 億美元的資金,是 2020 年 160 億美元總額的兩倍多。預計投資的激增將推動蛋白質和分子生物學相關研究的增加,從而增加對先進 HIC 設備的需求。
審查細分
疏水交互作用層析法市場細分為產品/服務、樣品類型、應用、最終用戶和地區。根據產品/服務,市場分為產品和服務。產品部分進一步分為樹脂、緩衝液、管柱和其他。樹脂部分又分為珠子和其他。管柱段又分為預裝管柱和空管柱。預填充管柱段進一步分為拋棄式或可重複使用。依樣本類型,市場分為單株抗體、疫苗、細胞培養樣本、血漿和血清樣本等。根據應用,分為蛋白質和抗體精製、疫苗開發、藥物發現以及食品和營養補充劑開發。蛋白質和抗體精製領域根據樹脂分為珠子和其他。就最終用戶而言,市場分為製藥和生物製藥公司、受託研究機構和契約製造組織、研究和學術機構等。根據地區,市場分析為北美(美國、加拿大、墨西哥)、歐洲(德國、法國、英國、義大利、西班牙和其他歐洲國家)、亞太地區(日本、中國、印度、澳洲、韓國和亞太其他地區)、拉丁美洲、中東和非洲(巴西、中國、印度、澳洲、韓國、拉丁美洲其他地區、中東和非洲)。
主要發現
根據產品/服務,該產品細分市場在 2023 年佔據了市場佔有率的主導地位。
從樣本類型來看,單株抗體領域佔比較大。
根據應用,蛋白質和抗體精製部分在 2023 年佔據最高的市場佔有率。
根據最終用戶,製藥和生物製藥公司在 2023 年佔據最高佔有率。
按地區分類,預計北美將在 2023 年創造最高收益。
相關人員的主要利益
該報告定量提供了 2023 年至 2033 年疏水交互作用層析法市場分析的市場細分、當前趨勢、估計和趨勢分析,並確定了主要的疏水交互作用層析法市場機會。
它為市場研究提供與市場促進因素、市場限制因素和市場機會相關的資訊。
波特五力分析揭示了買家和供應商的潛力,幫助相關人員做出利潤驅動的商業決策,並加強供應商-買家網路。
詳細分析疏水交互作用層析法市場細分有助於發現市場機會。
每個地區的主要國家都根據收益貢獻進行分類。
市場公司的定位有利於基準化分析,並能清楚了解市場公司的當前地位。
它包括區域和全球疏水交互作用層析法市場趨勢、主要企業、細分市場、應用領域和市場成長策略的分析。
此報告可進行客製化(需支付額外費用和時間表)
- 國家、地區和全球層面的患者/流行病學資料
- 監管指南
- 根據客戶興趣提供額外的公司簡介
- 按國家或地區進行的額外分析 - 市場規模和預測
- 擴展公司簡介列表
- 歷史市場資料
- SWOT 分析
目錄
第 1 章 簡介
第 2 章執行摘要
第3章 市場概況
- 市場定義和範圍
- 主要發現
- 關鍵影響因素
- 重大投資機會
- 波特五力分析
- 市場動態
- 驅動程式
- 生物製藥研發成本不斷增加
- 對生技藥品和單株抗體 (mAb) 的需求不斷增加
- 生物相似藥的採用日益增多
- 限制因素
- 熟練勞動力短缺
- 初期投資及營運成本高
- 機會
- 新興市場的成長機會
- 疏水交互作用層析法(HIC)技術進步
- 驅動程式
第 4 章疏水交互作用層析法市場(按產品和服務)
- 概述
- 產品
- 疏水交互作用層析法市場(按產品類型)
- 疏水交互作用層析法市場(按類型)
- 管柱疏水交互作用層析法市場(按類型)
- 預裝管柱疏水交互作用層析法市場(按類型)
- 疏水交互作用層析法市場(按產品類型)
- 服務
第 5 章疏水交互作用層析法市場(按樣品類型)
- 概述
- 單株抗體
- 疫苗
- 細胞培養樣本
- 血漿和血清樣本
- 其他
第6章疏疏水交互作用層析法市場(依應用)
- 概述
- 蛋白質和抗體精製
- 疏水性疏水交互作用層析法市場,用於樹脂精製蛋白質和抗體
- 疫苗研發
- 藥物研發
- 食品和營養補充品開發
第 7 章疏疏水交互作用層析法市場:按最終用戶
- 概述
- 製藥和生物製藥公司
- 受託研究機構/契約製造組織
- 研究和學術機構
- 其他
第 8 章疏水交互作用層析法市場(按區域)
- 概述
- 北美洲
- 美國
- 加拿大
- 墨西哥
- 歐洲
- 德國
- 法國
- 英國
- 義大利
- 西班牙
- 其他
- 亞太地區
- 日本
- 中國
- 印度
- 澳洲
- 韓國
- 其他
- 拉丁美洲、中東和非洲
- 巴西
- 南非
- 沙烏地阿拉伯
- 其他
第9章 競爭格局
- 介紹
- 關鍵成功策略
- 前 10 家公司的產品映射
- 競爭儀錶板
- 競爭熱圖
- 2023年主要企業的定位
第10章 公司簡介
- Bio-Rad Laboratories, Inc.
- Sartorius AG
- Thermo Fisher Scientific Inc.
- Tosoh Corporation
- Geno Technology, Inc.
- Danaher Corporation
- Sepax Technologies, Inc.
- Agilent Technologies, Inc.
- Merck KGaA
- Waters Corporation
- KNAUER Wissenschaftliche Gerate GmbH
Hydrophobic Interaction Chromatography Market
The hydrophobic interaction chromatography market was valued at $461.89 million in 2023 and is estimated to reach $952.93 million by 2033, exhibiting a CAGR of 7.5% from 2024 to 2033.
Hydrophobic interaction chromatography (HIC) is a biomolecular separation technique that differentiates proteins and other biomolecules depending on their hydrophobicity. The working principle of HIC involves the reversible binding of proteins to hydrophobic groups on a stationary phase, under the influence of ionic strength of a mobile phase. The technique finds application in antibody isolation, protein purification, and separation of hydrophobic compounds in biotechnological & pharmaceutical industries.
The expanding biopharmaceutical industry across the globe is a key driver of the hydrophobic interaction chromatography market as it utilizes HIC in the development process of medicines and vaccines. In addition, rise in investments in the biotechnology & research sector by governments and private organizations has propelled the growth of the market. A notable trend acquiring traction in the hydrophobic interaction chromatography market is the use of HIC in the food and dietary supplement industries. They utilize HIC to improve taste and nutritional value by the separation & purification of proteins and peptides.
However, the inability of the technique scale-up and cater to extensive purification requirements hampers the development of the market. Furthermore, HIC is a relatively time-consuming technique and faces stringent competition from alternatives such as affinity & ion-exchange chromatography. This reduces the utility of HIC and restrains the market growth significantly. On the contrary, increase in the number of biotech start-ups and surge in investments in them is expected to present lucrative growth opportunities for the hydrophobic interaction chromatography market. McKinsey data states that investments by venture capital firms increased from 2,200 biotech start-ups globally in 2,016 to 3,100 in 2021. Moreover, the start-ups collected more than $34 billion globally in 2021, which was more than double the 2020 total of $16 billion. This upsurge in investments is anticipated to increase protein- and molecular biology-related research, fueling the requirement for advanced HIC equipment.
Segment Review
The hydrophobic interaction chromatography market is segmented into product & service, sample type, application, end user, and region. By product & service, the market is bifurcated into product and service. The product segment is further categorized into resin, buffer, column, and others. The resin segment is further bifurcated into beads and others. The column segment is further divided into pre-packed columns and empty columns. The pre-packed column segment is further categorized into disposable and reusable. Depending on sample type, the market is segregated into monoclonal antibodies, vaccines, cell culture sample, plasma & serum sample, and others. As per application, it is classified into protein & antibody purification, vaccine development, drug discovery, and food & dietary supplement development. The protein & antibody purification segment is further categorized for resins into beads and others. According to end user, the market is categorized into pharmaceutical & biopharmaceutical companies, contract research organizations & contract manufacturing organizations, research & academic institutes, and others. Region wise, the market is analyzed across North America (U.S., Canada, and Mexico), Europe (Germany, France, the UK, Italy, Spain, and rest of Europe), Asia-Pacific (Japan, China, India, Australia, South Korea, and rest of Asia-Pacific), and LAMEA (Brazil, South Africa, Saudi Arabia, and rest of LAMEA).
Key Findings
By product & service, the product segment dominated the market share in 2023.
Depending on sample type, the monoclonal antibodies segment held a high share of the market.
As per application, the protein & antibody purification segment accounted for the highest market share in 2023.
According to end user, the pharmaceutical & biopharmaceutical companies segment was the highest shareholder in 2023.
Region wise, North America was the highest revenue generator in 2023.
Competition Analysis
The major players operating in the global hydrophobic interaction chromatography market are Bio-Rad Laboratories, Inc., Sartorius AG, Thermo Fisher Scientific Inc., Tosoh Corporation, Danaher Corporation, Sepax Technologies, Inc., Agilent Technologies, Inc., Merck KGaA, Waters Corporation, and KNAUER Wissenschaftliche Gerate GmbH. These major players have adopted integration, product launch, contract, partnership, and expansion as their key strategies to expand their product portfolio.
Key Benefits for Stakeholders
This report provides a quantitative analysis of the market segments, current trends, estimations, and dynamics of the hydrophobic interaction chromatography market analysis from 2023 to 2033 to identify the prevailing hydrophobic interaction chromatography market opportunities.
The market research is offered along with information related to key drivers, restraints, and opportunities.
Porter's five forces analysis highlights the potency of buyers and suppliers to enable stakeholders make profit-oriented business decisions and strengthen their supplier-buyer network.
In-depth analysis of the hydrophobic interaction chromatography market segmentation assists to determine the prevailing market opportunities.
Major countries in each region are mapped according to their revenue contribution to the global market.
Market player positioning facilitates benchmarking and provides a clear understanding of the present position of the market players.
The report includes the analysis of the regional as well as global hydrophobic interaction chromatography market trends, key players, market segments, application areas, and market growth strategies.
Additional benefits you will get with this purchase are:
- Quarterly Update and* (only available with a corporate license, on listed price)
- 5 additional Company Profile of client Choice pre- or Post-purchase, as a free update.
- Free Upcoming Version on the Purchase of Five and Enterprise User License.
- 16 analyst hours of support* (post-purchase, if you find additional data requirements upon review of the report, you may receive support amounting to 16 analyst hours to solve questions, and post-sale queries)
- 15% Free Customization* (in case the scope or segment of the report does not match your requirements, 15% is equivalent to 3 working days of free work, applicable once)
- Free data Pack on the Five and Enterprise User License. (Excel version of the report)
- Free Updated report if the report is 6-12 months old or older.
- 24-hour priority response*
- Free Industry updates and white papers.
Possible Customization with this report (with additional cost and timeline, please talk to the sales executive to know more)
- Patient/epidemiology data at country, region, global level
- Regulatory Guidelines
- Additional company profiles with specific to client's interest
- Additional country or region analysis- market size and forecast
- Expanded list for Company Profiles
- Historic market data
- SWOT Analysis
Key Market Segments
By Product and Service
- Product
- Type
- Resin
◦ Type
- Buffer
- Column
◦ Type
- Others
- Service
By Sample type
- Monoclonal antibodies
- Vaccines
- Cell culture sample
- Plasma and serum sample
- Others
By Application
- Protein and antibody purification
- Resins
- Beads
- Others
- Vaccine development
- Drug discovery
- Food and dietary supplement development
By End user
- Research and academic institutes
- Others
- Pharmaceutical and biopharmaceutical companies
- Contract research organizations and contract manufacturing organizations
By Region
- North America
- U.S.
- Canada
- Mexico
- Europe
- Germany
- France
- UK
- Italy
- Spain
- Rest of Europe
- Asia-Pacific
- Japan
- China
- India
- Australia
- South Korea
- Rest of Asia-Pacific
- LAMEA
- Brazil
- South Africa,
- Saudi Arabia
- Rest of LAMEA
Key Market Players:
- Sepax Technologies, Inc.
- Tosoh Corporation
- Agilent Technologies, Inc.
- Thermo Fisher Scientific Inc.
- Danaher Corporation
- Merck KGaA
- Geno Technology, Inc.
- Waters Corporation
- KNAUER Wissenschaftliche Gerate GmbH
- Bio-Rad Laboratories, Inc.
- Sartorius AG
TABLE OF CONTENTS
CHAPTER 1: INTRODUCTION
- 1.1. Report description
- 1.2. Key market segments
- 1.3. Key benefits to the stakeholders
- 1.4. Research methodology
- 1.4.1. Primary research
- 1.4.2. Secondary research
- 1.4.3. Analyst tools and models
CHAPTER 2: EXECUTIVE SUMMARY
- 2.1. CXO perspective
CHAPTER 3: MARKET OVERVIEW
- 3.1. Market definition and scope
- 3.2. Key findings
- 3.2.1. Top impacting factors
- 3.2.2. Top investment pockets
- 3.3. Porter's five forces analysis
- 3.3.1. Moderate intensity of rivalry
- 3.3.2. Moderate bargaining power of buyers
- 3.3.3. Moderate threat of new entrants
- 3.3.4. Moderate bargaining power of suppliers
- 3.3.5. Moderate threat of substitutes
- 3.4. Market dynamics
- 3.4.1. Drivers
- 3.4.1.1. Increase in R&D expenditure in biopharmaceuticals
- 3.4.1.2. Rise in demand for biologics and monoclonal antibodies (mAbs)
- 3.4.1.3. Rise in adoption of biosimilars
- 3.4.2. Restraints
- 3.4.2.1. Lack of a skilled workforce
- 3.4.2.2. High initial investment and operating costs
- 3.4.3. Opportunities
- 3.4.3.1. Growth opportunities in emerging markets
- 3.4.3.2. Technological advancements in hydrophobic interaction chromatography (HIC)
- 3.4.1. Drivers
CHAPTER 4: HYDROPHOBIC INTERACTION CHROMATOGRAPHY MARKET, BY PRODUCT AND SERVICE
- 4.1. Overview
- 4.1.1. Market size and forecast
- 4.2. Product
- 4.2.1. Key market trends, growth factors and opportunities
- 4.2.2. Market size and forecast, by region
- 4.2.3. Market share analysis by country
- 4.2.4. Product Hydrophobic Interaction Chromatography Market by Type
- 4.2.4.1. Resin Hydrophobic Interaction Chromatography Market by Type
- 4.2.4.2. Column Hydrophobic Interaction Chromatography Market by Type
- 4.2.4.2.1. Pre packed Columns Hydrophobic Interaction Chromatography Market by Type
- 4.3. Service
- 4.3.1. Key market trends, growth factors and opportunities
- 4.3.2. Market size and forecast, by region
- 4.3.3. Market share analysis by country
CHAPTER 5: HYDROPHOBIC INTERACTION CHROMATOGRAPHY MARKET, BY SAMPLE TYPE
- 5.1. Overview
- 5.1.1. Market size and forecast
- 5.2. Monoclonal antibodies
- 5.2.1. Key market trends, growth factors and opportunities
- 5.2.2. Market size and forecast, by region
- 5.2.3. Market share analysis by country
- 5.3. Vaccines
- 5.3.1. Key market trends, growth factors and opportunities
- 5.3.2. Market size and forecast, by region
- 5.3.3. Market share analysis by country
- 5.4. Cell culture sample
- 5.4.1. Key market trends, growth factors and opportunities
- 5.4.2. Market size and forecast, by region
- 5.4.3. Market share analysis by country
- 5.5. Plasma and serum sample
- 5.5.1. Key market trends, growth factors and opportunities
- 5.5.2. Market size and forecast, by region
- 5.5.3. Market share analysis by country
- 5.6. Others
- 5.6.1. Key market trends, growth factors and opportunities
- 5.6.2. Market size and forecast, by region
- 5.6.3. Market share analysis by country
CHAPTER 6: HYDROPHOBIC INTERACTION CHROMATOGRAPHY MARKET, BY APPLICATION
- 6.1. Overview
- 6.1.1. Market size and forecast
- 6.2. Protein and antibody purification
- 6.2.1. Key market trends, growth factors and opportunities
- 6.2.2. Market size and forecast, by region
- 6.2.3. Market share analysis by country
- 6.2.4. Protein and antibody purification Hydrophobic Interaction Chromatography Market by Resins
- 6.3. Vaccine development
- 6.3.1. Key market trends, growth factors and opportunities
- 6.3.2. Market size and forecast, by region
- 6.3.3. Market share analysis by country
- 6.4. Drug discovery
- 6.4.1. Key market trends, growth factors and opportunities
- 6.4.2. Market size and forecast, by region
- 6.4.3. Market share analysis by country
- 6.5. Food and dietary supplement development
- 6.5.1. Key market trends, growth factors and opportunities
- 6.5.2. Market size and forecast, by region
- 6.5.3. Market share analysis by country
CHAPTER 7: HYDROPHOBIC INTERACTION CHROMATOGRAPHY MARKET, BY END USER
- 7.1. Overview
- 7.1.1. Market size and forecast
- 7.2. Pharmaceutical and biopharmaceutical companies
- 7.2.1. Key market trends, growth factors and opportunities
- 7.2.2. Market size and forecast, by region
- 7.2.3. Market share analysis by country
- 7.3. Contract research organizations and contract manufacturing organizations
- 7.3.1. Key market trends, growth factors and opportunities
- 7.3.2. Market size and forecast, by region
- 7.3.3. Market share analysis by country
- 7.4. Research and academic institutes
- 7.4.1. Key market trends, growth factors and opportunities
- 7.4.2. Market size and forecast, by region
- 7.4.3. Market share analysis by country
- 7.5. Others
- 7.5.1. Key market trends, growth factors and opportunities
- 7.5.2. Market size and forecast, by region
- 7.5.3. Market share analysis by country
CHAPTER 8: HYDROPHOBIC INTERACTION CHROMATOGRAPHY MARKET, BY REGION
- 8.1. Overview
- 8.1.1. Market size and forecast By Region
- 8.2. North America
- 8.2.1. Key market trends, growth factors and opportunities
- 8.2.2. Market size and forecast, by Product and Service
- 8.2.3. Market size and forecast, by Sample type
- 8.2.4. Market size and forecast, by Application
- 8.2.5. Market size and forecast, by End user
- 8.2.6. Market size and forecast, by country
- 8.2.6.1. U.S.
- 8.2.6.1.1. Market size and forecast, by Product and Service
- 8.2.6.1.2. Market size and forecast, by Sample type
- 8.2.6.1.3. Market size and forecast, by Application
- 8.2.6.1.4. Market size and forecast, by End user
- 8.2.6.2. Canada
- 8.2.6.2.1. Market size and forecast, by Product and Service
- 8.2.6.2.2. Market size and forecast, by Sample type
- 8.2.6.2.3. Market size and forecast, by Application
- 8.2.6.2.4. Market size and forecast, by End user
- 8.2.6.3. Mexico
- 8.2.6.3.1. Market size and forecast, by Product and Service
- 8.2.6.3.2. Market size and forecast, by Sample type
- 8.2.6.3.3. Market size and forecast, by Application
- 8.2.6.3.4. Market size and forecast, by End user
- 8.3. Europe
- 8.3.1. Key market trends, growth factors and opportunities
- 8.3.2. Market size and forecast, by Product and Service
- 8.3.3. Market size and forecast, by Sample type
- 8.3.4. Market size and forecast, by Application
- 8.3.5. Market size and forecast, by End user
- 8.3.6. Market size and forecast, by country
- 8.3.6.1. Germany
- 8.3.6.1.1. Market size and forecast, by Product and Service
- 8.3.6.1.2. Market size and forecast, by Sample type
- 8.3.6.1.3. Market size and forecast, by Application
- 8.3.6.1.4. Market size and forecast, by End user
- 8.3.6.2. France
- 8.3.6.2.1. Market size and forecast, by Product and Service
- 8.3.6.2.2. Market size and forecast, by Sample type
- 8.3.6.2.3. Market size and forecast, by Application
- 8.3.6.2.4. Market size and forecast, by End user
- 8.3.6.3. UK
- 8.3.6.3.1. Market size and forecast, by Product and Service
- 8.3.6.3.2. Market size and forecast, by Sample type
- 8.3.6.3.3. Market size and forecast, by Application
- 8.3.6.3.4. Market size and forecast, by End user
- 8.3.6.4. Italy
- 8.3.6.4.1. Market size and forecast, by Product and Service
- 8.3.6.4.2. Market size and forecast, by Sample type
- 8.3.6.4.3. Market size and forecast, by Application
- 8.3.6.4.4. Market size and forecast, by End user
- 8.3.6.5. Spain
- 8.3.6.5.1. Market size and forecast, by Product and Service
- 8.3.6.5.2. Market size and forecast, by Sample type
- 8.3.6.5.3. Market size and forecast, by Application
- 8.3.6.5.4. Market size and forecast, by End user
- 8.3.6.6. Rest of Europe
- 8.3.6.6.1. Market size and forecast, by Product and Service
- 8.3.6.6.2. Market size and forecast, by Sample type
- 8.3.6.6.3. Market size and forecast, by Application
- 8.3.6.6.4. Market size and forecast, by End user
- 8.4. Asia-Pacific
- 8.4.1. Key market trends, growth factors and opportunities
- 8.4.2. Market size and forecast, by Product and Service
- 8.4.3. Market size and forecast, by Sample type
- 8.4.4. Market size and forecast, by Application
- 8.4.5. Market size and forecast, by End user
- 8.4.6. Market size and forecast, by country
- 8.4.6.1. Japan
- 8.4.6.1.1. Market size and forecast, by Product and Service
- 8.4.6.1.2. Market size and forecast, by Sample type
- 8.4.6.1.3. Market size and forecast, by Application
- 8.4.6.1.4. Market size and forecast, by End user
- 8.4.6.2. China
- 8.4.6.2.1. Market size and forecast, by Product and Service
- 8.4.6.2.2. Market size and forecast, by Sample type
- 8.4.6.2.3. Market size and forecast, by Application
- 8.4.6.2.4. Market size and forecast, by End user
- 8.4.6.3. India
- 8.4.6.3.1. Market size and forecast, by Product and Service
- 8.4.6.3.2. Market size and forecast, by Sample type
- 8.4.6.3.3. Market size and forecast, by Application
- 8.4.6.3.4. Market size and forecast, by End user
- 8.4.6.4. Australia
- 8.4.6.4.1. Market size and forecast, by Product and Service
- 8.4.6.4.2. Market size and forecast, by Sample type
- 8.4.6.4.3. Market size and forecast, by Application
- 8.4.6.4.4. Market size and forecast, by End user
- 8.4.6.5. South Korea
- 8.4.6.5.1. Market size and forecast, by Product and Service
- 8.4.6.5.2. Market size and forecast, by Sample type
- 8.4.6.5.3. Market size and forecast, by Application
- 8.4.6.5.4. Market size and forecast, by End user
- 8.4.6.6. Rest of Asia-Pacific
- 8.4.6.6.1. Market size and forecast, by Product and Service
- 8.4.6.6.2. Market size and forecast, by Sample type
- 8.4.6.6.3. Market size and forecast, by Application
- 8.4.6.6.4. Market size and forecast, by End user
- 8.5. LAMEA
- 8.5.1. Key market trends, growth factors and opportunities
- 8.5.2. Market size and forecast, by Product and Service
- 8.5.3. Market size and forecast, by Sample type
- 8.5.4. Market size and forecast, by Application
- 8.5.5. Market size and forecast, by End user
- 8.5.6. Market size and forecast, by country
- 8.5.6.1. Brazil
- 8.5.6.1.1. Market size and forecast, by Product and Service
- 8.5.6.1.2. Market size and forecast, by Sample type
- 8.5.6.1.3. Market size and forecast, by Application
- 8.5.6.1.4. Market size and forecast, by End user
- 8.5.6.2. South Africa,
- 8.5.6.2.1. Market size and forecast, by Product and Service
- 8.5.6.2.2. Market size and forecast, by Sample type
- 8.5.6.2.3. Market size and forecast, by Application
- 8.5.6.2.4. Market size and forecast, by End user
- 8.5.6.3. Saudi Arabia
- 8.5.6.3.1. Market size and forecast, by Product and Service
- 8.5.6.3.2. Market size and forecast, by Sample type
- 8.5.6.3.3. Market size and forecast, by Application
- 8.5.6.3.4. Market size and forecast, by End user
- 8.5.6.4. Rest of LAMEA
- 8.5.6.4.1. Market size and forecast, by Product and Service
- 8.5.6.4.2. Market size and forecast, by Sample type
- 8.5.6.4.3. Market size and forecast, by Application
- 8.5.6.4.4. Market size and forecast, by End user
CHAPTER 9: COMPETITIVE LANDSCAPE
- 9.1. Introduction
- 9.2. Top winning strategies
- 9.3. Product mapping of top 10 player
- 9.4. Competitive dashboard
- 9.5. Competitive heatmap
- 9.6. Top player positioning, 2023
CHAPTER 10: COMPANY PROFILES
- 10.1. Bio-Rad Laboratories, Inc.
- 10.1.1. Company overview
- 10.1.2. Key executives
- 10.1.3. Company snapshot
- 10.1.4. Operating business segments
- 10.1.5. Product portfolio
- 10.1.6. Business performance
- 10.2. Sartorius AG
- 10.2.1. Company overview
- 10.2.2. Key executives
- 10.2.3. Company snapshot
- 10.2.4. Operating business segments
- 10.2.5. Product portfolio
- 10.2.6. Business performance
- 10.2.7. Key strategic moves and developments
- 10.3. Thermo Fisher Scientific Inc.
- 10.3.1. Company overview
- 10.3.2. Key executives
- 10.3.3. Company snapshot
- 10.3.4. Operating business segments
- 10.3.5. Product portfolio
- 10.3.6. Business performance
- 10.3.7. Key strategic moves and developments
- 10.4. Tosoh Corporation
- 10.4.1. Company overview
- 10.4.2. Key executives
- 10.4.3. Company snapshot
- 10.4.4. Operating business segments
- 10.4.5. Product portfolio
- 10.4.6. Key strategic moves and developments
- 10.5. Geno Technology, Inc.
- 10.5.1. Company overview
- 10.5.2. Key executives
- 10.5.3. Company snapshot
- 10.5.4. Operating business segments
- 10.5.5. Product portfolio
- 10.6. Danaher Corporation
- 10.6.1. Company overview
- 10.6.2. Key executives
- 10.6.3. Company snapshot
- 10.6.4. Operating business segments
- 10.6.5. Product portfolio
- 10.6.6. Business performance
- 10.6.7. Key strategic moves and developments
- 10.7. Sepax Technologies, Inc.
- 10.7.1. Company overview
- 10.7.2. Key executives
- 10.7.3. Company snapshot
- 10.7.4. Operating business segments
- 10.7.5. Product portfolio
- 10.8. Agilent Technologies, Inc.
- 10.8.1. Company overview
- 10.8.2. Key executives
- 10.8.3. Company snapshot
- 10.8.4. Operating business segments
- 10.8.5. Product portfolio
- 10.8.6. Business performance
- 10.9. Merck KGaA
- 10.9.1. Company overview
- 10.9.2. Key executives
- 10.9.3. Company snapshot
- 10.9.4. Operating business segments
- 10.9.5. Product portfolio
- 10.9.6. Business performance
- 10.9.7. Key strategic moves and developments
- 10.10. Waters Corporation
- 10.10.1. Company overview
- 10.10.2. Key executives
- 10.10.3. Company snapshot
- 10.10.4. Operating business segments
- 10.10.5. Product portfolio
- 10.10.6. Business performance
- 10.10.7. Key strategic moves and developments
- 10.11. KNAUER Wissenschaftliche Gerate GmbH
- 10.11.1. Company overview
- 10.11.2. Key executives
- 10.11.3. Company snapshot
- 10.11.4. Operating business segments
- 10.11.5. Product portfolio
 色譜儀器市場-全球產業規模、佔有率、趨勢、機會及預測(按設備、應用、地區及競爭細分,2020-2030 年)
 層析法資料系統 (CDS) 市場規模、佔有率及成長分析(按類型、部署、組件、最終用戶、應用、垂直領域和地區)- 2025 年至 2032 年產業預測層析法注射器市場規模、佔有率及成長分析(按應用、材料類型、注射器類型、最終用途和地區)-2025-2032 年產業預測離子色譜市場 - 全球產業規模、佔有率、趨勢、機會和預測,按技術、應用、地區和競爭細分,2020-2030 年
 層析法設備市場:未來預測(2025-2030)
 全球超臨界流體發泡鞋材市場:2024年
 全球氣相層析系統市場 - 2025 - 2032層析法市場按層析法系統、消耗品和配件、最終用戶和地區分類
 全球離子層析法市場疏水交互作用層析法市場規模、佔有率和成長分析(按產品類型、樣品類型、最終用戶和地區)- 產業預測 2025-2032