


 |
市場調查報告書
商品編碼
1514356
連接器產業年鑑(2024)2024 Connector Industry Yearbook |
||||||
本報告是連接器產業的年鑑,每年根據上市連接器企業提供的年報編寫。利潤表和資產負債表合併了過去10年、5年和最近一年的利潤表和資產負債表,為行業和上市公司的整體業績提供了基準。
此外,連接器產業的銷售趨勢(按地區和最終用途市場,2013-2023年)以及最新的銷售和未來趨勢預測(按地區和最終用途市場,2024年和2029年)等。
此報告的特點
上市合併歷史:
- 主要財務指標(2013-2023 年)
- 資產負債表(金額基礎,2013-2023 年)
- 損益表(金額基礎,2013-2023 年)
- 資產負債表(%,2013-2023 年)
- 損益表(%,2013-2023 年)
各公司近15年業績及財務指標產業平均值:
- 銷售、一般及管理費用(%,2009-2023 年)
- 淨利率(%,2009-2023 年)
- 資產報酬率(2009-2023 年)
- 長期負債/股本比率(2009-2023 年)
- 應收帳款週轉率(2009-2023年)
- 庫存週轉率(2009-2023)
- 銷售成本比率(%,2009-2023 年)
- 銷售成本 + SG&A 費用率(%,2009-2023 年)
- 流動比率(2009-2023)
- 股本回報率(2009-2023 年)
- 負債比率(2009-2023)
- 平均收款期(2009-2023)
- 庫存天數(2009-2023 年)
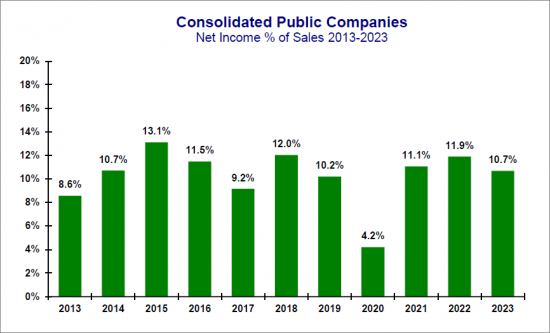
下表顯示了受訪上市公司的淨利與銷售額的比率(2013-2023年)。
淨利
2023年連接器產業平均淨利為銷售額的10.7%。 2018 年對美國來說是重要的一年,因為這一年《減稅與就業法案》獲得通過。該法將聯邦企業稅從 35% 降至 21%。
由於2009年全球經濟衰退,淨利潤與銷售額的比率達到2009年的最低水平,為-12.6%。這是合併公司首次出現淨利負值。 2014年至2018年,淨利潤佔銷售額的比例從2014年的10.7%成長至2018年的12.0%。此外,2019年至2023年,淨利成長率從2019年的10.2%成長至2023年的10.7%。
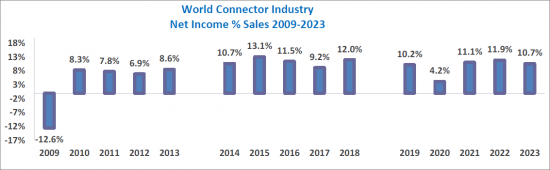
下圖為連接器產業淨利走勢(2009-2023年)。
目錄
第一章:全球電子連接器產業
- 市場趨勢:過去 10 年(2013-2023 年)
- 表格:按地區分列的銷售額
- 圖:按地區劃分的最新情況(2013年)和過去五年(2018-2023年)的趨勢變化
- 表格:按地區分列的銷售額
- 圖:全球連結器產業:年增長率變化(1980-2024)
- 圖:北美市場年增率(1980-2024)
- 圖:歐洲市場年增率(1980-2024)
- 圖:日本市場年增率(1980-2024)
- 圖:中國市場年增率(1995-2024)
- 圖:亞太市場年增率(1980-2024)
- 圖:世界其他地區 (RoW) 市場的年增長率(1980-2024 年)
- 最新情況(2023)
- 表:按地區劃分的成長率變化(%,2021 年、2022 年、2023 年)
- 表:按地區劃分的市佔率(%,2021 年、2022 年、2023 年)
- 設備部門銷售額(2021-2023 年)
- 表:按設備產業劃分的設備銷售額變化率(%,2021-2023 年)
- 圖:按設備產業劃分的全球連接器銷售波動性(%,2021-2023 年)
- 表:全球銷售量:依設備類別劃分(2023 年)
- 圖:全球連接器市場(設備領域)排名前五的企業(2023年)
- 各地區的現況與預測(2024/2029)
- 表:依最終用途市場劃分的預測(2024/2029 年)
- 圖:未來五年(2024年和2029年)的最終用途市場預測
- 複合年增長率
- 企業併購 (M&A)
- 主要科技趨勢
- 交貨日期
- 價格趨勢
第 2 章:重要事件
第 3 章:綜合關鍵績效指標
綜合關鍵績效指標
- 主要財務指標(2013-2023)
- 表:主要財務指標
- 資產負債表(金額基礎,2013-2023 年)
- 資產負債表(%,2013-2023 年)
- 損益表(金額基礎,2013-2023 年)
- 損益表(%,2013-2023 年)
各公司的業績歷史記錄
- 接受調查的連接器製造商
銷售成本
- 銷售成本(%,2009-2023 年)
銷售、一般及管理費用 (SG&A)
- 銷售、一般及管理費用(%,2009-2023 年)
銷售成本 + 銷售、一般及管理費用
- 銷售成本 + 銷售、一般及管理費用(%,2009-2023 年)
淨利趨勢
- 淨利(%,2009-2023 年)
流動比率
- 流動比率(2009-2023)
資產報酬率
- 資產報酬率(2009-2023 年)
股本報酬率
- 股本回報率(2009-2023 年)
長期負債/股本比率
- 長期負債/股本比率(2009-2023 年)
負債比率
- 負債比率(2009-2023)
應收帳款週轉率
- 應收帳款週轉率(2009-2023年)
平均收款週期
- 平均收款期(2009-2023)
庫存週轉率
- 庫存週轉率(2009-2023)
庫存天數
- 庫存天數(2009-2023 年)
第四章:受訪公司的表現
受訪公司的過往績效
Amphenol Corporation
- 主要財務指標
- 表:主要財務指標
- 資產負債表(金額基礎,2013-2023 年)
- 資產負債表(%,2013-2023 年)
- 損益表(金額基礎,2013-2023 年)
- 損益表(%,2013-2023 年)
Cheng Uei Precision Co. Ltd. (Foxlink)
FIT Hon Teng Ltd
Hirose Electric Co., Ltd
Hosiden
HUBER+SUHNER
Japan Aviation Electronics Industry (JAE), Limited
Korea Electric Terminal Co. Ltd
SMK
TE Connectivity
Each year, Bishop & Associates prepares the Connector Industry Yearbook based on annual reports provided by publicly traded connector companies. Income statements and balance sheets are consolidated for the past 10 years, five years, and most current year, providing benchmarks on the industry and the overall performance of the public connector companies.
In addition, the report provides a review of the connector industry for the period 2013-2023 for sales by region, end-use equipment sector and our current forecast for 2024 and 2029 by region and end-use equipment sector.
This report features:
Consolidated history of the public companies including:
- Key Financial Measurements (2013-2023)
- Balance Sheet $ (2013-2023)
- Income Statement $ (2013-2023)
- Balance Sheet percent (2013-2023)
- Income Statement percent (2013-2023)
Fifteen-year history of performance by company, with industry averages for the following financial measurements:
- Selling, General, & Administrative percent (2009-2023)
- Net Income percent (2009-2023)
- Return on Assets (2009-2023)
- Long Term Debt/Equity (2009-2023)
- Accounts Receivables Turnover (2009-2023)
- Inventory Turns (2009-2023)
- Cost of Goods Sold percent (2009-2023)
- COGS + SG&A percent (2009-2023)
- Current Ratio (2009-2023)
- Return on Equity (2009-2023)
- Liabilities to Equity (2009-2023)
- Average Collection Period (2009-2023)
- Days Inventory (2009-2023)
The following table provides Net Income as a percent of sales from 2013-2023 for public companies included in the 2024 Connector Industry Yearbook.
Net Income
In 2023 the connector industry had an average net income of 10.7% of sales. 2018 was a significant year in the United States because it was the year the Tax Cuts and Jobs Act was passed. This act reduced the federal corporate income tax from 35% to 21%.
As a result of the worldwide economic downturn in 2009, the lowest net income as a percent of sales occurred in 2009 at -12.6%. This was the first time that net income had been a negative number for the consolidated public companies. Between 2014 and 2018, net income increased from 10.7% of sales in 2014 to 12.0% of sales in 2018. Between 2019 and 2023, net income increased from 10.2% in 2019 to 10.7% in 2023.
The following chart provides a history of net income for the Connector Industry from 2009-2023.
Table of Contents
CHAPTER 1 - THE WORLD ELECTRONIC CONNECTOR INDUSTRY
- The Last Ten Years (2013-2023)
- Table: Sales by Geographic Region
- Graph: Change by Geographic Region 2013 vs The Last Five Years (2018-2023)
- Table: Sales by Geographic Region
- Graph: World Connector Industry - Year-To-Year Percent Change in Growth 1980-2024F
- Graph: North American Market Year-to-Year Growth 1980-2024F
- Graph: European Market Year-to-Year Growth 1980-2024F
- Graph: Japanese Market Year-to-Year Growth 1980-2024F
- Graph: Chinese Market Year-to-Year Growth 1995-2024F
- Graph: Asia Pacific Market Year-to-Year Growth 1980-2024F
- Graph: ROW Market Year-to-Year Growth 1980-2024F
- Last Year - 2023
- Table: 2021, 2022 and 2023 Percent Change in Growth by Region
- Table: 2021, 2022 and 2023 Percent Share of Market by Region
- Equipment Sector Sales - 2021-2023
- Table: 2021-2023 Percent Change in Equipment Sales by Equipment Sector
- Graph: 2022-2023 Percent Change World Connector Sales by Equipment Sector
- Table: 2023 World Sales by Equipment Sector
- Graph: 2023 World Connector Market Top 5 Equipment Sectors
- Forecast 2024 and 2029 by Region
- Table: 2024 and 2029 Forecast by End-Use Market
- Graph: 2024 and 2029 End-Use Market Five-Year
- CAGR
- Mergers and Acquisitions
- Key Technology Trends
- Lead Times
- Price Trends
CHAPTER 2 - SIGNIFICANT EVENTS
CHAPTER 3 - CONSOLIDATED KEY PERFORMANCE MEASURES
Consolidated Key Performance Measures
- Key Financial Measurements (2013-2023)
- Charts: Key Financial Measurements
- Balance Sheet $ (2013-2023)
- Balance Sheet % (2013-2023)
- Income Statement $ (2013-2023)
- Income Statement % (2013-2023)
Performance History by Company
- Selected Connector Manufacturers
Cost-of-Goods Sold
- Cost of Goods Sold % (2009-2023)
Selling, General & Administrative (SG&A)
- Selling, General, & Administrative % (2009-2023)
COGS+SG&A
- COGS + SG&A % (2009-2023)
Net Income History
- Net Income % (2009-2023)
Current Ratio
- Current Ratio (2009-2023)
Return on Assets
- Return on Assets (2009-2023)
Return on Equity
- Return on Equity (2009-2023)
Long Term Debt/Equity
- Long Term Debt/Equity (2009-2023)
Liabilities to Equity
- Liabilities to Equity (2009-2023)
Accounts Receivable Turnover
- Accounts Receivables Turnover (2009-2023)
Average Collection Period
- Average Collection Period (2009-2023)
Inventory Turns
- Inventory Turns (2009-2023)
Days Inventory
- Days Inventory (2009-2023)
CHAPTER 4 - PERFORMANCE HISTORY OF SELECTED COMPANIES
Performance History of Selected Companies
Amphenol Corporation
- Key Financial Measurements
- Charts: Key Financial Measurements
- Balance Sheet $ (2013-2023)
- Balance Sheet % (2013-2023)
- Income Statement $ (2013-2023)
- Income Statement % (2013-2023)
Cheng Uei Precision Co. Ltd. (Foxlink)
- Key Financial Measurements
- Charts: Key Financial Measurements
- Balance Sheet $ (2013-2023)
- Balance Sheet % (2013-2023)
- Income Statement $ (2013-2023)
- Income Statement % (2013-2023)
FIT Hon Teng Ltd
- Key Financial Measurements
- Charts: Key Financial Measurements
- Balance Sheet $ (2013-2023)
- Balance Sheet % (2013-2023)
- Income Statement $ (2013-2023)
- Income Statement % (2013-2023)
Hirose Electric Co., Ltd
- Key Financial Measurements
- Charts: Key Financial Measurements
- Balance Sheet $ (2013-2023)
- Balance Sheet % (2013-2023)
- Income Statement $ (2013-2023)
- Income Statement % (2013-2023)
Hosiden
- Key Financial Measurements
- Charts: Key Financial Measurements
- Balance Sheet $ (2013-2023)
- Balance Sheet % (2013-2023)
- Income Statement $ (2013-2023)
- Income Statement % (2013-2023)
HUBER+SUHNER
- Key Financial Measurements
- Charts: Key Financial Measurements
- Balance Sheet $ (2013-2023)
- Balance Sheet % (2013-2023)
- Income Statement $ (2013-2023)
- Income Statement % (2013-2023)
Japan Aviation Electronics Industry (JAE), Limited
- Key Financial Measurements
- Charts: Key Financial Measurements
- Balance Sheet $ (2013-2023)
- Balance Sheet % (2013-2023)
- Income Statement $ (2013-2023)
- Income Statement % (2013-2023)
Korea Electric Terminal Co. Ltd
- Key Financial Measurements
- Charts: Key Financial Measurements
- Balance Sheet $ (2013-2023)
- Balance Sheet % (2013-2023)
- Income Statement $ (2013-2023)
- Income Statement % (2013-2023)
SMK
- Key Financial Measurements
- Charts: Key Financial Measurements
- Balance Sheet $ (2013-2023)
- Balance Sheet % (2013-2023)
- Income Statement $ (2013-2023)
- Income Statement % (2013-2023)
TE Connectivity
- Key Financial Measurements
- Charts: Key Financial Measurements
- Balance Sheet $ (2013-2023)
- Balance Sheet % (2013-2023)
- Income Statement $ (2013-2023)
- Income Statement % (2013-2023)
 全球 PPLN 波導市場:市場佔有率和排名、總收入和需求預測(2025-2031 年)
 全球連接器市場:手冊
 電纜和連接器市場規模、佔有率及成長分析(按產品類型、安裝類型、最終用戶和地區)-2025-2032 年產業預測
 2025年連接器全球市場報告
 全球液壓流體連接器市場研究報告 - 產業分析、規模、佔有率、成長、趨勢和預測 2025 年至 2033 年2025 年高壓接線連接器全球市場報告全球數位媒體適配器市場:未來預測(2025-2030)
 防爆連接器市場報告:趨勢、預測和競爭分析(至 2031 年)
 機械連接器市場:全球 2025-2029連接器市場規模、佔有率和成長分析(按產品、材料、最終用途和地區)- 產業預測 2025-2032