


 |
市場調查報告書
商品編碼
1664839
MLOps 市場機會、成長動力、產業趨勢分析與 2025 - 2034 年預測MLOps Market Opportunity, Growth Drivers, Industry Trend Analysis, and Forecast 2025 - 2034 |
||||||
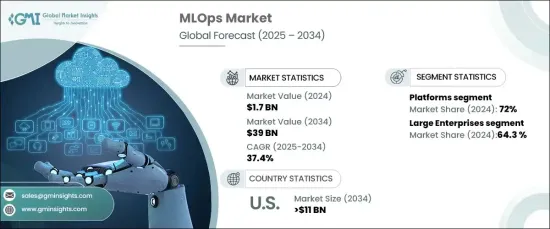
2024 年全球 MLOps 市場價值為 17 億美元,預計 2025 年至 2034 年期間複合年成長率將達到 37.4%。 向雲端運算的轉變日益成為主要驅動力,因為雲端平台提供了有效管理大量資料集和複雜機器學習工作流程所需的可擴展性和靈活性。
基於雲端的 MLOps 解決方案使組織能夠在多個環境中無縫部署模型。這種方法消除了對大量內部部署基礎架構的需求,同時提供了增強的效能和可擴展性。透過利用這些解決方案,企業可以簡化機器學習操作並以更高的效率適應不斷變化的需求。
| 市場範圍 | |
|---|---|
| 起始年份 | 2024 |
| 預測年份 | 2025-2034 |
| 起始值 | 17億美元 |
| 預測值 | 390億美元 |
| 複合年成長率 | 37.4% |
對於旨在保持競爭優勢的組織來說,縮短新的機器學習模型的上市時間已經成為關鍵的優先事項。 MLOps 平台透過持續整合和持續部署 (CI/CD) 實現開發、測試和部署流程的自動化,從而實現這一點。這種自動化可以加速工作流程、最大限度地減少人工干預並確保模型保持可擴展且持續更新。
MLOps 市場按組件細分為平台和服務。 2024 年,平台引領市場,佔據 72% 的總佔有率。這種主導地位源於對統一資料管道管理、模型部署、實驗追蹤和效能監控的端到端解決方案日益成長的需求。綜合平台越來越受到尋求擴展人工智慧計畫同時簡化工作流程的企業的青睞。
諮詢、整合和託管服務等服務也正在經歷顯著的成長。這些服務可協助組織克服雲端遷移、基礎架構最佳化和合規性要求等採用挑戰。客製化指導需求的增加凸顯了 MLOps 生態系統中專家支援的重要性。
根據最終用途,市場分為大型企業和中小型企業。 2024 年,大型企業佔據了 64.3% 的市場佔有率,這得益於採用 MLOps 解決方案來最佳化 AI 工作流程、增強預測分析和改善治理。同時,中小企業正在迅速採用具有成本效益、方便用戶使用的工具,以使其能夠實現流程自動化並促進創新。人工智慧工具的日益普及支持了這一趨勢,使得小型企業無需進行大量的基礎設施投資即可實現可擴展性。
在北美,美國引領 MLOps 市場,預計到 2034 年將超過 110 億美元。對雲端基礎設施和高效能運算的投資進一步推動了MLOps解決方案的採用,幫助企業改善模型營運並縮短部署時間。
報告內容
第 1 章:方法論與範圍
- 研究設計
- 研究方法
- 資料收集方法
- 基礎估計和計算
- 基準年計算
- 市場估計的主要趨勢
- 預測模型
- 初步研究與驗證
- 主要來源
- 資料探勘來源
- 市場定義
第 2 章:執行摘要
第 3 章:產業洞察
- 產業生態系統分析
- 技術提供者
- 模型開發與訓練平台
- 資料管理提供者
- 模型部署和治理提供者
- 最終用戶
- 供應商概況
- 利潤率分析
- MLOps 的用例
- 技術與創新格局
- 重要新聞及舉措
- 監管格局
- 衝擊力
- 成長動力
- 人工智慧和機器學習的採用率提高
- 對更快模型部署的需求
- 監理合規和模型治理
- 雲端採用和可擴展性
- 產業陷阱與挑戰
- 資料隱私和安全問題
- 缺乏熟練的專業人員
- 成長動力
- 成長潛力分析
- 波特的分析
- PESTEL 分析
第4章:競爭格局
- 介紹
- 公司市佔率分析
- 競爭定位矩陣
- 戰略展望矩陣
第5章:市場估計與預測:按組件,2021 - 2034 年
- 主要趨勢
- 平台
- 服務
第6章:市場估計與預測:依部署模式,2021 - 2034 年
- 主要趨勢
- 基於雲端
- 本地
第 7 章:市場估計與預測:依最終用途,2021 年至 2034 年
- 主要趨勢
- 大型企業
- 中小企業
第 8 章:市場估計與預測:按垂直產業,2021 - 2034 年
- 主要趨勢
- 衛生保健
- 零售與電子商務
- 製造與供應鏈
- 金融保險業協會
- 其他
第 9 章:市場估計與預測:按地區,2021 - 2034 年
- 主要趨勢
- 北美洲
- 美國
- 加拿大
- 歐洲
- 英國
- 德國
- 法國
- 西班牙
- 義大利
- 俄羅斯
- 北歐
- 亞太地區
- 中國
- 印度
- 日本
- 韓國
- 澳新銀行
- 東南亞
- 拉丁美洲
- 巴西
- 墨西哥
- 阿根廷
- 中東及非洲
- 阿拉伯聯合大公國
- 南非
- 沙烏地阿拉伯
第10章:公司簡介
- Alteryx
- Amazon Web Services (AWS)
- Atos
- Capgemini
- Cisco
- Cloudera
- Databricks
- Google Cloud
- H2O.ai
- IBM
- Microsoft
- NVIDIA
- Oracle
- Red Hat
- Salesforce
- SAP
- Siemens
- TIBCO Software
- VMware
- Weights & Biases
The Global MLOps Market was valued at USD 1.7 billion in 2024 and is forecasted to grow at a robust CAGR of 37.4% from 2025 to 2034. The increasing shift towards cloud computing serves as a major driver, as cloud platforms offer the scalability and flexibility needed to manage extensive datasets and complex machine learning workflows efficiently.
Cloud-based MLOps solutions enable organizations to deploy models seamlessly across multiple environments. This approach eliminates the need for extensive on-premises infrastructure while delivering enhanced performance and scalability. By leveraging these solutions, businesses can streamline machine learning operations and adapt to evolving demands with greater efficiency.
| Market Scope | |
|---|---|
| Start Year | 2024 |
| Forecast Year | 2025-2034 |
| Start Value | $1.7 billion |
| Forecast Value | $39 billion |
| CAGR | 37.4% |
Reducing the time-to-market for new machine learning models has become a critical priority for organizations aiming to maintain a competitive edge. MLOps platforms facilitate this by automating the development, testing, and deployment processes through continuous integration and continuous deployment (CI/CD). This automation accelerates workflows, minimizes manual intervention, and ensures models remain scalable and consistently updated.
The MLOps market is segmented by components into platforms and services. Platforms led the market in 2024, capturing 72% of the total share. This dominance stems from the growing demand for end-to-end solutions that unify data pipeline management, model deployment, experiment tracking, and performance monitoring. Comprehensive platforms are increasingly favored by enterprises seeking to scale artificial intelligence initiatives while simplifying their workflows.
Services, including consulting, integration, and managed services, are also witnessing significant growth. These services assist organizations in overcoming adoption challenges such as cloud migration, infrastructure optimization, and compliance requirements. The rise in demand for tailored guidance highlights the importance of expert support in the MLOps ecosystem.
By end use, the market is categorized into Large Enterprises and SME. In 2024, Large Enterprises held a 64.3% market share, driven by the adoption of MLOps solutions to optimize AI workflows, enhance predictive analytics, and improve governance. Meanwhile, SME are rapidly embracing cost-effective, user-friendly tools that enable them to automate processes and foster innovation. The growing accessibility of AI tools supports this trend, allowing smaller businesses to achieve scalability without heavy infrastructure investments.
In North America, the United States leads the MLOps market, projected to surpass USD 11 billion by 2034. The country's strong adoption of AI and machine learning across industries such as healthcare, finance, and manufacturing underscores its pivotal role in driving market expansion. Investments in cloud infrastructure and high-performance computing further propel the adoption of MLOps solutions, helping businesses improve model operations and reduce deployment times.
Table of Contents
Chapter 1 Methodology & Scope
- 1.1 Research design
- 1.1.1 Research approach
- 1.1.2 Data collection methods
- 1.2 Base estimates and calculations
- 1.2.1 Base year calculation
- 1.2.2 Key trends for market estimates
- 1.3 Forecast model
- 1.4 Primary research & validation
- 1.4.1 Primary sources
- 1.4.2 Data mining sources
- 1.5 Market definitions
Chapter 2 Executive Summary
- 2.1 Industry 3600 synopsis, 2021 - 2034
Chapter 3 Industry Insights
- 3.1 Industry ecosystem analysis
- 3.1.1 Technology providers
- 3.1.2 Model development and training platforms
- 3.1.3 Data management providers
- 3.1.4 Model deployment and governance providers
- 3.1.5 End users
- 3.2 Supplier landscape
- 3.3 Profit margin analysis
- 3.4 Use cases of MLOps
- 3.5 Technology & innovation landscape
- 3.6 Key news & initiatives
- 3.7 Regulatory landscape
- 3.8 Impact forces
- 3.8.1 Growth drivers
- 3.8.1.1 Increased adoption of AI and machine learning
- 3.8.1.2 Demand for faster model deployment
- 3.8.1.3 Regulatory compliance and model governance
- 3.8.1.4 Cloud adoption and scalability
- 3.8.2 Industry pitfalls & challenges
- 3.8.2.1 Data privacy and security concerns
- 3.8.2.2 Lack of skilled professionals
- 3.8.1 Growth drivers
- 3.9 Growth potential analysis
- 3.10 Porter’s analysis
- 3.11 PESTEL analysis
Chapter 4 Competitive Landscape, 2024
- 4.1 Introduction
- 4.2 Company market share analysis
- 4.3 Competitive positioning matrix
- 4.4 Strategic outlook matrix
Chapter 5 Market Estimates & Forecast, By Component, 2021 - 2034 ($Mn)
- 5.1 Key trends
- 5.2 Platform
- 5.3 Services
Chapter 6 Market Estimates & Forecast, By Deployment Mode, 2021 - 2034 ($Mn)
- 6.1 Key trends
- 6.2 Cloud-based
- 6.3 On-Premises
Chapter 7 Market Estimates & Forecast, By End Use, 2021-2034 ($Mn)
- 7.1 Key trends
- 7.2 Large enterprises
- 7.3 SME
Chapter 8 Market Estimates & Forecast, By Vertical, 2021 - 2034 ($Mn)
- 8.1 Key trends
- 8.2 Healthcare
- 8.3 Retail & e-commerce
- 8.4 Manufacturing & supply chain
- 8.5 BFSI
- 8.6 Others
Chapter 9 Market Estimates & Forecast, By Region, 2021 - 2034 ($Mn)
- 9.1 Key trends
- 9.2 North America
- 9.2.1 U.S.
- 9.2.2 Canada
- 9.3 Europe
- 9.3.1 UK
- 9.3.2 Germany
- 9.3.3 France
- 9.3.4 Spain
- 9.3.5 Italy
- 9.3.6 Russia
- 9.3.7 Nordics
- 9.4 Asia Pacific
- 9.4.1 China
- 9.4.2 India
- 9.4.3 Japan
- 9.4.4 South Korea
- 9.4.5 ANZ
- 9.4.6 Southeast Asia
- 9.5 Latin America
- 9.5.1 Brazil
- 9.5.2 Mexico
- 9.5.3 Argentina
- 9.6 MEA
- 9.6.1 UAE
- 9.6.2 South Africa
- 9.6.3 Saudi Arabia
Chapter 10 Company Profiles
- 10.1 Alteryx
- 10.2 Amazon Web Services (AWS)
- 10.3 Atos
- 10.4 Capgemini
- 10.5 Cisco
- 10.6 Cloudera
- 10.7 Databricks
- 10.8 Google Cloud
- 10.9 H2O.ai
- 10.10 IBM
- 10.11 Microsoft
- 10.12 NVIDIA
- 10.13 Oracle
- 10.14 Red Hat
- 10.15 Salesforce
- 10.16 SAP
- 10.17 Siemens
- 10.18 TIBCO Software
- 10.19 VMware
- 10.20 Weights & Biases
 2025年DevOps中的產生生成式AI全球市場報告2025年全球DevOps自動化工具市場報告
 2025 年至 2033 年 DevOps 市場規模、佔有率、趨勢及預測(按類型、部署模式、組織規模、工具、垂直產業和地區分類)
 MLOps 市場規模、佔有率及成長分析(按組件、部署模式、組織規模、最終用途和地區)-2025 年至 2032 年產業預測
 零售 DevOps 市場報告:2031 年趨勢、預測與競爭分析2025 年全球 DevOps 市場報告
 2025-2029 年全球 DevOps 工具市場
 全球 MLOps 市場
 雲端基礎的DevOps工具的全球市場:市場規模、佔有率、趨勢分析報告 - 按公司規模、按產品類型、按應用、按地區的展望和預測,2024-2031年DevOps 市場:按產品、部署、組織規模、產業分類 – 2025-2030 年全球預測