


 |
市場調查報告書
商品編碼
1664847
P2P 租賃應用市場機會、成長動力、產業趨勢分析與 2025 - 2034 年預測P2P Rental Apps Market Opportunity, Growth Drivers, Industry Trend Analysis, and Forecast 2025 - 2034 |
||||||
2024 年全球 P2P 租賃應用市場估值達到 177 億美元,預計 2025 年至 2034 年期間複合年成長率為 10.9%。
消費者正逐漸從所有權模式轉向基於存取權的模式,青睞能夠讓個人之間共享資產的平台。行動技術、數位支付和直覺的應用程式介面的進步進一步簡化了這一流程,使人們更容易租賃或共享車輛、工具和娛樂設備等物品。年輕一代,尤其是千禧世代和 Z 世代,由於傾向於永續性和臨時獲取商品的便利性而推動了這一趨勢。
| 市場範圍 | |
|---|---|
| 起始年份 | 2024 |
| 預測年份 | 2025-2034 |
| 起始值 | 177億美元 |
| 預測值 | 493億美元 |
| 複合年成長率 | 10.9% |
隨著消費者尋求高價值物品的經濟實惠的替代品,包括豪華車、休閒車和戶外裝備在內的專業租賃類別的需求正在增加。迎合這些細分市場的平台正在獲得用戶參與和忠誠度,而行銷活動和社群媒體推廣在擴大採用方面發揮關鍵作用。這種對多樣化租賃類別的關注符合消費者對客製化解決方案的需求,有助於 P2P 租賃生態系統的發展。
市場按平台類型分為行動應用程式和基於網路的平台。 2024 年,行動應用程式佔據該領域主導地位,創造了 113 億美元的收入。行動應用程式仍然是首選,因為它們易於訪問,並且能夠與地理位置、安全支付和即時通知等智慧型手機功能整合。這些功能增強了整體用戶體驗,實現了即時通訊和順暢的交易。此外,應用程式專屬優惠和促銷活動正在吸引更多用戶,鞏固行動平台作為 P2P 租賃基石的地位。
按終端用戶細分,個人消費者在 2023 年佔據了 75% 的市場佔有率。零工工作的興起和靈活的生活方式推動了短期租賃的需求,使消費者無需長期承諾即可獲得資產。方便用戶使用的設計和社交媒體的影響進一步加速了採用,使這些平台成為滿足個人和專業需求的首選。
在北美,美國在 2024 年佔據了 68% 以上的區域市場佔有率。
目錄
第 1 章:方法論與範圍
- 研究設計
- 研究方法
- 資料收集方法
- 基礎估計和計算
- 基準年計算
- 市場估計的主要趨勢
- 預測模型
- 初步研究與驗證
- 主要來源
- 資料探勘來源
- 市場定義
第 2 章:執行摘要
第 3 章:產業洞察
- 產業生態系統分析
- 供應商概況
- 軟體供應商
- 技術提供者
- 雲端服務供應商
- 系統整合商
- 最終用途
- 利潤率分析
- 技術與創新格局
- 重要新聞及舉措
- 監管格局
- 衝擊力
- 成長動力
- 擴大採用共享經濟原則和資源最佳化
- 智慧型手機普及率不斷提高,推動應用程式普及
- 實施安全且使用者友善的支付系統
- 環保意識增強推動協作消費
- 產業陷阱與挑戰
- 不同市場的監管環境不同
- 用戶之間的信任與安全問題
- 成長動力
- 成長潛力分析
- 波特的分析
- PESTEL 分析
第4章:競爭格局
- 介紹
- 公司市佔率分析
- 競爭定位矩陣
- 戰略展望矩陣
第5章:市場估計與預測:按租金,2021 - 2034 年
- 主要趨勢
- 物業租賃
- 住宅
- 度假租賃
- 共享空間
- 車輛租賃
- 汽車
- 摩托車和踏板車
- 休閒車
- 設備租賃
- 工具和機械
- 體育及健身器材
- 攝影器材
- 其他
第6章:市場估計與預測:依平台,2021 - 2034 年
- 主要趨勢
- 行動應用程式
- 網路為基礎的平台
第 7 章:市場估計與預測:按最終用途,2021 - 2034 年
- 主要趨勢
- 個人消費者
- 企業和組織
第 8 章:市場估計與預測:按地區,2021 - 2034 年
- 主要趨勢
- 北美洲
- 美國
- 加拿大
- 歐洲
- 英國
- 德國
- 法國
- 義大利
- 西班牙
- 北歐
- 亞太地區
- 中國
- 印度
- 日本
- 韓國
- 澳洲
- 東南亞
- 拉丁美洲
- 巴西
- 阿根廷
- 墨西哥
- 中東及非洲
- 阿拉伯聯合大公國
- 沙烏地阿拉伯
- 南非
第9章:公司簡介
- Airbnb
- BabyQuip
- Booking.com
- Fat Llama
- Getaround
- KitSplit
- Lime
- Neighbor
- Outdoorsy
- Peerby
- Poshmark
- Rent the Runway
- Ruckify
- RVshare
- ShareGrid
- Spinlister
- Style Lend
- Turo
- Vrbo
- Zillow Rentals
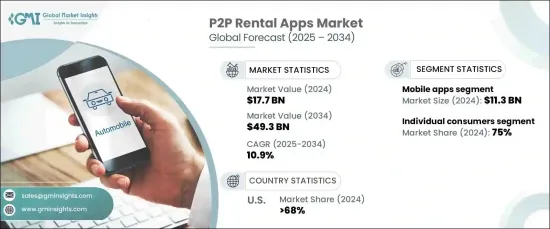
The Global P2P Rental Apps Market reached a valuation of USD 17.7 billion in 2024 and is expected to grow at a CAGR of 10.9% from 2025 to 2034. This robust expansion is primarily fueled by the rising popularity of the sharing economy and an increasing preference for on-demand services that offer flexibility and cost savings.
Consumers are gradually shifting from ownership to access-based models, favoring platforms that enable asset sharing between individuals. Advances in mobile technology, digital payments, and intuitive app interfaces have further streamlined this process, making it easier for people to rent or share items such as vehicles, tools, and recreational equipment. Younger generations, particularly millennials and Gen Z, are driving this trend due to their inclination toward sustainability and the convenience of temporary access to goods.
| Market Scope | |
|---|---|
| Start Year | 2024 |
| Forecast Year | 2025-2034 |
| Start Value | $17.7 Billion |
| Forecast Value | $49.3 Billion |
| CAGR | 10.9% |
Specialized rental categories, including luxury cars, recreational vehicles, and outdoor gear, are seeing heightened demand as consumers seek affordable alternatives to owning high-value items. Platforms catering to these niches are gaining user engagement and loyalty, with marketing campaigns and social media outreach playing a pivotal role in expanding adoption. This focus on diverse rental categories aligns with consumers' desire for tailored solutions, contributing to the growth of the P2P rental ecosystem.
The market is divided by platform type into mobile apps and web-based platforms. In 2024, mobile applications dominated the sector, generating USD 11.3 billion in revenue. Mobile apps remain the preferred choice due to their accessibility and integration with smartphone functionalities like geolocation, secure payments, and instant notifications. These features enhance the overall user experience, enabling real-time communication and smooth transactions. Moreover, app-exclusive deals and promotional campaigns are attracting more users, solidifying mobile platforms as the cornerstone of P2P rentals.
When segmented by end users, individual consumers represented 75% of the market share in 2023. These users are drawn to P2P platforms for their affordability, variety, and ease of use. The rise of gig work and flexible lifestyles has driven demand for short-term rentals, allowing consumers to access assets without long-term commitments. User-friendly designs and social media influence has further accelerated adoption, making these platforms a go-to option for personal and professional needs alike.
In North America, the United States accounted for over 68% of the regional market share in 2024. The country's tech-savvy population, widespread smartphone adoption, and thriving sharing economy have cemented its position as a leader in the P2P rental industry.
Table of Contents
Chapter 1 Methodology & Scope
- 1.1 Research design
- 1.1.1 Research approach
- 1.1.2 Data collection methods
- 1.2 Base estimates and calculations
- 1.2.1 Base year calculation
- 1.2.2 Key trends for market estimates
- 1.3 Forecast model
- 1.4 Primary research & validation
- 1.4.1 Primary sources
- 1.4.2 Data mining sources
- 1.5 Market definitions
Chapter 2 Executive Summary
- 2.1 Industry 3600 synopsis, 2021 - 2034
Chapter 3 Industry Insights
- 3.1 Industry ecosystem analysis
- 3.2 Supplier landscape
- 3.2.1 Software provider
- 3.2.2 Technology provider
- 3.2.3 Cloud service provider
- 3.2.4 System Integrators
- 3.2.5 End use
- 3.3 Profit margin analysis
- 3.4 Technology & innovation landscape
- 3.5 Key news & initiatives
- 3.6 Regulatory landscape
- 3.7 Impact forces
- 3.7.1 Growth drivers
- 3.7.1.1 Increasing adoption of shared economy principles and resource optimization
- 3.7.1.2 Rising smartphone penetration facilitating app adoption
- 3.7.1.3 Implementation of secure and user-friendly payment systems
- 3.7.1.4 Growing environmental consciousness promoting collaborative consumption
- 3.7.2 Industry pitfalls & challenges
- 3.7.2.1 Diverse regulatory landscapes across markets
- 3.7.2.2 Trust and security concerns among users
- 3.7.1 Growth drivers
- 3.8 Growth potential analysis
- 3.9 Porter’s analysis
- 3.10 PESTEL analysis
Chapter 4 Competitive Landscape, 2024
- 4.1 Introduction
- 4.2 Company market share analysis
- 4.3 Competitive positioning matrix
- 4.4 Strategic outlook matrix
Chapter 5 Market Estimates & Forecast, By Rental, 2021 - 2034 ($Mn)
- 5.1 Key trends
- 5.2 Property rental
- 5.2.1 Residential
- 5.2.2 Vacation rentals
- 5.2.3 Shared spaces
- 5.3 Vehicle rental
- 5.3.1 Cars
- 5.3.2 Motorcycle & scooter
- 5.3.3 Recreational vehicle
- 5.4 Equipment rental
- 5.4.1 Tools & machinery
- 5.4.2 Sports & fitness equipment
- 5.4.3 Photography equipment
- 5.5 Others
Chapter 6 Market Estimates & Forecast, By Platform, 2021 - 2034 ($Mn)
- 6.1 Key trends
- 6.2 Mobile apps
- 6.3 Web-based platform
Chapter 7 Market Estimates & Forecast, By End Use, 2021 - 2034 ($Mn)
- 7.1 Key trends
- 7.2 Individual consumers
- 7.3 Businesses & organizations
Chapter 8 Market Estimates & Forecast, By Region, 2021 - 2034 ($Mn)
- 8.1 Key trends
- 8.2 North America
- 8.2.1 U.S.
- 8.2.2 Canada
- 8.3 Europe
- 8.3.1 UK
- 8.3.2 Germany
- 8.3.3 France
- 8.3.4 Italy
- 8.3.5 Spain
- 8.3.6 Nordics
- 8.4 Asia Pacific
- 8.4.1 China
- 8.4.2 India
- 8.4.3 Japan
- 8.4.4 South Korea
- 8.4.5 Australia
- 8.4.6 Southeast Asia
- 8.5 Latin America
- 8.5.1 Brazil
- 8.5.2 Argentina
- 8.5.3 Mexico
- 8.6 MEA
- 8.6.1 UAE
- 8.6.2 Saudi Arabia
- 8.6.3 South Africa
Chapter 9 Company Profiles
- 9.1 Airbnb
- 9.2 BabyQuip
- 9.3 Booking.com
- 9.4 Fat Llama
- 9.5 Getaround
- 9.6 KitSplit
- 9.7 Lime
- 9.8 Neighbor
- 9.9 Outdoorsy
- 9.10 Peerby
- 9.11 Poshmark
- 9.12 Rent the Runway
- 9.13 Ruckify
- 9.14 RVshare
- 9.15 ShareGrid
- 9.16 Spinlister
- 9.17 Style Lend
- 9.18 Turo
- 9.19 Vrbo
- 9.20 Zillow Rentals


