


 |
市場調查報告書
商品編碼
1665019
可回收杯市場機會、成長動力、產業趨勢分析及 2024 - 2032 年預測Recyclable Cups Market Opportunity, Growth Drivers, Industry Trend Analysis, and Forecast 2024 - 2032 |
||||||
2023 年全球可回收杯市場價值達到 295 億美元,預計 2024 年至 2032 年期間複合年成長率為 5.7%。隨著消費者對環保替代品的需求不斷增加,回收技術的進步和飲料行業的擴張正在推動人們轉向可回收杯子,與傳統的一次性杯子相比,這是一種更永續的選擇。
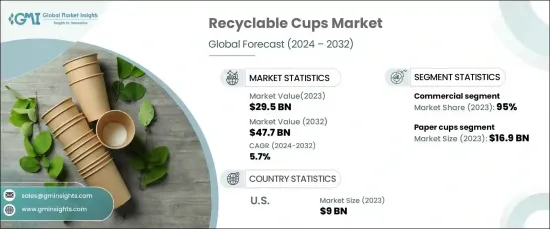
市場按材料類型細分,包括紙張、塑膠、金屬、玻璃、竹纖維和其他可回收材料。紙杯產業在 2023 年以 169 億美元的收入引領市場,預計到 2032 年將以 5.9% 的強勁複合年成長率成長。然而,傳統紙杯通常帶有聚乙烯襯裡,面臨回收挑戰。這推動了可生物分解和完全可回收材料的創新,進一步推動了對更永續紙杯解決方案的需求。
| 市場範圍 | |
|---|---|
| 起始年份 | 2023 |
| 預測年份 | 2024-2032 |
| 起始值 | 295億美元 |
| 預測值 | 477億美元 |
| 複合年成長率 | 5.7% |
可回收杯市場也按最終用戶細分為住宅和商業應用,其中商業領域在 2023 年佔據 95% 的主導佔有率。 預計該領域在 2024 年至 2032 年期間的複合年成長率為 5.7%。企業正在採用紙質、竹纖維和可回收塑膠杯,作為其永續發展和減少環境影響的承諾的一部分。
在美國,可回收杯市場在 2023 年創造了 90 億美元的收入,預計到 2032 年的複合年成長率將達到 5.8%。隨著永續性成為消費者的優先考慮因素,對由紙、竹子和植物材料製成的可堆肥和可重複使用的杯子的需求持續上升。限制一次性塑膠使用的監管措施進一步推動了環保替代品市場的發展。
目錄
第 1 章:方法論與範圍
- 市場範圍和定義
- 基礎估算與計算
- 預測計算。
- 資料來源
- 基本的
- 次要
- 付費來源
- 公共資源
第 2 章:執行摘要
第 3 章:產業洞察
- 產業生態系統分析
- 影響價值鏈的因素。
- 利潤率分析。
- 中斷
- 未來展望
- 製造商
- 經銷商
- 供應商概況
- 利潤率分析。
- 重要新聞及舉措
- 監管格局
- 衝擊力
- 成長動力
- 增強環保意識
- 消費者對環保產品的需求
- 產業陷阱與挑戰
- 其他環保替代品的競爭
- 來自傳統塑膠的競爭
- 成長動力
- 消費者購買行為分析
- 成長潛力分析
- 波特的分析
- PESTEL 分析
第4章:競爭格局
- 介紹
- 公司市佔率分析
- 競爭定位矩陣
- 戰略展望矩陣
第 5 章:市場估計與預測:依材料類型,2021-2032 年
- 主要趨勢
- 紙杯
- 塗層杯
- 無塗層杯子
- 塑膠杯
- 金屬杯
- 玻璃杯
- 竹纖維杯
- 其他(複合杯、泡沫杯等)
第6章:市場估計與預測:依產能,2021-2032 年
- 主要趨勢
- 最多 10 盎司
- 10至15盎司
- 15 盎司以上
第7章:市場估計與預測:按價格,2021-2032 年
- 主要趨勢
- 低的
- 中等的
- 高的
第 8 章:市場估計與預測:按應用,2021 年至 2032 年
- 主要趨勢
- 熱飲
- 冷飲
第 9 章:市場估計與預測:按最終用途,2021-2032 年
- 主要趨勢
- 住宅
- 商業的
- 食品和飲料
- 飯店和咖啡館
- 接待和活動
- 其他(快餐店等)
第 10 章:市場估計與預測:按配銷通路,2021-2032 年
- 主要趨勢
- 直接銷售
- 間接銷售
第 11 章:市場估計與預測:按地區,2021-2032 年
- 主要趨勢
- 北美洲
- 美國
- 加拿大
- 歐洲
- 英國
- 德國
- 法國
- 義大利
- 西班牙
- 俄羅斯
- 亞太地區
- 中國
- 印度
- 日本
- 韓國
- 澳洲
- 拉丁美洲
- 巴西
- 墨西哥
- 中東及非洲
- 阿拉伯聯合大公國
- 沙烏地阿拉伯
- 南非
第 12 章:公司簡介
- Ball
- Benders Paper Cups
- Berry Global
- BioCup
- Dart Container
- Detmold
- EcoSoul
- Georgia-Pacific
- Golden Paper Cups
- Green Paper Products
- Huhtamaki
- Nippon Paper
- Pactiv
- SogreenPack
- Solo Cup Company
The Global Recyclable Cups Market reached a value of USD 29.5 billion in 2023 and is projected to grow at a CAGR of 5.7% from 2024 to 2032. Rising environmental awareness, stricter regulations, and corporate sustainability efforts are key factors propelling the growth of this market. As consumers increasingly demand eco-friendly alternatives, advancements in recycling technologies and the expansion of the beverage industry are fueling the shift toward recyclable cups as a more sustainable option compared to traditional disposable cups.
The market is segmented by material type, including paper, plastic, metal, glass, bamboo fiber, and other recyclable materials. The paper cup segment led the market in 2023 with a revenue of USD 16.9 billion and is expected to grow at a robust CAGR of 5.9% through 2032. The increasing restrictions on plastic use and growing environmental concerns are making paper cups the preferred choice. However, traditional paper cups, which often feature polyethylene linings, face recycling challenges. This has driven innovation in biodegradable and fully recyclable materials, further propelling the demand for more sustainable paper cup solutions.
| Market Scope | |
|---|---|
| Start Year | 2023 |
| Forecast Year | 2024-2032 |
| Start Value | $29.5 Billion |
| Forecast Value | $47.7 Billion |
| CAGR | 5.7% |
The recyclable cups market is also segmented by end-users into residential and commercial applications, with the commercial segment accounting for a dominant 95% share in 2023. This segment is expected to grow at a CAGR of 5.7% between 2024 and 2032. The growing bans on single-use plastics in sectors such as hospitality, food services, and events have accelerated the shift toward recyclable and reusable options. Businesses are adopting paper, bamboo fiber, and recyclable plastic cups as part of their commitment to sustainability and reducing environmental impact.
In the U.S., the recyclable cups market generated USD 9 billion in revenue in 2023 and is expected to experience a CAGR of 5.8% through 2032. The growth of this market is driven by heightened eco-consciousness among consumers, evolving government policies, increased demand within the food service industry, and improvements in recycling infrastructure. As sustainability becomes a priority for consumers, the demand for compostable and reusable cups made from paper, bamboo, and plant-based materials continues to rise. Regulatory measures that curb the use of single-use plastics are further propelling the market for eco-friendly alternatives.
Table of Contents
Chapter 1 Methodology & Scope
- 1.1 Market scope & definitions
- 1.2 Base estimates & calculations
- 1.3 Forecast calculations.
- 1.4 Data sources
- 1.4.1 Primary
- 1.4.2 Secondary
- 1.4.2.1 Paid sources
- 1.4.2.2 Public sources
Chapter 2 Executive Summary
- 2.1 Industry synopsis, 2021-2032
Chapter 3 Industry Insights
- 3.1 Industry ecosystem analysis
- 3.1.1 Factor affecting the value chain.
- 3.1.2 Profit margin analysis.
- 3.1.3 Disruptions
- 3.1.4 Future outlook
- 3.1.5 Manufacturers
- 3.1.6 Distributors
- 3.2 Supplier landscape
- 3.3 Profit margin analysis.
- 3.4 Key news & initiatives
- 3.5 Regulatory landscape
- 3.6 Impact forces
- 3.6.1 Growth drivers
- 3.6.1.1 Increased environmental awareness
- 3.6.1.2 Consumer demand for eco-friendly products
- 3.6.2 Industry pitfalls & challenges
- 3.6.2.1 Competition from other eco-friendly alternatives
- 3.6.2.2 Competition from traditional plastics
- 3.6.1 Growth drivers
- 3.7 Consumer buying behavior analysis
- 3.8 Growth potential analysis
- 3.9 Porter’s analysis
- 3.10 PESTEL analysis
Chapter 4 Competitive Landscape, 2023
- 4.1 Introduction
- 4.2 Company market share analysis
- 4.3 Competitive positioning matrix
- 4.4 Strategic outlook matrix
Chapter 5 Market Estimates & Forecast, By Material Type, 2021-2032 (USD Billion) (Million Units)
- 5.1 Key trends
- 5.2 Paper cups
- 5.2.1 Coated cups
- 5.2.2 Non-coated cups
- 5.3 Plastic cups
- 5.4 Metal cups
- 5.5 Glass cups
- 5.6 Bamboo fiber cups
- 5.7 Others (composite cups, foam cups, etc.)
Chapter 6 Market Estimates & Forecast, By Capacity, 2021-2032 (USD Billion) (Million Units)
- 6.1 Key trends
- 6.2 Up to 10 oz
- 6.3 10 to 15 oz
- 6.4 Above 15 oz
Chapter 7 Market Estimates & Forecast, By Price, 2021-2032 (USD Billion) (Million Units)
- 7.1 Key trends
- 7.2 Low
- 7.3 Medium
- 7.4 High
Chapter 8 Market Estimates & Forecast, By Application, 2021-2032 (USD Billion) (Million Units)
- 8.1 Key trends
- 8.2 Hot beverages
- 8.3 Cold beverages
Chapter 9 Market Estimates & Forecast, By End Use, 2021-2032 (USD Billion) (Million Units)
- 9.1 Key trends
- 9.2 Residential
- 9.3 Commercial
- 9.3.1 Food & beverage
- 9.3.2 Hotels and cafes
- 9.3.3 Hospitality and events
- 9.3.4 Others (quick-service restaurants etc.)
Chapter 10 Market Estimates & Forecast, By Distribution Channel, 2021-2032 (USD Billion) (Million Units)
- 10.1 Key trends
- 10.2 Direct sales
- 10.3 Indirect sales
Chapter 11 Market Estimates & Forecast, By Region, 2021-2032 (USD Billion) (Million Units)
- 11.1 Key trends
- 11.2 North America
- 11.2.1 U.S.
- 11.2.2 Canada
- 11.3 Europe
- 11.3.1 UK
- 11.3.2 Germany
- 11.3.3 France
- 11.3.4 Italy
- 11.3.5 Spain
- 11.3.6 Russia
- 11.4 Asia Pacific
- 11.4.1 China
- 11.4.2 India
- 11.4.3 Japan
- 11.4.4 South Korea
- 11.4.5 Australia
- 11.5 Latin America
- 11.5.1 Brazil
- 11.5.2 Mexico
- 11.6 MEA
- 11.6.1 UAE
- 11.6.2 Saudi Arabia
- 11.6.3 South Africa
Chapter 12 Company Profiles
- 12.1 Ball
- 12.2 Benders Paper Cups
- 12.3 Berry Global
- 12.4 BioCup
- 12.5 Dart Container
- 12.6 Detmold
- 12.7 EcoSoul
- 12.8 Georgia-Pacific
- 12.9 Golden Paper Cups
- 12.10 Green Paper Products
- 12.11 Huhtamaki
- 12.12 Nippon Paper
- 12.13 Pactiv
- 12.14 SogreenPack
- 12.15 Solo Cup Company
 全球杯子和蓋子市場(2025 年)
 一次性紙杯市場規模、佔有率、趨勢分析報告:按產品、最終用途、地區、細分市場預測,2025-2030 年
 一次性杯子市場規模、佔有率、成長分析、按材料類型、按產能、按分銷管道、按應用、按最終用戶、按地區 - 行業預測,2025-2032 年
 杯子和蓋子:市場佔有率分析、行業趨勢和統計、成長預測(2025-2030 年)
 可回收杯市場按材料、數量、最終用戶和地區分類
 一次性杯子市場:按材料類型、設計、應用和最終用戶分類 - 2025-2030 年全球預測
 全球雙壁熱杯市場:按類型、應用、最終用戶、材料、隔熱類型 - 預測 2025-2030
 2024 年杯蓋包裝全球市場報告
 2024-2028年全球杯蓋市場
 全球一次性杯子市場研究報告 - 2024 年至 2032 年行業分析、規模、佔有率、成長、趨勢和預測