


 |
市場調查報告書
商品編碼
1665045
電動車牽引逆變器市場機會、成長動力、產業趨勢分析及 2025 - 2034 年預測EV Traction Inverter Market Opportunity, Growth Drivers, Industry Trend Analysis, and Forecast 2025 - 2034 |
||||||
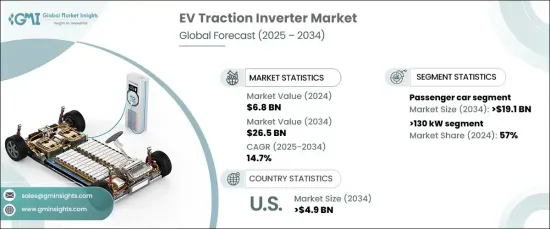
2024 年全球電動車牽引逆變器市場價值為 68 億美元,預計 2025 年至 2034 年期間將以 14.7% 的強勁複合年成長率成長。 全球範圍內電動汽車 (EV) 的普及率激增是該市場成長的主要驅動力,因為各國政府都在推廣電動車 (ICE) 的更永續、更內燃機、更永續汽車和電動汽車。這些努力旨在大幅減少溫室氣體排放並應對氣候變遷的迫切挑戰。
電力電子技術的進步正在徹底改變牽引逆變器的性能和效率。碳化矽和氮化鎵等寬頻隙半導體等突破性創新正在實現更高的能源效率、更好的熱管理和更緊湊的設計。這些技術對於滿足日益成長的延長行駛里程、更快充電時間和卓越車輛性能的需求至關重要,因此在快速發展的電動車產業中不可或缺。
| 市場範圍 | |
|---|---|
| 起始年份 | 2024 |
| 預測年份 | 2025-2034 |
| 起始值 | 68億美元 |
| 預測值 | 265億美元 |
| 複合年成長率 | 14.7% |
根據車輛類型,市場分為乘用車和商用車。 2024 年,乘用車市場佔據市場主導地位,佔總佔有率的 73%,預計到 2034 年將創造 191 億美元的市場價值。由於市場規模更大、產量更高,乘用車轉型為電動車的速度比商用車更快。
根據輸出功率,電動車牽引逆變器市場分為 <= 130 kW 和 >130 kW 兩部分。受高性能電動車日益成長的偏好以及重型商用車隊的電氣化推動,130 kW 以上的細分市場將在 2024 年佔據 57% 的市場佔有率。高功率逆變器對於提供卓越的扭力、加速和擴大續航里程至關重要,可滿足高階電動車和嚴苛的商業應用的需求。這些先進的逆變器經過精心設計,可在高性能條件下高效運行,確保可靠性和最佳能源利用率。
美國電動車牽引逆變器市場在 2024 年佔據 83% 的佔有率,預計到 2034 年將達到 49 億美元。此外,對電動車生產和牽引逆變器等關鍵零件開發的大量投資正在推動市場的成長軌跡。
目錄
第 1 章:方法論與範圍
- 研究設計
- 研究方法
- 資料收集方法
- 基礎估計和計算
- 基準年計算
- 市場估計的主要趨勢
- 預測模型
- 初步研究與驗證
- 主要來源
- 資料探勘來源
- 市場定義
第 2 章:執行摘要
第 3 章:產業洞察
- 產業生態系統分析
- 技術提供者
- 零件供應商
- 製造商
- 原始設備製造商
- 供應商概況
- 利潤率分析
- 技術與創新格局
- 重要新聞及舉措
- 監管格局
- 衝擊力
- 成長動力
- 電動車(EV)的普及率不斷提高
- 電力電子技術的進步
- 商用車電氣化
- 增加對充電基礎設施的投資
- 產業陷阱與挑戰
- 電動車及其零件的初始成本高
- 技術複雜性與熱管理
- 成長動力
- 成長潛力分析
- 波特的分析
- PESTEL 分析
第4章:競爭格局
- 介紹
- 公司市佔率分析
- 競爭定位矩陣
- 戰略展望矩陣
第 5 章:市場估計與預測:按推進方式,2021 - 2034 年
- 主要趨勢
- 純電動車
- 油電混合車
- 插電式混合動力汽車
第6章:市場估計與預測:按輸出功率,2021 - 2034 年
- 主要趨勢
- <=130千瓦
- >130 千瓦
第 7 章:市場估計與預測:按技術,2021 - 2034 年
- 主要趨勢
- 絕緣柵雙極電晶體
- 場效電晶體
第 8 章:市場估計與預測:依半導體材料,2021 - 2034 年
- 主要趨勢
- 氮化鎵
- 矽
- 碳化矽
第 9 章:市場估計與預測:按車型,2021 - 2034 年
- 主要趨勢
- 搭乘用車
- 商用車
第 10 章:市場估計與預測:按地區,2021 - 2034 年
- 主要趨勢
- 北美洲
- 美國
- 加拿大
- 歐洲
- 英國
- 德國
- 法國
- 西班牙
- 義大利
- 俄羅斯
- 北歐
- 亞太地區
- 中國
- 印度
- 日本
- 韓國
- 澳新銀行
- 東南亞
- 拉丁美洲
- 巴西
- 墨西哥
- 阿根廷
- 中東及非洲
- 阿拉伯聯合大公國
- 南非
- 沙烏地阿拉伯
第 11 章:公司簡介
- BorgWarner Inc.
- Continental AG
- DENSO Corporation
- Drive System Design Ltd
- Eaton Corporation
- Hitachi Astemo Ltd
- Hyundai Mobis Co. Ltd.
- Infineon Technologies AG
- John Deere Electronic Solutions
- Lear Corporation
- LG Magna e-Powertrain
- Marelli Corporation
- Meidensha Corporation
- Mitsubishi Electric Corporation
- Robert Bosch GmbH
- Tesla, Inc.
- Toyota Industries Corporation
- Valeo SA
- Vitesco Technologies
- ZF Friedrichshafen AG
The Global EV Traction Inverter Market was valued at USD 6.8 billion in 2024 and is projected to expand at a robust CAGR of 14.7% from 2025 to 2034. The surging adoption of electric vehicles (EVs) worldwide is a key driver of this market growth, as governments promote EVs as a cleaner and more sustainable alternative to internal combustion engine (ICE) vehicles. These efforts aim to significantly reduce greenhouse gas emissions and tackle the pressing challenges of climate change.
Advancements in power electronics are revolutionizing traction inverter performance and efficiency. Breakthrough innovations, such as wide-bandgap semiconductors like silicon carbide and gallium nitride, are enabling greater energy efficiency, improved thermal management, and more compact designs. These technologies are critical for addressing the growing demand for extended driving ranges, faster charging times, and superior vehicle performance, making them indispensable in the rapidly evolving EV industry.
| Market Scope | |
|---|---|
| Start Year | 2024 |
| Forecast Year | 2025-2034 |
| Start Value | $6.8 Billion |
| Forecast Value | $26.5 Billion |
| CAGR | 14.7% |
By vehicle type, the market is divided into passenger cars and commercial vehicles. In 2024, the passenger car segment led the market, accounting for 73% of the total share, and is projected to generate USD 19.1 billion by 2034. This growth is propelled by the increasing use of EVs for personal transportation, spurred by heightened environmental consciousness, government incentives, and volatile fuel prices. Passenger cars are transitioning to electric mobility at a faster pace than commercial vehicles, thanks to their larger market base and higher production volumes.
Based on output power, the EV traction inverter market is categorized into <=130 kW and >130 kW segments. The >130 kW segment held 57% of the market share in 2024, driven by the rising preference for high-performance EVs and the electrification of heavy-duty commercial fleets. High-powered inverters are crucial for delivering exceptional torque, acceleration, and extended range, catering to the needs of premium EVs and demanding commercial applications. These advanced inverters are engineered to operate efficiently under high-performance conditions, ensuring reliability and optimal energy utilization.
The U.S. EV traction inverter market dominated with an 83% share in 2024 and is projected to reach USD 4.9 billion by 2034. The country's well-established EV manufacturing ecosystem and growing consumer demand are key factors fueling this expansion. Additionally, significant investments in EV production and the development of critical components, including traction inverters, are bolstering the market growth trajectory.
Table of Contents
Chapter 1 Methodology & Scope
- 1.1 Research design
- 1.1.1 Research approach
- 1.1.2 Data collection methods
- 1.2 Base estimates and calculations
- 1.2.1 Base year calculation
- 1.2.2 Key trends for market estimates
- 1.3 Forecast model
- 1.4 Primary research & validation
- 1.4.1 Primary sources
- 1.4.2 Data mining sources
- 1.5 Market definition
Chapter 2 Executive Summary
- 2.1 Industry synopsis, 2021 - 2034
Chapter 3 Industry Insights
- 3.1 Industry ecosystem analysis
- 3.1.1 Technology providers
- 3.1.2 Component suppliers
- 3.1.3 Manufacturers
- 3.1.4 OEMs
- 3.2 Supplier landscape
- 3.3 Profit margin analysis
- 3.4 Technology & innovation landscape
- 3.5 Key news & initiatives
- 3.6 Regulatory landscape
- 3.7 Impact forces
- 3.7.1 Growth drivers
- 3.7.1.1 Growing adoption of electric vehicles (EV)
- 3.7.1.2 Advancements in power electronics technology
- 3.7.1.3 Electrification of commercial vehicles
- 3.7.1.4 Increasing investments in charging infrastructure
- 3.7.2 Industry pitfalls & challenges
- 3.7.2.1 High initial costs of EV and components
- 3.7.2.2 Technical complexity and thermal management
- 3.7.1 Growth drivers
- 3.8 Growth potential analysis
- 3.9 Porter’s analysis
- 3.10 PESTEL analysis
Chapter 4 Competitive Landscape, 2024
- 4.1 Introduction
- 4.2 Company market share analysis
- 4.3 Competitive positioning matrix
- 4.4 Strategic outlook matrix
Chapter 5 Market Estimates & Forecast, By Propulsion, 2021 - 2034 ($Mn, Units)
- 5.1 Key trends
- 5.2 BEV
- 5.3 HEV
- 5.4 PHEV
Chapter 6 Market Estimates & Forecast, By Output Power, 2021 - 2034 ($Mn, Units)
- 6.1 Key trends
- 6.2 <=130 kW
- 6.3 >130 kW
Chapter 7 Market Estimates & Forecast, By Technology, 2021 - 2034 ($Mn, Units)
- 7.1 Key trends
- 7.2 IGBT
- 7.3 MOSFET
Chapter 8 Market Estimates & Forecast, By Semiconductor Material, 2021 - 2034 ($Mn, Units)
- 8.1 Key trends
- 8.2 GaN
- 8.3 Si
- 8.4 SiC
Chapter 9 Market Estimates & Forecast, By Vehicle, 2021 - 2034 ($Mn, Units)
- 9.1 Key trends
- 9.2 Passenger car
- 9.3 Commercial vehicle
Chapter 10 Market Estimates & Forecast, By Region, 2021 - 2034 ($Mn, Units)
- 10.1 Key trends
- 10.2 North America
- 10.2.1 U.S.
- 10.2.2 Canada
- 10.3 Europe
- 10.3.1 UK
- 10.3.2 Germany
- 10.3.3 France
- 10.3.4 Spain
- 10.3.5 Italy
- 10.3.6 Russia
- 10.3.7 Nordics
- 10.4 Asia Pacific
- 10.4.1 China
- 10.4.2 India
- 10.4.3 Japan
- 10.4.4 South Korea
- 10.4.5 ANZ
- 10.4.6 Southeast Asia
- 10.5 Latin America
- 10.5.1 Brazil
- 10.5.2 Mexico
- 10.5.3 Argentina
- 10.6 MEA
- 10.6.1 UAE
- 10.6.2 South Africa
- 10.6.3 Saudi Arabia
Chapter 11 Company Profiles
- 11.1 BorgWarner Inc.
- 11.2 Continental AG
- 11.3 DENSO Corporation
- 11.4 Drive System Design Ltd
- 11.5 Eaton Corporation
- 11.6 Hitachi Astemo Ltd
- 11.7 Hyundai Mobis Co. Ltd.
- 11.8 Infineon Technologies AG
- 11.9 John Deere Electronic Solutions
- 11.10 Lear Corporation
- 11.11 LG Magna e-Powertrain
- 11.12 Marelli Corporation
- 11.13 Meidensha Corporation
- 11.14 Mitsubishi Electric Corporation
- 11.15 Robert Bosch GmbH
- 11.16 Tesla, Inc.
- 11.17 Toyota Industries Corporation
- 11.18 Valeo SA
- 11.19 Vitesco Technologies
- 11.20 ZF Friedrichshafen AG
 電動汽車電池測試市場機會、成長動力、產業趨勢分析及 2025-2034 年預測
 中東及非洲電動車電池負極市場佔有率分析、產業趨勢及成長預測(2025-2030)
 按產品、車輛類型、應用、國家和地區分類的電動汽車記憶體市場:2024-2032 年產業分析、市場規模、市場佔有率和預測汽車電流感測器市場機會、成長動力、產業趨勢分析和 2024 年至 2032 年預測
 電動汽車熱泵系統市場規模和預測、全球和地區佔有率、趨勢和成長機會分析報告範圍:按推進類型、組件、車輛類型和地理位置全球電動汽車零件市場評估:依車輛類型、零件類型、通路、地區、機會、預測(2017-2031)
 到 2030 年電動車零件市場預測:按電動車類型、零件、最終用戶和地區分類的全球分析
 電動車工程塑膠市場 - 全球規模、佔有率、趨勢分析、機會、預測報告,2019-2030
 全球電動車零件市場:市場規模和佔有率分析(依零件和最終用途)、行業收入估算和需求預測(截至 2030 年)
 電動車零件市場 - 2018-2028 年全球產業規模、佔有率、趨勢、機會與預測,按車輛類型、推進類型、零件類型、地區、競爭細分