

 |
市場調查報告書
商品編碼
1665061
加油站設備市場機會、成長動力、產業趨勢分析與預測 2024 - 2032Gas Station Equipment Market Opportunity, Growth Drivers, Industry Trend Analysis, and Forecast 2024 - 2032 |
||||||
2023 年全球加油站設備市場價值為 71 億美元,預計將實現穩步成長,2024 年至 2032 年期間的複合年成長率為 4.7%。隨著對減少碳排放的關注度不斷提高,人們明顯轉向使用替代燃料,例如壓縮天然氣(CNG)、氫氣和電動車(EV)充電站。這種轉變促使加油站業者採用先進的加油設備、創新的儲存系統和整合軟體解決方案來實現基礎設施的現代化,以滿足消費者不斷變化的偏好。
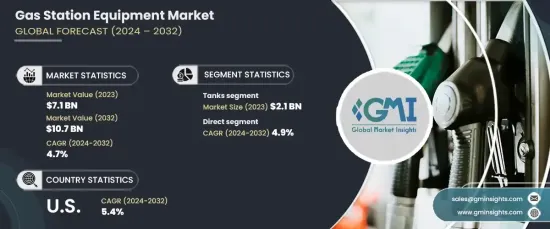
市場按類型細分為油箱、加油機、噴嘴、泵浦、軟管、輪胎充氣機、便利商店 (C-store) 設備和其他相關產品。其中,坦克佔最大佔有率,2023 年貢獻 21 億美元。油箱對於燃料的儲存和安全至關重要,是任何加油站運作的重要組成部分。他們確保遵守法規和降低環境風險的能力增強了他們在市場上的主導地位。
| 市場範圍 | |
|---|---|
| 起始年份 | 2023 |
| 預測年份 | 2024-2032 |
| 起始值 | 71億美元 |
| 預測值 | 107億美元 |
| 複合年成長率 | 4.7% |
就分銷通路而言,市場分為直接分銷和間接分銷。直接分銷管道在 2023 年佔據市場主導地位,佔有 52.6% 的佔有率,預計到 2032 年將以 4.9% 的複合年成長率成長。這種方法可以提供客製化解決方案、更快交付和更好的售後服務。此外,它還為製造商提供即時回饋,從而不斷改進並提高客戶滿意度。
美國加油站設備市場在 2023 年創造了 14 億美元的收入,預計到 2032 年將以 5.4% 的強勁複合年成長率成長。對尖端加油技術的持續投資以及電動車充電網路的擴展將進一步推動其市場成長。
目錄
第 1 章:方法論與範圍
- 市場範圍和定義
- 基礎估算與計算
- 預測參數
- 資料來源
- 基本的
- 次要
- 付費來源
- 公共資源
第 2 章:執行摘要
第 3 章:產業洞察
- 產業生態系統分析
- 影響價值鏈的因素
- 利潤率分析
- 中斷
- 未來展望
- 製造商
- 經銷商
- 供應商概況
- 利潤率分析
- 重要新聞及舉措
- 監管格局
- 技術格局
- 衝擊力
- 成長動力
- 替代燃料和電動車充電基礎設施的採用日益增多。
- 燃料分配和自動化系統的技術進步。
- 對節能環保設備的需求不斷增加。
- 擴大交通網路和都市化
- 產業陷阱與挑戰
- 初期投資及維護成本較高。
- 法規遵從性和環境問題
- 成長動力
- 成長潛力分析
- 波特的分析
- PESTEL 分析
第4章:競爭格局
- 介紹
- 公司市佔率分析
- 競爭定位矩陣
- 戰略展望矩陣
第 5 章:市場估計與預測:按類型,2021 – 2032 年
- 主要趨勢
- 坦克
- 加油機
- 噴嘴
- 泵浦
- 軟管
- 輪胎充氣機
- 便利商店設備
- 其他(泵浦過濾器等)
第6章:市場估計與預測:依燃料類型,2021 – 2032 年
- 主要趨勢
- 汽油
- 柴油引擎
- 生物燃料
- 壓縮天然氣(CNG)
- 液化天然氣(LNG)
- 氫氣燃料
- 其他
第 7 章:市場估計與預測:依最終用途,2021 年至 2032 年
- 主要趨勢
- 零售加油站
- 商業船隊
- 航空
- 海洋
- 軍隊
第 8 章:市場估計與預測:按配銷通路,2021 年至 2032 年
- 主要趨勢
- 直接的
- 間接
第 9 章:市場估計與預測:按地區,2021 年至 2032 年
- 主要趨勢
- 北美洲
- 美國
- 加拿大
- 歐洲
- 英國
- 德國
- 法國
- 義大利
- 西班牙
- 亞太地區
- 中國
- 日本
- 印度
- 澳洲
- 拉丁美洲
- 巴西
- 墨西哥
- 中東及非洲
- 南非
- 沙烏地阿拉伯
- 阿拉伯聯合大公國
第10章:公司簡介
- Beijing Sanki Petroleum Technology
- Bennett Pump Company
- Censtar Science and Technology Corp. Ltd.
- China Hongyang
- Dover Corporation
- Franklin Fueling Systems
- Gilbarco Veeder-Root
- Jiangsu Furen Group
- Korea EnE Co. Ltd.
- Peltek
- Tatsuno Corporation
- Tokheim Group
- U-Fuel Corporate HongYang Group
- VeriFone
- Wayne Fueling Systems
The Global Gas Station Equipment Market was valued at USD 7.1 billion in 2023 and is expected to experience steady growth, expanding at a CAGR of 4.7% from 2024 to 2032. This growth is being driven by the increasing demand for advanced fueling systems and energy-efficient technologies. As the focus on reducing carbon emissions intensifies, there has been a marked shift toward alternative fuels such as compressed natural gas (CNG), hydrogen, and electric vehicle (EV) charging stations. This transition is prompting gas station operators to modernize their infrastructure with cutting-edge dispensing equipment, innovative storage systems, and integrated software solutions to meet the changing preferences of consumers.
The market is segmented by type into tanks, fuel dispensers, nozzles, pumps, hoses, tire inflators, convenience store (C-store) equipment, and other related products. Among these, tanks hold the largest share, contributing USD 2.1 billion in 2023. They are projected to grow at a CAGR of 4.6% over the forecast period. Tanks are crucial for fuel storage and safety, making them an essential part of any gas station operation. Their ability to ensure compliance with regulations and minimize environmental risks reinforces their dominance in the market.
| Market Scope | |
|---|---|
| Start Year | 2023 |
| Forecast Year | 2024-2032 |
| Start Value | $7.1 Billion |
| Forecast Value | $10.7 Billion |
| CAGR | 4.7% |
In terms of distribution channels, the market is divided into direct and indirect segments. The direct segment led the market in 2023, holding a 52.6% share, and is expected to grow at a CAGR of 4.9% through 2032. Direct distribution channels are favored due to their ability to create stronger relationships between manufacturers and end-users. This approach allows for tailored solutions, faster delivery, and better after-sales service. Additionally, it provides manufacturers with real-time feedback, allowing for continuous improvement and enhanced customer satisfaction.
The U.S. gas station equipment market generated USD 1.4 billion in 2023 and is forecast to grow at a robust CAGR of 5.4% through 2032. The country's well-established fueling infrastructure and high vehicle ownership rates contribute to its dominant market position. Ongoing investments in cutting-edge fueling technologies, along with the expansion of EV charging networks, will further boost its market growth.
Table of Contents
Chapter 1 Methodology & Scope
- 1.1 Market scope & definition
- 1.2 Base estimates & calculations
- 1.3 Forecast parameters
- 1.4 Data sources
- 1.4.1 Primary
- 1.5 Secondary
- 1.5.1 Paid sources
- 1.5.2 Public sources
Chapter 2 Executive Summary
- 2.1 Industry synopsis, 2021 - 2032
Chapter 3 Industry Insights
- 3.1 Industry ecosystem analysis
- 3.1.1 Factor affecting the value chain
- 3.1.2 Profit margin analysis
- 3.1.3 Disruptions
- 3.1.4 Future outlook
- 3.1.5 Manufacturers
- 3.1.6 Distributors
- 3.2 Supplier landscape
- 3.3 Profit margin analysis
- 3.4 Key news & initiatives
- 3.5 Regulatory landscape
- 3.6 Technological landscape
- 3.7 Impact forces
- 3.7.1 Growth drivers
- 3.7.1.1 Increasing adoption of alternative fuels and EV charging infrastructure.
- 3.7.1.2 Technological advancements in fuel dispensing and automation systems.
- 3.7.1.3 Rising demand for energy-efficient and eco-friendly equipment.
- 3.7.1.4 Expanding transportation networks and urbanization
- 3.7.2 Industry pitfalls & challenges
- 3.7.2.1 High initial investment and maintenance costs.
- 3.7.2.2 Regulatory compliance and environmental concerns
- 3.7.1 Growth drivers
- 3.8 Growth potential analysis
- 3.9 Porter’s analysis
- 3.10 PESTEL analysis
Chapter 4 Competitive Landscape, 2023
- 4.1 Introduction
- 4.2 Company market share analysis
- 4.3 Competitive positioning matrix
- 4.4 Strategic outlook matrix
Chapter 5 Market Estimates and Forecast, By Type, 2021 – 2032 (USD Billion) (Thousand units)
- 5.1 Key trends
- 5.2 Tanks
- 5.3 Fuel dispensers
- 5.4 Nozzles
- 5.5 Pumps
- 5.6 Hoses
- 5.7 Tire inflators
- 5.8 C-Store equipment
- 5.9 Others (pump filters, etc.)
Chapter 6 Market Estimates and Forecast, By Fuel Type, 2021 – 2032 (USD Billion) (Thousand units)
- 6.1 Key trends
- 6.2 Gasoline
- 6.3 Diesel
- 6.4 Biofuel
- 6.5 Compressed Natural Gas (CNG)
- 6.6 Liquefied Natural Gas (LNG)
- 6.7 Hydrogen fueling
- 6.8 Others
Chapter 7 Market Estimates and Forecast, By End Use, 2021 – 2032 (USD Billion) (Thousand units)
- 7.1 Key trends
- 7.2 Retail gas stations
- 7.3 Commercial fleets
- 7.4 Aviation
- 7.5 Marine
- 7.6 Military
Chapter 8 Market Estimates & Forecast, By Distribution Channel, 2021 – 2032, (USD Billion) (Thousand units)
- 8.1 Key trends
- 8.2 Direct
- 8.3 Indirect
Chapter 9 Market Estimates & Forecast, By Region, 2021 – 2032, (USD Billion) (Thousand units)
- 9.1 Key trends
- 9.2 North America
- 9.2.1 U.S.
- 9.2.2 Canada
- 9.3 Europe
- 9.3.1 UK
- 9.3.2 Germany
- 9.3.3 France
- 9.3.4 Italy
- 9.3.5 Spain
- 9.4 Asia Pacific
- 9.4.1 China
- 9.4.2 Japan
- 9.4.3 India
- 9.4.4 Australia
- 9.5 Latin America
- 9.5.1 Brazil
- 9.5.2 Mexico
- 9.6 MEA
- 9.6.1 South Africa
- 9.6.2 Saudi Arabia
- 9.6.3 UAE
Chapter 10 Company Profiles (Business Overview, Financial Data, Product Landscape, Strategic Outlook, SWOT Analysis)
- 10.1 Beijing Sanki Petroleum Technology
- 10.2 Bennett Pump Company
- 10.3 Censtar Science and Technology Corp. Ltd.
- 10.4 China Hongyang
- 10.5 Dover Corporation
- 10.6 Franklin Fueling Systems
- 10.7 Gilbarco Veeder-Root
- 10.8 Jiangsu Furen Group
- 10.9 Korea EnE Co. Ltd.
- 10.10 Peltek
- 10.11 Tatsuno Corporation
- 10.12 Tokheim Group
- 10.13 U-Fuel Corporate HongYang Group
- 10.14 VeriFone
- 10.15 Wayne Fueling Systems
 汽油燃料,2025-2029 年全球市場
 2033 年加油站市場分析及預測:按類型、產品、服務、技術、組件、應用、形式、部署和最終用戶
 加油站設備市場:依產品、應用分類 - 2025-2030 年全球預測
 2024年加油站設備全球市場報告
 電子汽油市場、機會、成長動力、產業趨勢分析與預測,2024-2032
 2024-2028年全球加油站設備市場
 加油站設備市場(類型:油箱、加油機、噴嘴、泵浦、軟管、輪胎充氣機、便利商店設備等)- 2024-2034 年全球產業分析、規模、佔有率、成長、趨勢與預測
 MTG (Methanol-to-Gasoline) 的全球市場:市場佔有率及排行榜·整體銷售額及需求預測 (2024-2030年)
 2024 年世界汽油市場報告
 車庫和服務站市場規模 - 按產品類型、所有權、業務結構和預測,2023 年 - 2032 年