


 |
市場調查報告書
商品編碼
1665253
先進公共運輸系統 (APTS) 市場機會、成長動力、產業趨勢分析與 2025 - 2034 年預測Advanced Public Transportation System (APTS) Market Opportunity, Growth Drivers, Industry Trend Analysis, and Forecast 2025 - 2034 |
||||||
2024 年全球先進公共交通系統市場價值為 64 億美元,預計將經歷令人矚目的成長,2025 年至 2034 年的複合年成長率為 8.3%。這項擴張背後的關鍵因素是對智慧城市日益成長的需求,智慧城市優先減少碳排放、提高公共交通效率並提供創新解決方案以增強城市流動性。
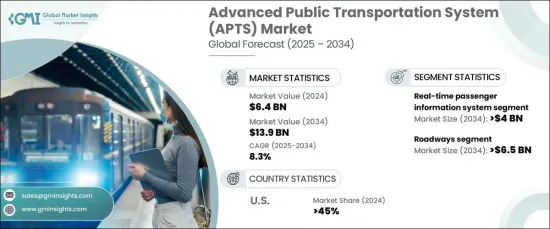
APTS 市場涵蓋多個技術驅動領域,包括即時乘客資訊系統、自動車輛定位 (AVL)、電腦輔助調度、電子支付系統 (EPS) 和乘客資訊系統 (PIS)。其中,即時乘客資訊系統領域在 2024 年佔據 30% 的主導佔有率,預計到 2034 年將產生 40 億美元的收入。透過分析歷史數據和即時資料,這些系統可以預測需求、最佳化運輸路線、識別擁塞熱點,最終提高服務交付和效率。
| 市場範圍 | |
|---|---|
| 起始年份 | 2024 |
| 預測年份 | 2025-2034 |
| 起始值 | 64億美元 |
| 預測值 | 139億美元 |
| 複合年成長率 | 8.3% |
就運輸方式而言,APTS市場分為公路運輸、鐵路運輸、航空運輸及水路運輸。在幾個新興趨勢的推動下,公路部門預計到 2034 年將達到 65 億美元。許多城市正在投資專為自動公共交通設計的道路,配備專用車道、先進的感測器網路和智慧交通系統。這些智慧走廊專為優先考慮公車和班車等自動駕駛汽車而設計,整合車輛到基礎設施 (V2I) 通訊,以緩解交通堵塞、提高安全性並確保更可預測的旅行時間。這種尖端技術與周到的城市規劃的整合旨在簡化交通運輸並提高交通系統的整體效率。
在美國,APTS 市場在 2024 年佔據了 45% 的顯著佔有率。這些人工智慧班車有助於解決勞動力短缺問題、降低營運成本並提高安全性和效率。美國著名的科技中心處於這項創新的前沿,致力於最大限度地減少人為錯誤並推動智慧城市交通基礎設施的發展。這種集中的努力使得美國在全球 APTS 市場佔據主導地位。
目錄
第 1 章:方法論與範圍
- 研究設計
- 研究方法
- 資料收集方法
- 基礎估計和計算
- 基準年計算
- 市場估計的主要趨勢
- 預測模型
- 初步研究與驗證
- 主要來源
- 資料探勘來源
- 市場定義
第 2 章:執行摘要
第 3 章:產業洞察
- 產業生態系統分析
- 供應商概況
- 大眾運輸業者
- 技術提供者
- 系統整合商
- 最終用戶
- 利潤率分析
- 技術差異化
- 即時資料分析
- 車輛與基礎設施通訊
- 電動和永續移動解決方案
- 非接觸式支付解決方案
- 其他
- 重要新聞及舉措
- 專利分析
- 監管格局
- 衝擊力
- 成長動力
- 城市交通擁擠加劇
- 公共交通車隊數位化的興起
- 政府的基礎建設投資
- 改變出行偏好
- 產業陷阱與挑戰
- 監管標準化挑戰
- 初期基礎建設投資高
- 成長動力
- 成長潛力分析
- 波特的分析
- PESTEL 分析
第4章:競爭格局
- 介紹
- 公司市佔率分析
- 競爭定位矩陣
- 戰略展望矩陣
第5章:市場估計與預測:按組件,2021 - 2034 年
- 主要趨勢
- 硬體
- 感應器
- 顯示面板
- 通訊設備
- 機載電腦
- 其他
- 軟體
- 服務
- 專業服務
- 託管服務
第6章:市場估計與預測:依技術,2021 - 2034 年
- 主要趨勢
- 即時乘客資訊系統
- 自動車輛定位 (AVL)
- 電腦輔助調度(CAD)
- 電子支付系統(EPS)
- 乘客資訊系統 (PIS)
第 7 章:市場估計與預測:按應用,2021 - 2034 年
- 主要趨勢
- 交通管理
- 車隊管理
- 乘客安全與保障
- 票務解決方案
- 公共資訊傳播
第 8 章:市場估計與預測:按運輸方式,2021 - 2034 年
- 主要趨勢
- 道路
- 鐵路
- 航空
- 水路
第 9 章:市場估計與預測:按地區,2021 - 2034 年
- 主要趨勢
- 北美洲
- 美國
- 加拿大
- 歐洲
- 英國
- 德國
- 法國
- 西班牙
- 義大利
- 俄羅斯
- 北歐
- 亞太地區
- 中國
- 印度
- 日本
- 韓國
- 澳新銀行
- 東南亞
- 拉丁美洲
- 巴西
- 墨西哥
- 阿根廷
- 中東及非洲
- 阿拉伯聯合大公國
- 南非
- 沙烏地阿拉伯
第10章:公司簡介
- Alstom
- Bombardier
- CAF
- Cisco
- Conduent Transportation
- CRRC
- Cubic Transportation Systems
- EasyMile
- Garmin
- Hitachi Rail
- Huawei
- Indra
- Kapsch
- New Flyer
- Parsons
- Raytheon
- Siemens
- Stadler
- Thales Group
- Transdev
- Trapeze
- Volvo
The Global Advanced Public Transportation System Market was valued at USD 6.4 billion in 2024 and is expected to experience impressive growth, with a CAGR of 8.3% from 2025 to 2034. This growth is largely driven by increasing government investments in smart transportation solutions and the shift toward sustainable urban mobility. A key factor behind this expansion is the growing demand for smarter cities, which prioritize reducing carbon emissions, improving public transport efficiency, and offering innovative solutions to enhance urban mobility.
The APTS market spans several technology-driven segments, including real-time passenger information systems, Automated Vehicle Location (AVL), computer-aided dispatch, Electronic Payment Systems (EPS), and Passenger Information Systems (PIS). Among these, the real-time passenger information systems segment held a dominant 30% share in 2024 and is projected to generate USD 4 billion by 2034. These advanced systems leverage artificial intelligence and machine learning to deliver predictive analytics, improving the passenger experience. By analyzing both historical and real-time data, these systems forecast demand, optimize transportation routes, and identify congestion hotspots, ultimately enhancing service delivery and efficiency.
| Market Scope | |
|---|---|
| Start Year | 2024 |
| Forecast Year | 2025-2034 |
| Start Value | $6.4 Billion |
| Forecast Value | $13.9 Billion |
| CAGR | 8.3% |
In terms of transportation modes, the APTS market is divided into roadways, railways, airways, and waterways. The roadways segment is expected to reach USD 6.5 billion by 2034, driven by several emerging trends. Many cities are investing in specialized roadways designed for autonomous public transport, equipped with dedicated lanes, advanced sensor networks, and intelligent traffic systems. These smart corridors are tailored to prioritize autonomous vehicles like buses and shuttles, integrating vehicle-to-infrastructure (V2I) communication to alleviate congestion, boost safety, and ensure more predictable travel times. This fusion of cutting-edge technology with thoughtful urban planning is set to streamline mobility and enhance the overall efficiency of transportation systems.
In the U.S., the APTS market held a significant 45% share in 2024. U.S. cities are leading the charge in deploying autonomous electric shuttle services, particularly in controlled environments such as airports, campuses, and business districts. These AI-powered shuttles are helping to address labor shortages, reduce operational costs, and improve both safety and efficiency. Prominent tech hubs in the U.S. are at the forefront of this innovation, focusing on minimizing human error and advancing the development of smart urban mobility infrastructure. This concentrated effort has positioned the U.S. as a dominant player in the global APTS market.
Table of Contents
Chapter 1 Methodology & Scope
- 1.1 Research design
- 1.1.1 Research approach
- 1.1.2 Data collection methods
- 1.2 Base estimates and calculations
- 1.2.1 Base year calculation
- 1.2.2 Key trends for market estimates
- 1.3 Forecast model
- 1.4 Primary research & validation
- 1.4.1 Primary sources
- 1.4.2 Data mining sources
- 1.5 Market definitions
Chapter 2 Executive Summary
- 2.1 Industry 3600 synopsis, 2021 - 2034
Chapter 3 Industry Insights
- 3.1 Industry ecosystem analysis
- 3.2 Supplier landscape
- 3.2.1 Public transportation operators
- 3.2.2 Technology providers
- 3.2.3 System integrators
- 3.2.4 End users
- 3.3 Profit margin analysis
- 3.4 Technology differentiators
- 3.4.1 Real-time data analytics
- 3.4.2 Vehicle-to-infrastructure communication
- 3.4.3 Electric and sustainable mobility solutions
- 3.4.4 Contactless payment solutions
- 3.4.5 Others
- 3.5 Key news & initiatives
- 3.6 Patent analysis
- 3.7 Regulatory landscape
- 3.8 Impact forces
- 3.8.1 Growth drivers
- 3.8.1.1 Growth in urban traffic congestion
- 3.8.1.2 Emerging digitization in public transportation fleets
- 3.8.1.3 Infrastructure investments by governments
- 3.8.1.4 Changing mobility preferences
- 3.8.2 Industry pitfalls & challenges
- 3.8.2.1 Regulatory standardization challenges
- 3.8.2.2 High initial infrastructure investment
- 3.8.1 Growth drivers
- 3.9 Growth potential analysis
- 3.10 Porter’s analysis
- 3.11 PESTEL analysis
Chapter 4 Competitive Landscape, 2024
- 4.1 Introduction
- 4.2 Company market share analysis
- 4.3 Competitive positioning matrix
- 4.4 Strategic outlook matrix
Chapter 5 Market Estimates & Forecast, By Component, 2021 - 2034 ($Bn)
- 5.1 Key trends
- 5.2 Hardware
- 5.2.1 Sensors
- 5.2.2 Display panels
- 5.2.3 Communication devices
- 5.2.4 Onboard computers
- 5.2.5 Others
- 5.3 Software
- 5.4 Services
- 5.4.1 Professional services
- 5.4.2 Managed services
Chapter 6 Market Estimates & Forecast, By Technology, 2021 - 2034 ($Bn)
- 6.1 Key trends
- 6.2 Real-time passenger information system
- 6.3 Automated Vehicle Location (AVL)
- 6.4 Computer-aided dispatch (CAD)
- 6.5 Electronic Payment Systems (EPS)
- 6.6 Passenger Information Systems (PIS)
Chapter 7 Market Estimates & Forecast, By Application, 2021 - 2034 ($Bn)
- 7.1 Key trends
- 7.2 Traffic management
- 7.3 Fleet management
- 7.4 Passenger safety & security
- 7.5 Ticketing solutions
- 7.6 Public information dissemination
Chapter 8 Market Estimates & Forecast, By Mode of Transportation, 2021 - 2034 ($Bn)
- 8.1 Key trends
- 8.2 Roadways
- 8.3 Railways
- 8.4 Airways
- 8.5 Waterways
Chapter 9 Market Estimates & Forecast, By Region, 2021 - 2034 ($Bn)
- 9.1 Key trends
- 9.2 North America
- 9.2.1 U.S.
- 9.2.2 Canada
- 9.3 Europe
- 9.3.1 UK
- 9.3.2 Germany
- 9.3.3 France
- 9.3.4 Spain
- 9.3.5 Italy
- 9.3.6 Russia
- 9.3.7 Nordics
- 9.4 Asia Pacific
- 9.4.1 China
- 9.4.2 India
- 9.4.3 Japan
- 9.4.4 South Korea
- 9.4.5 ANZ
- 9.4.6 Southeast Asia
- 9.5 Latin America
- 9.5.1 Brazil
- 9.5.2 Mexico
- 9.5.3 Argentina
- 9.6 MEA
- 9.6.1 UAE
- 9.6.2 South Africa
- 9.6.3 Saudi Arabia
Chapter 10 Company Profiles
- 10.1 Alstom
- 10.2 Bombardier
- 10.3 CAF
- 10.4 Cisco
- 10.5 Conduent Transportation
- 10.6 CRRC
- 10.7 Cubic Transportation Systems
- 10.8 EasyMile
- 10.9 Garmin
- 10.10 Hitachi Rail
- 10.11 Huawei
- 10.12 Indra
- 10.13 Kapsch
- 10.14 New Flyer
- 10.15 Parsons
- 10.16 Raytheon
- 10.17 Siemens
- 10.18 Stadler
- 10.19 Thales Group
- 10.20 Transdev
- 10.21 Trapeze
- 10.22 Volvo
 2025 年金融服務高階身分驗證全球市場報告
 2025 年至 2033 年進階身分驗證市場報告(依身分驗證方法、部署、解決方案、最終使用者產業和地區分類)
 高級認證-市場佔有率分析、行業趨勢和統計、成長預測(2025-2030 年)
 快速身份線上市場:按產品、通訊協定、部署、應用程式、最終用戶分類 - 2025-2030 年全球預測
 高階身分驗證市場:按類型、公司規模、最終用戶分類 - 2025-2030 年全球預測
 高級認證的全球市場 2024-2028
 高級身份驗證市場 - 2018-2028 年按身份驗證方法、最終用戶行業、地區、競爭細分的全球行業規模、佔有率、趨勢、機會和預測
 全球 FIDO 身份驗證市場研究報告 - 2023 年至 2030 年行業分析、規模、佔有率、成長、趨勢和預測
 FIDO認證市場(組件:FIDO認證設備、IDO認證SDK和支持服務) - 2023-2031年全球行業分析、規模、佔有率、成長、趨勢和預測