

 |
市場調查報告書
商品編碼
1665256
光譜軟體市場機會、成長動力、產業趨勢分析與預測 2025 - 2034Spectroscopy Software Market Opportunity, Growth Drivers, Industry Trend Analysis, and Forecast 2025 - 2034 |
||||||
2024 年全球光譜軟體市場價值為 11 億美元,預計 2025 年至 2034 年期間複合年成長率將達到 9.1% 。該軟體對於依賴精確測量的行業至關重要,使其成為各個領域的關鍵工具。
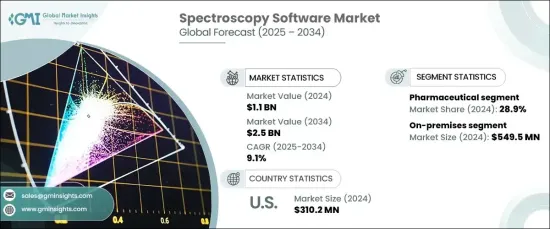
根據部署類型,市場分為內部部署和基於雲端的解決方案。 2024 年,內部部署部門引領市場,創造 5.495 億美元的收入,預計在整個預測期內將繼續保持強勁成長。本地解決方案尤其受到需要加強對敏感資料控制的組織的青睞,這對於遵守產業法規至關重要。醫療保健和製藥等行業都非常重視資料安全,因此強烈傾向於內部部署模式。這些解決方案確保了必要的安全性和資訊控制,使其成為滿足嚴格的監管標準不可或缺的一部分。
| 市場範圍 | |
|---|---|
| 起始年份 | 2024 |
| 預測年份 | 2025-2034 |
| 起始值 | 11億美元 |
| 預測值 | 25億美元 |
| 複合年成長率 | 9.1% |
從應用方面來看,市場分為食品檢測、環境檢測、法醫科學、製藥和其他領域。 2024 年,製藥業佔據了 28.9% 的市場佔有率,預計未來幾年將大幅成長。藥物開發對精度和高品質標準的要求不斷增加,以及監管要求日益嚴格,推動了光譜軟體的廣泛應用。此外,藥物研發中對高通量篩選的不斷成長的需求也推動了這些軟體解決方案的使用。研究人員越來越依賴光譜軟體來管理大型資料集、簡化工作流程並加速藥物開發和臨床測試的研究成果。
在美國,光譜軟體市場在 2024 年創造了 3.102 億美元的收入。美國實驗室廣泛採用先進的分析技術,再加上製藥和食品安全等行業的嚴格監管環境,持續推動對尖端光譜軟體解決方案的需求。這些因素加上持續的技術進步,預計將維持美國市場的成長並促進未來十年的持續擴張。
目錄
第 1 章:方法論與範圍
- 市場範圍和定義
- 研究設計
- 研究方法
- 資料收集方法
- 基礎估算與計算
- 基準年計算
- 市場估計的主要趨勢
- 預測模型
- 初步研究和驗證
- 主要來源
- 資料探勘來源
第 2 章:執行摘要
第 3 章:產業洞察
- 產業生態系統分析
- 產業衝擊力
- 成長動力
- 製藥業對光譜軟體的需求不斷成長
- 環境與食品安全法規
- 技術進步
- 學術和研究機構的研發投資增加
- 產業陷阱與挑戰
- 資料安全問題
- 成長動力
- 成長潛力分析
- 監管格局
- 美國
- 歐洲
- 技術格局
- 未來市場趨勢
- 重要新聞和舉措
- 差距分析
- 波特的分析
- PESTEL 分析
第4章:競爭格局
- 介紹
- 公司市佔率分析
- 公司矩陣分析
- 主要市場參與者的競爭分析
- 競爭定位矩陣
- 策略儀表板
第 5 章:市場估計與預測:按部署類型,2021 年至 2034 年
- 主要趨勢
- 本地
- 雲
第 6 章:市場估計與預測:按應用,2021 年至 2034 年
- 主要趨勢
- 食品檢測
- 環境測試
- 法醫學
- 藥品
- 其他應用
第 7 章:市場估計與預測:按地區,2021 年至 2034 年
- 主要趨勢
- 北美洲
- 美國
- 加拿大
- 歐洲
- 德國
- 英國
- 法國
- 西班牙
- 義大利
- 荷蘭
- 亞太地區
- 中國
- 日本
- 印度
- 澳洲
- 韓國
- 拉丁美洲
- 巴西
- 墨西哥
- 阿根廷
- 中東和非洲
- 南非
- 沙烏地阿拉伯
- 阿拉伯聯合大公國
第8章:公司簡介
- Agilent Technologies
- Advanced Chemistry Development
- Bruker Corporation
- Danaher Corporation
- Genedata
- Lablicate
- Microsaic Systems
- OpenMS
- SCIEX
- Shimadzu Corporation
- SpectralWorks
- Spectrum Software Solutions
- StellarNet
- Thermo Fisher Scientific
- Waters Corporation
The Global Spectroscopy Software Market was valued at USD 1.1 billion in 2024 and is projected to grow at an impressive CAGR of 9.1% from 2025 to 2034. Spectroscopy software plays a crucial role in working with spectrometers, facilitating the efficient collection, analysis, and interpretation of spectral data across a wide range of applications. This software is essential for industries that rely on precise and accurate measurements, making it a pivotal tool in various sectors.
The market is divided by deployment type into on-premises and cloud-based solutions. In 2024, the on-premises segment led the market, generating USD 549.5 million in revenue, and is expected to continue experiencing robust growth throughout the forecast period. On-premises solutions are particularly favored by organizations that require enhanced control over sensitive data, which is critical for compliance with industry regulations. Industries such as healthcare and pharmaceuticals, where data security is paramount, strongly prefer on-premises deployment models. These solutions ensure the necessary security and control over information, making them indispensable in meeting stringent regulatory standards.
| Market Scope | |
|---|---|
| Start Year | 2024 |
| Forecast Year | 2025-2034 |
| Start Value | $1.1 Billion |
| Forecast Value | $2.5 Billion |
| CAGR | 9.1% |
In terms of application, the market is segmented into food testing, environmental testing, forensic science, pharmaceuticals, and other sectors. The pharmaceutical industry accounted for 28.9% of the market share in 2024 and is expected to experience substantial growth in the coming years. The increasing demand for precision and high-quality standards in drug development, along with tightening regulatory requirements, is driving the growing adoption of spectroscopy software. Furthermore, the rising need for high-throughput screening in drug discovery is fueling the use of these software solutions. Researchers are increasingly relying on spectroscopy software to manage large datasets, streamline workflows, and accelerate research outcomes in drug development and clinical testing.
In the United States, the spectroscopy software market generated USD 310.2 million in 2024. The U.S. remains a dominant force in the global market, home to leading developers of spectroscopy software and instrument manufacturers. The widespread adoption of advanced analytical technologies in U.S. laboratories, combined with the strict regulatory environment in industries such as pharmaceuticals and food safety, continues to drive the demand for cutting-edge spectroscopy software solutions. These factors, coupled with ongoing technological advancements, are expected to sustain the growth of the U.S. market and contribute to its continued expansion over the next decade.
Table of Contents
Chapter 1 Methodology & Scope
- 1.1 Market scope & definitions
- 1.2 Research design
- 1.2.1 Research approach
- 1.2.2 Data collection methods
- 1.3 Base estimates & calculations
- 1.3.1 Base year calculation
- 1.3.2 Key trends for market estimation
- 1.4 Forecast model
- 1.5 Primary research and validation
- 1.5.1 Primary sources
- 1.5.2 Data mining sources
Chapter 2 Executive Summary
- 2.1 Industry 3600 synopsis
Chapter 3 Industry Insights
- 3.1 Industry ecosystem analysis
- 3.2 Industry impact forces
- 3.2.1 Growth drivers
- 3.2.1.1 Growing demand of spectroscopy software in pharmaceutical industry
- 3.2.1.2 Environmental and food safety regulations
- 3.2.1.3 Technological advancements
- 3.2.1.4 Rise in research and development investments in academic and research institutions
- 3.2.2 Industry pitfalls & challenges
- 3.2.2.1 Data security concerns
- 3.2.1 Growth drivers
- 3.3 Growth potential analysis
- 3.4 Regulatory landscape
- 3.4.1 U.S.
- 3.4.2 Europe
- 3.5 Technology landscape
- 3.6 Future market trends
- 3.7 Key news and initiatives
- 3.8 Gap analysis
- 3.9 Porter’s analysis
- 3.10 PESTEL analysis
Chapter 4 Competitive Landscape, 2024
- 4.1 Introduction
- 4.2 Company market share analysis
- 4.3 Company matrix analysis
- 4.4 Competitive analysis of major market players
- 4.5 Competitive positioning matrix
- 4.6 Strategy dashboard
Chapter 5 Market Estimates and Forecast, By Deployment Type, 2021 – 2034 ($ Mn)
- 5.1 Key trends
- 5.2 On-premises
- 5.3 Cloud
Chapter 6 Market Estimates and Forecast, By Application, 2021 – 2034 ($ Mn)
- 6.1 Key trends
- 6.2 Food testing
- 6.3 Environmental testing
- 6.4 Forensic science
- 6.5 Pharmaceuticals
- 6.6 Other applications
Chapter 7 Market Estimates and Forecast, By Region, 2021 – 2034 ($ Mn)
- 7.1 Key trends
- 7.2 North America
- 7.2.1 U.S.
- 7.2.2 Canada
- 7.3 Europe
- 7.3.1 Germany
- 7.3.2 UK
- 7.3.3 France
- 7.3.4 Spain
- 7.3.5 Italy
- 7.3.6 Netherlands
- 7.4 Asia Pacific
- 7.4.1 China
- 7.4.2 Japan
- 7.4.3 India
- 7.4.4 Australia
- 7.4.5 South Korea
- 7.5 Latin America
- 7.5.1 Brazil
- 7.5.2 Mexico
- 7.5.3 Argentina
- 7.6 Middle East and Africa
- 7.6.1 South Africa
- 7.6.2 Saudi Arabia
- 7.6.3 UAE
Chapter 8 Company Profiles
- 8.1 Agilent Technologies
- 8.2 Advanced Chemistry Development
- 8.3 Bruker Corporation
- 8.4 Danaher Corporation
- 8.5 Genedata
- 8.6 Lablicate
- 8.7 Microsaic Systems
- 8.8 OpenMS
- 8.9 SCIEX
- 8.10 Shimadzu Corporation
- 8.11 SpectralWorks
- 8.12 Spectrum Software Solutions
- 8.13 StellarNet
- 8.14 Thermo Fisher Scientific
- 8.15 Waters Corporation
 光譜市場評估:依類型、產品、應用、最終用戶、地區、機會和預測,2018年至2032年
 光譜分析市場 - 全球產業規模、佔有率、趨勢、機會和預測,按類型(分子光譜、質譜、原子光譜)、按產品、按應用、按地區和競爭細分,2020-2030F
 新光譜分析 2024 年世界市場報告
 全球光譜市場:市場規模、佔有率和趨勢分析(按應用、類型、產品、最終用途、地區和細分市場,2025-2030 年)
 光譜市場報告:趨勢、預測和競爭分析(至2030年)
 光譜分析市場規模、佔有率和成長分析:按類型、按產品、按應用、按最終用戶、按地區 - 行業預測,2024-2031 年
 光譜軟體市場:按部署模式、應用分類 - 2025-2030 年全球預測
 全球光譜分析市場,2024-2028
 微XRF分析設備的全球市場(2024年)
 光譜分析軟體全球市場規模、佔有率、產業趨勢分析報告:2023-2030 年依部署模式、應用程式、地區分類的展望與預測