


 |
市場調查報告書
商品編碼
1665317
虛擬發電廠市場機會、成長動力、產業趨勢分析與 2025 - 2034 年預測Virtual Power Plant Market Opportunity, Growth Drivers, Industry Trend Analysis, and Forecast 2025 - 2034 |
||||||
預計全球虛擬發電廠市場規模將在 2024 年達到 46 億美元,預計在 2025 年至 2034 年期間將實現 21.6% 的顯著複合年成長率。透過聚合分散式資源的能源,這些先進的系統最佳化了生產、消費和分配,作為單一實體無縫運作。這種創新方法提高了電網穩定性、提高了能源效率、簡化了資源管理,有助於建立更可靠和永續的能源生態系統。
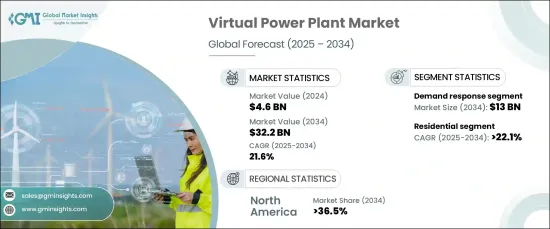
VPP 市場分為幾個關鍵技術部分,包括分散式能源資源、需量反應和混合資產系統。其中,需量反應部門預計到 2034 年將創造 130 億美元的收入。需量反應系統有助於減輕現有基礎設施的壓力,最大限度地減少對額外發電能力的需求並提高能源效率。隨著對經濟高效的能源解決方案的需求不斷成長,需量反應系統已成為 VPP 的重要組成部分,從而實現了更動態和永續的能源電網。
| 市場範圍 | |
|---|---|
| 起始年份 | 2024 |
| 預測年份 | 2025-2034 |
| 起始值 | 46億美元 |
| 預測值 | 322億美元 |
| 複合年成長率 | 21.6% |
對於最終用戶而言,VPP 市場分為住宅、工業和商業應用。預計到 2034 年,工業領域的複合年成長率將達到驚人的 20.5%。此外,對永續發展目標和碳減排的日益關注也加速了虛擬工廠模式在工業領域的應用。隨著工業部門越來越重視可靠、節能的系統來支援持續營運,虛擬電廠 (VPP) 已成為其能源策略的重要組成部分。
在美國,虛擬發電廠市場預計到 2034 年將創收 92 億美元。聯邦政策,例如針對再生能源和儲存技術的稅收抵免和補助,正在為 VPP 部署創造有利的環境。這些政策不僅增強了能源安全,也促進了住宅和工業領域廣泛採用先進的電力管理系統。
目錄
第 1 章:方法論與範圍
- 市場定義
- 基礎估算與計算
- 預測計算
- 初步研究與驗證
- 主要來源
- 資料探勘來源
- 市場定義
第 2 章:執行摘要
第 3 章:產業洞察
- 產業生態系統
- 監管格局
- 產業衝擊力
- 成長動力
- 產業陷阱與挑戰
- 成長潛力分析
- 波特的分析
- 供應商的議價能力
- 買家的議價能力
- 新進入者的威脅
- 替代品的威脅
- PESTEL 分析
第4章:競爭格局
- 介紹
- 戰略儀表板
- 創新與永續發展格局
第 5 章:市場規模與預測:依技術,2021 – 2034 年
- 主要趨勢
- 分散式能源
- 需求回應
- 混合資產
第 6 章:市場規模與預測:依最終用途,2021 – 2034 年
- 主要趨勢
- 住宅
- 工業的
- 商業的
第 7 章:市場規模及預測:按地區,2021 – 2034 年
- 主要趨勢
- 北美洲
- 美國
- 加拿大
- 歐洲
- 德國
- 法國
- 英國
- 義大利
- 亞太地區
- 中國
- 日本
- 韓國
- 印度
- 世界其他地區
第8章:公司簡介
- AGL Energy
- Bosch Global
- Enel X
- Enbala Power Networks
- Hitachi
- Tesla
- Statkraft
- Shell
- Siemens
- Schneider Electric
The Global Virtual Power Plant Market is anticipated to reach USD 4.6 billion in 2024 and is projected to experience a remarkable growth rate of 21.6% CAGR from 2025 to 2034. VPPs are revolutionizing the energy sector by integrating decentralized, small-scale power generation units into a cohesive network managed by a central system. By aggregating energy from distributed resources, these advanced systems optimize production, consumption, and distribution, operating seamlessly as a single entity. This innovative approach boosts grid stability, enhances energy efficiency, and simplifies resource management, contributing to a more reliable and sustainable energy ecosystem.
The VPP market is divided into key technological segments, including distributed energy resources, demand response, and mixed asset systems. Among these, the demand response segment is poised to generate USD 13 billion by 2034. This growth is driven by its capability to enhance grid reliability, prevent outages, and enable more cost-effective energy management. Demand response systems help reduce strain on existing infrastructure, minimizing the need for additional power generation capacity and promoting energy efficiency. As the demand for affordable and efficient energy solutions rises, demand response systems have become a vital component of VPPs, enabling a more dynamic and sustainable energy grid.
| Market Scope | |
|---|---|
| Start Year | 2024 |
| Forecast Year | 2025-2034 |
| Start Value | $4.6 Billion |
| Forecast Value | $32.2 Billion |
| CAGR | 21.6% |
When it comes to end users, the VPP market is categorized into residential, industrial, and commercial applications. The industrial segment is projected to grow at an impressive CAGR of 20.5% through 2034. Rising energy demands within industrial operations are driving the need for solutions that can lower costs by shifting energy loads, reducing peak demand, and providing real-time energy management. Additionally, the growing focus on sustainability goals and carbon emission reductions is accelerating the adoption of VPPs in industries. As industrial sectors increasingly prioritize reliable and energy-efficient systems to support continuous operations, VPPs have become an essential part of their energy strategies.
In the U.S., the virtual power plant market is forecast to generate USD 9.2 billion by 2034. The challenges of maintaining grid stability due to aging infrastructure, extreme weather events, and increasing energy demand are spurring the adoption of VPPs to ensure resilience. Federal policies, such as tax credits and grants for renewable energy and storage technologies, are creating a favorable environment for VPP deployment. These policies not only enhance energy security but also promote the widespread adoption of advanced power management systems in both residential and industrial sectors.
Table of Contents
Chapter 1 Methodology & Scope
- 1.1 Market definitions
- 1.2 Base estimates & calculations
- 1.3 Forecast calculation
- 1.4 Primary research & validation
- 1.4.1 Primary sources
- 1.4.2 Data mining sources
- 1.5 Market definitions
Chapter 2 Executive Summary
- 2.1 Industry synopsis, 2021 – 2034
Chapter 3 Industry Insights
- 3.1 Industry ecosystem
- 3.2 Regulatory landscape
- 3.3 Industry impact forces
- 3.3.1 Growth drivers
- 3.3.2 Industry pitfalls & challenges
- 3.4 Growth potential analysis
- 3.5 Porter's analysis
- 3.5.1 Bargaining power of suppliers
- 3.5.2 Bargaining power of buyers
- 3.5.3 Threat of new entrants
- 3.5.4 Threat of substitutes
- 3.6 PESTEL analysis
Chapter 4 Competitive landscape, 2024
- 4.1 Introduction
- 4.2 Strategic dashboard
- 4.3 Innovation & sustainability landscape
Chapter 5 Market Size and Forecast, By Technology, 2021 – 2034 (USD Billion)
- 5.1 Key trends
- 5.2 Distributed energy resource
- 5.3 Demand response
- 5.4 Mixed asset
Chapter 6 Market Size and Forecast, By End Use, 2021 – 2034 (USD Billion)
- 6.1 Key trends
- 6.2 Residential
- 6.3 Industrial
- 6.4 Commercial
Chapter 7 Market Size and Forecast, By Region, 2021 – 2034 (USD Billion)
- 7.1 Key trends
- 7.2 North America
- 7.2.1 U.S.
- 7.2.2 Canada
- 7.3 Europe
- 7.3.1 Germany
- 7.3.2 France
- 7.3.3 UK
- 7.3.4 Italy
- 7.4 Asia Pacific
- 7.4.1 China
- 7.4.2 Japan
- 7.4.3 South Korea
- 7.4.4 India
- 7.5 Rest of World
Chapter 8 Company Profiles
- 8.1 AGL Energy
- 8.2 Bosch Global
- 8.3 Enel X
- 8.4 Enbala Power Networks
- 8.5 Hitachi
- 8.6 Tesla
- 8.7 Statkraft
- 8.8 Shell
- 8.9 Siemens
- 8.10 Schneider Electric
 2025年虛擬發電廠全球市場報告
 全球虛擬發電廠市場規模、佔有率、趨勢分析報告 - 按技術、最終用途和地區分類的展望和預測,2024 年至 2031 年
 虛擬發電廠市場規模、佔有率、趨勢分析報告:按技術、最終用途、地區、細分預測,2025-2030 年
 虛擬發電廠市場規模、佔有率、成長分析,按技術、按產品、按來源、按行業、按地區 - 產業預測,2024-2031年
 2024-2032 年日本虛擬電廠市場報告(按技術(分散式發電、需量反應、混合資產)、最終用戶(工業、商業、住宅)和地區)虛擬電廠市場:依技術、組件、部署模式、類別、最終用戶分類 - 全球預測 2025-2030
 虛擬電廠市場報告:2030 年趨勢、預測與競爭分析
 VPP的北美市場,2024年
 虛擬發電廠(VPP)的全球市場
 虛擬發電廠的全球市場:2024年