

 |
市場調查報告書
商品編碼
1665323
製造規模靜電除塵器市場機會、成長動力、產業趨勢分析與預測 2025 - 2034Manufacturing Scale Electrostatic Precipitator Market Opportunity, Growth Drivers, Industry Trend Analysis, and Forecast 2025 - 2034 |
||||||
2024 年全球製造規模靜電除塵器市場規模達到 8.652 億美元,預計 2025 年至 2034 年期間將以 6.8% 的強勁複合年成長率成長。它們的工作原理是利用高壓電場使氣流中的粒子帶電,使粒子聚集在帶相反電荷的薄片或探針上。透過振動或敲擊定期清除積聚的顆粒,確保持續的效率和高性能。
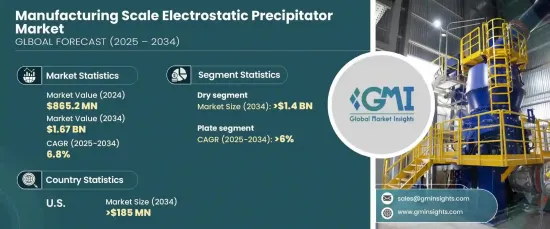
乾式靜電集塵器市場將經歷顯著成長,預計到 2034 年將達到 14 億美元。由於乾式靜電集塵器具有穩定的性能和最短的停機時間,越來越多的製造商選擇乾式靜電集塵器。這些系統支援生產力目標和遵守環境法規,同時其耐用性和低維護要求可轉化為大量長期成本節約,使其成為注重經濟和環境永續性的設施的理想選擇。
| 市場範圍 | |
|---|---|
| 起始年份 | 2024 |
| 預測年份 | 2025-2034 |
| 起始值 | 8.652 億美元 |
| 預測值 | 16.7 億美元 |
| 複合年成長率 | 6.8% |
在設計方面,預計到 2034 年,板式靜電除塵器領域的複合年成長率將達到 6%。它能夠在不影響性能的情況下處理波動的粉塵負荷,這增加了它的吸引力,特別是當行業越來越要求耐腐蝕、耐高溫和耐磨損的設計時。這些因素使得板式靜電除塵器在最具挑戰性的操作環境中能夠提供長期可靠性。
預計到 2034 年,美國製造規模靜電除塵器市場將創收 1.85 億美元。各機構執行的嚴格空氣品質法規(包括《清潔空氣法》)要求大幅減少顆粒物排放,為市場擴張創造了有利可圖的機會。此外,旨在降低維護成本和提高長期投資回報的創新正在進一步推動市場採用並確保整個地區的穩定成長。
目錄
第 1 章:方法論與範圍
- 研究設計
- 基礎估算與計算
- 預測模型
- 初步研究與驗證
- 主要來源
- 資料探勘來源
- 市場定義
第 2 章:執行摘要
第 3 章:產業洞察
- 產業生態系統
- 監管格局
- 產業衝擊力
- 成長動力
- 產業陷阱與挑戰
- 成長潛力分析
- 波特的分析
- 供應商的議價能力
- 買家的議價能力
- 新進入者的威脅
- 替代品的威脅
- PESTEL 分析
第4章:競爭格局
- 介紹
- 戰略儀表板
- 創新與技術格局
第 5 章:市場規模及預測:依設計,2021 – 2034 年
- 主要趨勢
- 盤子
- 管狀
第 6 章:市場規模與預測:按系統,2021 – 2034 年
- 主要趨勢
- 乾燥
- 濕的
第 7 章:市場規模及預測:按地區,2021 – 2034 年
- 主要趨勢
- 北美洲
- 美國
- 加拿大
- 墨西哥
- 歐洲
- 德國
- 英國
- 法國
- 西班牙
- 義大利
- 荷蘭
- 亞太地區
- 中國
- 印度
- 日本
- 韓國
- 印尼
- 澳洲
- 中東和非洲
- 沙烏地阿拉伯
- 阿拉伯聯合大公國
- 南非
- 奈及利亞
- 安哥拉
- 拉丁美洲
- 巴西
- 阿根廷
- 智利
- 秘魯
第8章:公司簡介
- ANDRITZ GROUP
- Babcock & Wilcox
- Beltran Technologies
- Elex
- Environ Engineers
- GEA Group
- Kraft Powercon
- Thermax
- VT Corp
- Valmet
The Global Manufacturing Scale Electrostatic Precipitator Market reached USD 865.2 million in 2024 and is projected to grow at a robust CAGR of 6.8% from 2025 to 2034. These advanced devices play a crucial role in air pollution control by effectively removing fine particulate matter from industrial flue gases. They operate by charging particles in the gas stream with high-voltage electrical fields, causing the particles to collect on oppositely charged sheets or probes. The accumulated particles are periodically dislodged using vibration or rapping, ensuring continuous efficiency and high performance.
The dry electrostatic precipitator segment is set to experience significant growth, expected to reach USD 1.4 billion by 2034. This system type is highly valued for its ability to provide high-efficiency particle collection, meeting stringent environmental standards and driving widespread adoption across various industries. Manufacturers are increasingly opting for dry electrostatic precipitators due to their consistent performance and minimal operational downtime. These systems support productivity goals and compliance with environmental regulations, while their durability and low maintenance requirements translate into substantial long-term cost savings, making them an ideal choice for facilities focused on both economic and environmental sustainability.
| Market Scope | |
|---|---|
| Start Year | 2024 |
| Forecast Year | 2025-2034 |
| Start Value | $865.2 Million |
| Forecast Value | $1.67 Billion |
| CAGR | 6.8% |
In terms of design, the plate electrostatic precipitator segment is anticipated to grow at a CAGR of 6% through 2034. Renowned for its superior particulate collection efficiency, the plate design excels at capturing fine and ultrafine particles, making it perfect for industries dealing with varying emission profiles. Its ability to handle fluctuating dust loads without compromising performance boosts its appeal, especially as industries increasingly demand designs resistant to corrosion, high temperatures, and wear. These factors contribute to the plate electrostatic precipitator's reputation for providing long-lasting reliability in the most challenging operating environments.
The U.S. manufacturing scale electrostatic precipitator market is forecasted to generate USD 185 million by 2034. As environmental sustainability becomes a top priority, industries across the U.S. are under growing pressure to adopt cleaner technologies, driving up the demand for electrostatic precipitators. The enforcement of strict air quality regulations by agencies, including the Clean Air Act, mandates significant reductions in particulate emissions, creating lucrative opportunities for market expansion. Additionally, innovations aimed at reducing maintenance costs and enhancing long-term returns on investment are further propelling market adoption and ensuring steady growth across the region.
Table of Contents
Chapter 1 Methodology & Scope
- 1.1 Research design
- 1.2 Base estimates & calculations
- 1.3 Forecast model
- 1.4 Primary research & validation
- 1.4.1 Primary sources
- 1.4.2 Data mining sources
- 1.5 Market definitions
Chapter 2 Executive Summary
- 2.1 Industry synopsis, 2021 – 2034
Chapter 3 Industry Insights
- 3.1 Industry ecosystem
- 3.2 Regulatory landscape
- 3.3 Industry impact forces
- 3.3.1 Growth drivers
- 3.3.2 Industry pitfalls & challenges
- 3.4 Growth potential analysis
- 3.5 Porter's analysis
- 3.5.1 Bargaining power of suppliers
- 3.5.2 Bargaining power of buyers
- 3.5.3 Threat of new entrants
- 3.5.4 Threat of substitutes
- 3.6 PESTEL analysis
Chapter 4 Competitive landscape, 2024
- 4.1 Introduction
- 4.2 Strategic dashboard
- 4.3 Innovation & technology landscape
Chapter 5 Market Size and Forecast, By Design, 2021 – 2034 (USD Million)
- 5.1 Key trends
- 5.2 Plate
- 5.3 Tubular
Chapter 6 Market Size and Forecast, By System, 2021 – 2034 (USD Million)
- 6.1 Key trends
- 6.2 Dry
- 6.3 Wet
Chapter 7 Market Size and Forecast, By Region, 2021 – 2034 (USD Million)
- 7.1 Key trends
- 7.2 North America
- 7.2.1 U.S.
- 7.2.2 Canada
- 7.2.3 Mexico
- 7.3 Europe
- 7.3.1 Germany
- 7.3.2 UK
- 7.3.3 France
- 7.3.4 Spain
- 7.3.5 Italy
- 7.3.6 Netherlands
- 7.4 Asia Pacific
- 7.4.1 China
- 7.4.2 India
- 7.4.3 Japan
- 7.4.4 South Korea
- 7.4.5 Indonesia
- 7.4.6 Australia
- 7.5 Middle East & Africa
- 7.5.1 Saudi Arabia
- 7.5.2 UAE
- 7.5.3 South Africa
- 7.5.4 Nigeria
- 7.5.5 Angola
- 7.6 Latin America
- 7.6.1 Brazil
- 7.6.2 Argentina
- 7.6.3 Chile
- 7.6.4 Peru
Chapter 8 Company Profiles
- 8.1 ANDRITZ GROUP
- 8.2 Babcock & Wilcox
- 8.3 Beltran Technologies
- 8.4 Elex
- 8.5 Environ Engineers
- 8.6 GEA Group
- 8.7 Kraft Powercon
- 8.8 Thermax
- 8.9 VT Corp
- 8.10 Valmet
 空氣品管系統市場:按類型、污染物類型、安裝位置、應用分類 - 2025-2030 年全球預測
 空氣品管系統市場:各技術,各污染物質類型,各產品,各最終用途產業,各地區,機會,預測,2017年~2031年
 船用靜電除塵器市場機會、成長動力、產業趨勢分析和 2024 年至 2032 年預測
 全球空氣品管系統市場:按最終用戶、按污染物類型、按產品類型、按技術、按地區 - 預測至 2029 年
 2024 年空氣品質管理系統全球市場報告
 到 2028 年的空氣質量控制 (AQC) 系統市場預測——按污染物類型、產品類型、技術、應用、最終用戶和地區進行的全球分析
 空氣質量管理系統市場:規模、份額、趨勢分析報告——按產品類型、按污染物、按成分、按最終用途、按地區、細分市場另一個預測: 2023-2032
 空氣質量控制系統市場-2023年~2028年前的預測