

 |
市場調查報告書
商品編碼
1665427
澆水設備市場機會、成長動力、產業趨勢分析與 2025 - 2034 年預測Watering Equipment Market Opportunity, Growth Drivers, Industry Trend Analysis, and Forecast 2025 - 2034 |
||||||
2024 年全球澆水設備市場價值為 122 億美元,預計 2025 年至 2034 年的複合年成長率為 6.6%。隨著水資源短缺問題不斷加劇,人們對旨在最佳化用水同時保持植物健康的工具的需求也日益成長。先進的灌溉系統,包括自動化設備和濕度敏感技術,因其能夠最大限度地減少水浪費而受到歡迎。人們對環境議題認知的增強促使消費者和組織尋求生態友善的澆水方法,進一步推動了市場擴張。
政府推動節水的措施和政策也在這一成長中發揮了關鍵作用。針對農業、園藝和景觀用水的監管措施正在重塑產業實踐。此外,補貼和稅收優惠等財政激勵措施正在鼓勵住宅、商業和農業領域對先進灌溉設備的投資。更嚴格的法規、增強的環保意識和創新的技術相結合,使節水成為市場進步的核心因素。
| 市場範圍 | |
|---|---|
| 起始年份 | 2024 |
| 預測年份 | 2025-2034 |
| 起始值 | 122億美元 |
| 預測值 | 233億美元 |
| 複合年成長率 | 6.6% |
市場按類型分類,產品包括噴壺、滴灌套件、灑水器、軟管噴嘴、噴霧器以及其他產品,如泵浦、管道和閥門。其中,灑水裝置在 2024 年佔據最大佔有率,創造了 43 億美元的收入。預計預測期內該部分的複合年成長率為 7%。噴水器廣泛應用於各種應用領域,可確保在大面積範圍內有效分配水。自動化和感測器等增強功能使這些系統越來越高效,並吸引了廣泛的用戶。
根據配銷通路,市場分為直接銷售和間接銷售。間接銷售通路在 2024 年佔據市場主導地位,約佔總佔有率的 68.2%,預計在預測期內以 6.9% 的複合年成長率成長。該部分涵蓋零售商、批發商和電子商務平台,使製造商能夠接觸到多樣化的客戶群。零售店和線上平台已經成為滿足城市和精通技術的買家需求的重要平台,提供廣泛的產品選擇和詳細的資訊。電子商務的興起透過提供便利和有競爭力的價格進一步加強了這個管道。
在美國,澆水設備市場在 2024 年為全球市場貢獻了約 23 億美元,預計預測期內的複合年成長率為 6.8%。中國對先進灌溉系統的強烈需求反映出人們越來越關注永續水管理實踐和產業技術進步。
目錄
第 1 章:方法論與範圍
- 市場範圍和定義
- 基礎估算與計算
- 預測參數
- 資料來源
- 基本的
- 次要
- 付費來源
- 公共資源
第 2 章:執行摘要
第 3 章:產業洞察
- 產業生態系統分析
- 影響價值鏈的因素
- 利潤率分析
- 中斷
- 未來展望
- 製造商
- 經銷商
- 供應商概況
- 利潤率分析
- 重要新聞及舉措
- 監管格局
- 衝擊力
- 成長動力
- 更加重視節約用水
- 智慧灌溉系統的採用日益增多
- 擴大住宅和商業園藝活動
- 產業陷阱與挑戰
- 先進設備的初始成本高
- 易受水資源和氣候條件波動的影響
- 成長動力
- 成長潛力分析
- 消費者購買行為分析
- 波特的分析
- PESTEL 分析
第4章:競爭格局
- 介紹
- 公司市佔率分析
- 競爭定位矩陣
- 戰略展望矩陣
第 5 章:市場估計與預測:按類型,2021 年至 2034 年
- 主要趨勢
- 噴壺
- 滴灌套件
- 灑水裝置
- 軟管噴嘴
- 先生
- 其他(泵浦、管道、閥門)
第 6 章:市場估計與預測:按材料,2021 – 2034 年
- 主要趨勢
- 塑膠
- 金屬
- 橡皮
- 其他
第 7 章:市場估計與預測:依最終用途,2021 年至 2034 年
- 主要趨勢
- 農業
- 住宅園藝(家居和花園)
- 商業景觀美化(公園、花園、公共空間)
- 運動場和高爾夫球場
第 8 章:市場估計與預測:按配銷通路,2021 年至 2034 年
- 主要趨勢
- 直接銷售
- 間接銷售
第 9 章:市場估計與預測:按地區,2021 年至 2034 年
- 主要趨勢
- 北美洲
- 美國
- 加拿大
- 歐洲
- 德國
- 英國
- 法國
- 義大利
- 西班牙
- 俄羅斯
- 亞太地區
- 中國
- 印度
- 日本
- 韓國
- 澳洲
- 拉丁美洲
- 巴西
- 墨西哥
- 中東及非洲
- 沙烏地阿拉伯
- 阿拉伯聯合大公國
- 南非
第10章:公司簡介
- Briggs & Stratton Corporation
- Gilmour Manufacturing Company
- Hunter Industries Incorporated
- Irritrol Systems, Inc.
- Jain Irrigation Systems Ltd.
- John Deere & Company
- K-Rain Manufacturing Corporation
- Lindsay Corporation
- Netafim Ltd.
- Orbit Irrigation Products, Inc.
- Rain Bird Corporation
- The Scotts Miracle-Gro Company
- The Toro Company
- TL Irrigation Company
- Valmont Industries, Inc.
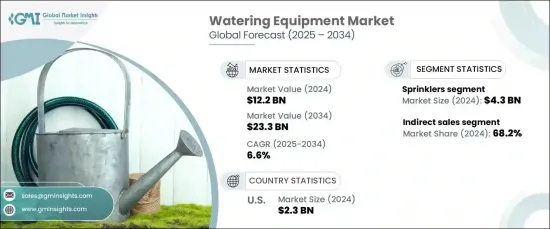
The Global Watering Equipment Market was valued at USD 12.2 billion in 2024 and is projected to grow at a CAGR of 6.6% from 2025 to 2034. The rising emphasis on water conservation and sustainability has significantly influenced the adoption of efficient watering solutions. As water scarcity concerns continue to escalate, there is growing demand for tools designed to optimize water usage while maintaining plant health. Advanced irrigation systems, including automated devices and moisture-sensitive technologies, have gained popularity due to their ability to minimize water waste. Increased awareness of environmental issues has encouraged consumers and organizations to seek eco-friendly watering methods, further driving market expansion.
Government initiatives and policies aimed at promoting water conservation have also played a pivotal role in this growth. Regulatory measures targeting water usage in farming, gardening, and landscaping are reshaping industry practices. Additionally, financial incentives such as subsidies and tax benefits are encouraging investment in advanced irrigation equipment across residential, commercial, and agricultural sectors. The combination of stricter regulations, heightened environmental consciousness, and innovative technologies positions water conservation as a central factor in market progress.
| Market Scope | |
|---|---|
| Start Year | 2024 |
| Forecast Year | 2025-2034 |
| Start Value | $12.2 Billion |
| Forecast Value | $23.3 Billion |
| CAGR | 6.6% |
The market is categorized by type, with products including watering cans, drip irrigation kits, sprinklers, hose nozzles, misters, and others such as pumps, pipes, and valves. Among these, sprinklers captured the largest share in 2024, generating USD 4.3 billion in revenue. This segment is expected to expand at a CAGR of 7% during the forecast period. Sprinklers are widely utilized across diverse applications, ensuring effective water distribution over large areas. Enhanced features like automation and sensors are making these systems increasingly efficient and appealing to a broad range of users.
By distribution channel, the market is segmented into direct and indirect sales. The indirect sales channel dominated the market in 2024, accounting for approximately 68.2% of the overall share, and is projected to grow at a CAGR of 6.9% through the forecast period. This segment encompasses retailers, wholesalers, and e-commerce platforms, enabling manufacturers to reach a diverse customer base. Retail stores and online platforms have become essential for catering to urban and tech-savvy buyers, offering extensive product options and detailed information. The rise of e-commerce has further strengthened this channel by providing convenience and competitive pricing.
In the United States, the watering equipment market contributed approximately USD 2.3 billion to the global market in 2024, with a CAGR of 6.8% expected during the forecast period. The country's strong demand for advanced irrigation systems reflects a growing focus on sustainable water management practices and technological advancements in the industry.
Table of Contents
Chapter 1 Methodology & Scope
- 1.1 Market scope & definition
- 1.2 Base estimates & calculations
- 1.3 Forecast parameters
- 1.4 Data sources
- 1.4.1 Primary
- 1.4.2 Secondary
- 1.4.2.1 Paid sources
- 1.4.2.2 Public sources
Chapter 2 Executive Summary
- 2.1 Industry synopsis, 2021 - 2034
Chapter 3 Industry Insights
- 3.1 Industry ecosystem analysis
- 3.1.1 Factors affecting the value chain
- 3.1.2 Profit margin analysis
- 3.1.3 Disruptions
- 3.1.4 Future outlook
- 3.1.5 Manufacturers
- 3.1.6 Distributors
- 3.2 Supplier landscape
- 3.3 Profit margin analysis
- 3.4 Key news & initiatives
- 3.5 Regulatory landscape
- 3.6 Impact forces
- 3.6.1 Growth drivers
- 3.6.1.1 Increasing focus on water conservation
- 3.6.1.2 Rising adoption of smart irrigation systems
- 3.6.1.3 Expansion of residential and commercial gardening activities
- 3.6.2 Industry pitfalls & challenges
- 3.6.2.1 High initial costs of advanced equipment
- 3.6.2.2 Vulnerability to fluctuations in water availability and climate conditions
- 3.6.1 Growth drivers
- 3.7 Growth potential analysis
- 3.8 Consumer buying behavior analysis
- 3.9 Porter’s analysis
- 3.10 PESTEL analysis
Chapter 4 Competitive Landscape, 2024
- 4.1 Introduction
- 4.2 Company market share analysis
- 4.3 Competitive positioning matrix
- 4.4 Strategic outlook matrix
Chapter 5 Market Estimates & Forecast, By Type, 2021 – 2034, (USD Billion) (Thousand Units)
- 5.1 Key trends
- 5.2 Watering cans
- 5.3 Drip irrigation kits
- 5.4 Sprinklers
- 5.5 Hose nozzles
- 5.6 Misters
- 5.7 Others (pumps, pipes, valves)
Chapter 6 Market Estimates & Forecast, By Material, 2021 – 2034, (USD Billion) (Thousand Units)
- 6.1 Key trends
- 6.2 Plastic
- 6.3 Metal
- 6.4 Rubber
- 6.5 Others
Chapter 7 Market Estimates & Forecast, By End Use, 2021 – 2034, (USD Billion) (Thousand Units)
- 7.1 Key trends
- 7.2 Agriculture
- 7.3 Residential gardening (home & garden)
- 7.4 Commercial landscaping (parks, gardens, public spaces)
- 7.5 Sports and golf fields
Chapter 8 Market Estimates & Forecast, By Distribution Channel, 2021 – 2034, (USD Billion) (Thousand Units)
- 8.1 Key trends
- 8.2 Direct sales
- 8.3 Indirect sales
Chapter 9 Market Estimates & Forecast, By Region, 2021 – 2034, (USD Billion) (Thousand Units)
- 9.1 Key trends
- 9.2 North America
- 9.2.1 U.S.
- 9.2.2 Canada
- 9.3 Europe
- 9.3.1 Germany
- 9.3.2 UK
- 9.3.3 France
- 9.3.4 Italy
- 9.3.5 Spain
- 9.3.6 Russia
- 9.4 Asia Pacific
- 9.4.1 China
- 9.4.2 India
- 9.4.3 Japan
- 9.4.4 South Korea
- 9.4.5 Australia
- 9.5 Latin America
- 9.5.1 Brazil
- 9.5.2 Mexico
- 9.6 MEA
- 9.6.1 Saudi Arabia
- 9.6.2 UAE
- 9.6.3 South Africa
Chapter 10 Company Profiles
- 10.1 Briggs & Stratton Corporation
- 10.2 Gilmour Manufacturing Company
- 10.3 Hunter Industries Incorporated
- 10.4 Irritrol Systems, Inc.
- 10.5 Jain Irrigation Systems Ltd.
- 10.6 John Deere & Company
- 10.7 K-Rain Manufacturing Corporation
- 10.8 Lindsay Corporation
- 10.9 Netafim Ltd.
- 10.10 Orbit Irrigation Products, Inc.
- 10.11 Rain Bird Corporation
- 10.12 The Scotts Miracle-Gro Company
- 10.13 The Toro Company
- 10.14 T-L Irrigation Company
- 10.15 Valmont Industries, Inc.
 魚泵市場報告:2031 年趨勢、預測與競爭分析
 全球水族箱配件市場
 2025-2033年水族箱配件市場按類型(過濾物品、燈和罩、裝飾物品、溫度控制系統等)、最終用戶(居民、商業)、配銷通路(在線、離線)和地區
 水槽用電熱器及冷卻器的全球市場:產業分析,規模,佔有率,成長,趨勢,預測(2025年~2032年)
 水族箱設備市場:按產品、按水族箱尺寸、按水族箱類型、按銷售管道、按最終應用 - 2025-2030 年全球預測
 魚泵市場:按類型、規模和應用分類 - 2025-2030 年全球預測
 水族箱生命支持系統市場:依產品類型、水族箱類型、應用、銷售管道、材料類型、水族箱尺寸 - 2025-2030 年全球預測
 養魚缸的全球市場:類型·用途·不同地區的預測 (~2032年)
 全球魚泵市場研究報告 - 2023 年至 2030 年行業分析、規模、佔有率、成長、趨勢和預測
 到 2030 年魚泵市場預測 - 按規模、應用、運營模式和地區進行的全球分析