


 |
市場調查報告書
商品編碼
1665437
低功耗下一代顯示器市場機會、成長動力、產業趨勢分析與 2025 - 2034 年預測Low Power Next Generation Display Market Opportunity, Growth Drivers, Industry Trend Analysis, and Forecast 2025 - 2034 |
||||||
2024 年全球低功耗下一代顯示器市場價值為 1.32 億美元,預計 2025 年至 2034 年的複合年成長率為 6.2%。這些發展滿足了擴增實境(AR)和虛擬實境(VR)等應用對高解析度和節能顯示器日益成長的需求。人工智慧和物聯網與這些系統的整合進一步加速了創新,為各種設備提供了智慧和自適應功能。日益增強的環保意識和減少碳足跡的努力正在鼓勵製造商和消費者採用節能解決方案,下一代顯示器正在各個領域獲得關注。
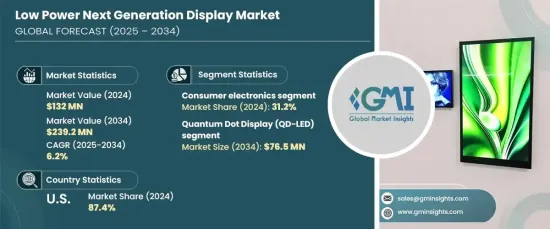
消費性電子產品將成為2024年的主要應用領域,佔據31.2%的市場。智慧型手機、平板電腦、筆記型電腦和穿戴式裝置等裝置是這一領域成長的主要貢獻者,因為它們優先考慮延長電池壽命和卓越的顯示品質。 OLED、MicroLED 和電子紙技術在提供生動的視覺效果同時降低能耗方面發揮關鍵作用。可折疊和靈活設計的轉變也刺激了需求,創新的形式滿足了消費者對便攜性和功能性的期望。 5G 網路和物聯網設備的日益普及確保了該領域的持續擴張。
| 市場範圍 | |
|---|---|
| 起始年份 | 2024 |
| 預測年份 | 2025-2034 |
| 起始值 | 1.32億美元 |
| 預測值 | 2.392億美元 |
| 複合年成長率 | 6.2% |
量子點顯示器(QD-LED)的技術進步使其成為市場上的重要參與者。預計到 2034 年將創造 7,650 萬美元的收入,這些顯示器具有出色的色彩精度、亮度和能源效率。量子點能夠實現精確的發光,在色彩範圍和性能方面優於傳統的 LCD 和 OLED。這些特性使得 QD-LED 顯示器在電視和顯示器等高階電子產品中備受追捧,同時其低能耗要求滿足了對永續解決方案日益成長的需求。
美國在2024年引領北美低功耗下一代顯示器市場,佔該地區營收的87.4%。這種主導地位源自於強勁的消費性電子產業和尖端的研究和發展。 OLED 和 MicroLED 等先進顯示技術廣泛應用於智慧電視、智慧型手機和汽車顯示器等應用。汽車領域,尤其是電動車領域擴大採用節能解決方案,凸顯了低功耗顯示器對於資訊娛樂和平視系統的重要性。此外,物聯網和人工智慧與家用電器和工業應用的整合持續推動市場需求,鞏固了美國在創新和技術進步方面的領先地位。
目錄
第 1 章:方法論與範圍
- 市場範圍和定義
- 基礎估算與計算
- 預測計算
- 資料來源
- 基本的
- 次要
- 付費來源
- 公共資源
第 2 章:執行摘要
第 3 章:產業洞察
- 產業生態系統分析
- 影響價值鏈的因素
- 利潤率分析
- 中斷
- 未來展望
- 製造商
- 經銷商
- 供應商概況
- 利潤率分析
- 重要新聞及舉措
- 監管格局
- 衝擊力
- 成長動力
- 顯示技術的進步
- 節能消費電子產品的需求
- 擴大在穿戴式裝置的應用
- 在工業和醫療保健領域的應用日益廣泛
- 產業陷阱與挑戰
- 生產成本高
- 壽命有限且耐用性問題
- 成長動力
- 成長潛力分析
- 波特的分析
- PESTEL 分析
第4章:競爭格局
- 介紹
- 公司市佔率分析
- 競爭定位矩陣
- 戰略展望矩陣
第 5 章:市場估計與預測:按技術,2021 年至 2034 年
- 主要趨勢
- 量子點顯示器(QD-LED)
- 場發射顯示器 (FED)
- 雷射螢光顯示器 (LPD)
- 有機發光二極體 (OLED)
- 有機發光電晶體 (OLET)
- 表面傳導電子發射顯示器 (SED)
第 6 章:市場估計與預測:按應用,2021 年至 2034 年
- 主要趨勢
- 消費性電子產品
- 家電
- 廣告
- 公開展示
- 自動化
- 航空
第 7 章:市場估計與預測:按地區,2021 年至 2034 年
- 主要趨勢
- 北美洲
- 美國
- 加拿大
- 歐洲
- 英國
- 德國
- 法國
- 義大利
- 西班牙
- 俄羅斯
- 亞太地區
- 中國
- 印度
- 日本
- 韓國
- 澳洲
- 拉丁美洲
- 巴西
- 墨西哥
- 中東及非洲
- 南非
- 沙烏地阿拉伯
- 阿拉伯聯合大公國
第8章:公司簡介
- AU Optronics Corporation
- AUO Corporation
- BOE Technology Group Co., Ltd.
- Doosan Group
- DuPont de Nemours, Inc.
- Futaba Corporation
- LG Display Co., Ltd.
- Nanosys, Inc.
- Novaled GmbH
- Panasonic Corporation
- Philips International BV
- Planar Systems, Inc.
- QUALCOMM Incorporated
- RitDisplay Corporation
- Samsung Electronics Co., Ltd.
- Sharp Corporation
- Sony Corporation
- Tianma Microelectronics Co., Ltd.
- Universal Display Corporation (UDC)
- Visionox Technology, Inc.
The Global Low Power Next Generation Display Market, valued at USD 132 million in 2024, is projected to grow at a CAGR of 6.2% from 2025 to 2034. Advancements in display technology are driving this growth, with significant progress in OLED and MicroLED systems enhancing pixel density, color fidelity, and responsiveness while reducing energy demands. These developments cater to the increasing need for high-resolution and energy-efficient displays in applications like augmented reality (AR) and virtual reality (VR). The integration of AI and IoT into these systems is further accelerating innovation, offering intelligent and adaptive features for a wide range of devices. Rising environmental consciousness and efforts to reduce carbon footprints are encouraging both manufacturers and consumers to adopt energy-efficient solutions, with next-generation displays gaining traction across various sectors.
Consumer electronics emerged as the leading application area in 2024, capturing 31.2% of the market. Devices such as smartphones, tablets, laptops, and wearables are key contributors to this segment's growth, as they prioritize extended battery life and superior display quality. OLED, MicroLED, and e-paper technologies play a pivotal role in delivering vibrant visuals while minimizing energy consumption. The shift toward foldable and flexible designs has also fueled demand, with innovative formats meeting consumer expectations for portability and functionality. The growing adoption of 5G networks and IoT-enabled devices ensures the continued expansion of this segment.
| Market Scope | |
|---|---|
| Start Year | 2024 |
| Forecast Year | 2025-2034 |
| Start Value | $132 million |
| Forecast Value | $239.2 million |
| CAGR | 6.2% |
Technological advancements in Quantum Dot Displays (QD-LED) have positioned them as a prominent player in the market. Expected to generate USD 76.5 million in revenue by 2034, these displays offer exceptional color accuracy, brightness, and energy efficiency. Quantum dots enable precise light emission, outperforming traditional LCDs and OLEDs in terms of color range and performance. These features make QD-LED displays highly sought after in premium electronics, including televisions and monitors, while their low energy requirements address the rising demand for sustainable solutions.
The United States led the North American low-power next-generation display market in 2024, accounting for 87.4% of the region's revenue. This dominance stems from a robust consumer electronics industry and cutting-edge research and development. Advanced display technologies like OLED and MicroLED are widely integrated across applications such as smart TVs, smartphones, and automotive displays. The growing adoption of energy-efficient solutions in the automotive sector, particularly in electric vehicles, underscores the importance of low-power displays for infotainment and heads-up systems. Additionally, the integration of IoT and AI into home appliances and industrial applications continues to propel market demand, reinforcing the US as a leader in innovation and technological advancement.
Table of Contents
Chapter 1 Methodology & Scope
- 1.1 Market scope & definitions
- 1.2 Base estimates & calculations
- 1.3 Forecast calculations
- 1.4 Data sources
- 1.4.1 Primary
- 1.4.2 Secondary
- 1.4.2.1 Paid sources
- 1.4.2.2 Public sources
Chapter 2 Executive Summary
- 2.1 Industry synopsis, 2021-2034
Chapter 3 Industry Insights
- 3.1 Industry ecosystem analysis
- 3.1.1 Factor affecting the value chain
- 3.1.2 Profit margin analysis
- 3.1.3 Disruptions
- 3.1.4 Future outlook
- 3.1.5 Manufacturers
- 3.1.6 Distributors
- 3.2 Supplier landscape
- 3.3 Profit margin analysis
- 3.4 Key news & initiatives
- 3.5 Regulatory landscape
- 3.6 Impact forces
- 3.6.1 Growth drivers
- 3.6.1.1 Advancements in display technology
- 3.6.1.2 Demand for energy-efficient consumer electronics
- 3.6.1.3 Expanding application in wearable devices
- 3.6.1.4 Growing adoption in industrial and healthcare applications
- 3.6.2 Industry pitfalls & challenges
- 3.6.2.1 High production costs
- 3.6.2.2 Limited longevity and durability concerns
- 3.6.1 Growth drivers
- 3.7 Growth potential analysis
- 3.8 Porter’s analysis
- 3.9 PESTEL analysis
Chapter 4 Competitive Landscape, 2024
- 4.1 Introduction
- 4.2 Company market share analysis
- 4.3 Competitive positioning matrix
- 4.4 Strategic outlook matrix
Chapter 5 Market Estimates & Forecast, By Technology, 2021-2034 (USD Million)
- 5.1 Key trends
- 5.2 Quantum Dot Display (QD-LED)
- 5.3 Field Emission Display (FED)
- 5.4 Laser Phosphor Display (LPD)
- 5.5 Organic Light-Emitting Diode (OLED)
- 5.6 Organic Light-Emitting Transistor (OLET)
- 5.7 Surface-Conduction Electron-Emitter Display (SED)
Chapter 6 Market Estimates & Forecast, By Application, 2021-2034 (USD Million)
- 6.1 Key trends
- 6.2 Consumer electronics
- 6.3 Home appliances
- 6.4 Advertising
- 6.5 Public display
- 6.6 Automation
- 6.7 Aviation
Chapter 7 Market Estimates & Forecast, By Region, 2021-2034 (USD Million)
- 7.1 Key trends
- 7.2 North America
- 7.2.1 U.S.
- 7.2.2 Canada
- 7.3 Europe
- 7.3.1 UK
- 7.3.2 Germany
- 7.3.3 France
- 7.3.4 Italy
- 7.3.5 Spain
- 7.3.6 Russia
- 7.4 Asia Pacific
- 7.4.1 China
- 7.4.2 India
- 7.4.3 Japan
- 7.4.4 South Korea
- 7.4.5 Australia
- 7.5 Latin America
- 7.5.1 Brazil
- 7.5.2 Mexico
- 7.6 MEA
- 7.6.1 South Africa
- 7.6.2 Saudi Arabia
- 7.6.3 UAE
Chapter 8 Company Profiles
- 8.1 AU Optronics Corporation
- 8.2 AUO Corporation
- 8.3 BOE Technology Group Co., Ltd.
- 8.4 Doosan Group
- 8.5 DuPont de Nemours, Inc.
- 8.6 Futaba Corporation
- 8.7 LG Display Co., Ltd.
- 8.8 Nanosys, Inc.
- 8.9 Novaled GmbH
- 8.10 Panasonic Corporation
- 8.11 Philips International B.V.
- 8.12 Planar Systems, Inc.
- 8.13 QUALCOMM Incorporated
- 8.14 RitDisplay Corporation
- 8.15 Samsung Electronics Co., Ltd.
- 8.16 Sharp Corporation
- 8.17 Sony Corporation
- 8.18 Tianma Microelectronics Co., Ltd.
- 8.19 Universal Display Corporation (UDC)
- 8.20 Visionox Technology, Inc.
 2025 年至 2033 年顯示器市場報告(按顯示器類型、技術、應用、行業垂直和地區分類)
 2025年Airplay無線顯示全球市場報告
 2025年全球背光顯示器市場報告
 2025年全球監測市場報告
 穿戴式顯示器市場機會、成長動力、產業趨勢分析及 2025-2034 年預測
 數位紙系統市場 - 全球產業規模、佔有率、趨勢、機會和預測,按技術、最終用戶、地區、競爭細分,2020-2030F
 2025-2033 年教室顯示市場(按類型(教育投影機、互動式平板顯示器、互動式桌子、互動式白板、無線平板電腦等)、應用(學校、培訓機構等)和地區)
 IPS 顯示器市場規模、佔有率、成長分析(按類型、應用和地區)- 產業預測,2025 年至 2032 年
 顯示器市場 - 全球產業規模、佔有率、趨勢、機會和預測,按顯示器類型、技術、最終用戶、地區和競爭細分,2019-2029 年
 LED 薄膜屏市場按類型、應用、規模和區域分類