


 |
市場調查報告書
商品編碼
1666999
提高石油採收率的市場機會、成長動力、產業趨勢分析和 2025 - 2034 年預測Enhanced Oil Recovery Market Opportunity, Growth Drivers, Industry Trend Analysis, and Forecast 2025 - 2034 |
||||||
2024 年全球提高石油採收率市場價值為 391 億美元,預計 2025 年至 2034 年期間年複合成長率為 7.5%。這些因素很大程度上歸因於全球工業成長和城市人口的增加。此外,持續的技術進步和持續的探勘活動在增強 EOR 技術方面發揮關鍵作用,進一步促進了該行業的發展。全球能源消耗的成長,特別是受人口成長和城市化推動,以及石油和天然氣生產需求的增加,預計將繼續支持市場擴張。
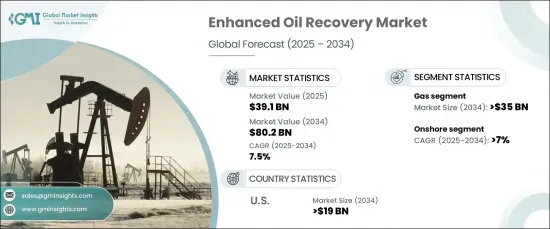
此外,將表面活性劑或聚合物與注水相結合的混合系統的開發有望降低成本並顯著影響該行業。預計減少環境影響的微生物 EOR 方法的引入也將有助於增加市場需求。這些創新有助於提高石油開採過程的效率和環境永續性。隨著這些進步,受不斷成長的能源需求以及對更永續、更具成本效益的能源解決方案的需求的推動,預計到 2034 年天然氣產業的規模將超過 350 億美元。
| 市場範圍 | |
|---|---|
| 起始年份 | 2024 |
| 預測年份 | 2025-2034 |
| 起始值 | 391億美元 |
| 預測值 | 802億美元 |
| 複合年成長率 | 7.5% |
預計到 2034 年,陸上 EOR 領域的年複合成長率(CAGR) 將超過 7%,這得益於陸上油田感測器和資料分析平台等先進技術的整合。這些技術可以實現更好的管理和更有效率的資源開採。
由於新的碳氫化合物發現和政府支持的推廣 EOR 技術的舉措,美國提高石油採收率市場規模預計到 2034 年將超過 190 億美元。人工智慧、自動化和感測器技術的引入進一步提高了石油採收率並最佳化了生產力,為未來幾年市場實現顯著成長奠定了基礎。
隨著石油探勘和生產的不斷擴大,以及有利的監管框架的支持,EOR市場將持續實現積極成長。
目錄
第 1 章:方法論與範圍
- 市場定義
- 基礎估算與計算
- 預測計算
- 資料來源
- 基本的
- 次要
- 有薪資的
- 民眾
第 2 章:執行摘要
第 3 章:產業洞察
- 產業生態系統分析
- 監管格局
- 產業衝擊力
- 成長動力
- 產業陷阱與挑戰
- 成長潛力分析
- 波特的分析
- 供應商的議價能力
- 買家的議價能力
- 新進入者的威脅
- 替代品的威脅
- PESTEL 分析
第4章:競爭格局
- 介紹
- 戰略儀表板
- 創新與永續發展格局
第 5 章:市場規模與預測:依技術,2021 – 2034 年
- 主要趨勢
- 氣體
- 二氧化碳
- 氮
- 其他
- 熱的
- 蒸氣
- 原位燃燒
- 熱水
- 化學
- 聚合物
- 鹼性
- 界面活性劑
- 其他
第 6 章:市場規模與預測:按應用,2021 – 2034 年
- 主要趨勢
- 陸上
- 海上
第 7 章:市場規模及預測:按地區,2021 – 2034 年
- 主要趨勢
- 北美洲
- 美國
- 加拿大
- 墨西哥
- 歐洲
- 德國
- 俄羅斯
- 英國
- 挪威
- 荷蘭
- 亞太地區
- 中國
- 印度
- 印尼
- 馬來西亞
- 中東和非洲
- 沙烏地阿拉伯
- 阿拉伯聯合大公國
- 阿曼
- 土耳其
- 奈及利亞
- 埃及
- 拉丁美洲
- 巴西
第8章:公司簡介
- ADNOC
- Baker Hughes
- BP
- Cenovus
- Chevron
- CNPC
- ConocoPhillips
- ExxonMobil
- Halliburton
- Kinder Morgan
- Linde
- Lukoil
- Occidental
- SLB
- Titan Oil Recovery
- TotalEnergies
The Global Enhanced Oil Recovery Market was valued at USD 39.1 billion in 2024 and is expected to grow at a CAGR of 7.5% annually from 2025 to 2034. This market growth is driven by several factors, including the decreasing output from existing fields, the increasing number of mature wells, and the surging demand for crude oil and petroleum products. These factors are largely due to industrial growth and the rising urban population worldwide. Additionally, ongoing technological advancements and continued exploration activities are playing a key role in enhancing EOR techniques, further boosting the industry. The rise in global energy consumption, particularly driven by population growth and urbanization, alongside increasing oil and gas production requirements, is expected to continue supporting market expansion.
Furthermore, the development of hybrid systems, which combine surfactants or polymers with water flooding, is expected to reduce costs and significantly influence the industry. The introduction of microbial EOR methods, which reduce environmental impact, is also expected to contribute to increased market demand. These innovations are helping improve the efficiency and environmental sustainability of oil extraction processes. In line with these advancements, the gas sector is projected to surpass USD 35 billion by 2034, fueled by growing energy demand and the need for more sustainable and cost-effective energy solutions.
| Market Scope | |
|---|---|
| Start Year | 2024 |
| Forecast Year | 2025-2034 |
| Start Value | $39.1 Billion |
| Forecast Value | $80.2 Billion |
| CAGR | 7.5% |
The onshore EOR segment is anticipated to witness a compound annual growth rate (CAGR) of over 7% through 2034, driven by the integration of advanced technologies such as sensors and data analytics platforms in onshore oil fields. These technologies enable better management and more efficient resource extraction.
The U.S. enhanced oil recovery market is expected to exceed USD 19 billion by 2034, bolstered by new hydrocarbon discoveries and government-backed initiatives to promote EOR techniques. The introduction of artificial intelligence, automation, and sensor technologies further enhances oil recovery and optimizes production rates, positioning the market for significant growth in the coming years.
With continuous expansion in oil exploration and production, supported by favorable regulatory frameworks, the EOR market is set to experience ongoing positive growth.
Table of Contents
Chapter 1 Methodology & Scope
- 1.1 Market definitions
- 1.2 Base estimates & calculations
- 1.3 Forecast calculation
- 1.4 Data sources
- 1.4.1 Primary
- 1.4.2 Secondary
- 1.4.2.1 Paid
- 1.4.2.2 Public
Chapter 2 Executive Summary
- 2.1 Industry synopsis, 2021 - 2034
Chapter 3 Industry Insights
- 3.1 Industry ecosystem analysis
- 3.2 Regulatory landscape
- 3.3 Industry impact forces
- 3.3.1 Growth drivers
- 3.3.2 Industry pitfalls & challenges
- 3.4 Growth potential analysis
- 3.5 Porter's analysis
- 3.5.1 Bargaining power of suppliers
- 3.5.2 Bargaining power of buyers
- 3.5.3 Threat of new entrants
- 3.5.4 Threat of substitutes
- 3.6 PESTEL analysis
Chapter 4 Competitive Landscape, 2024
- 4.1 Introduction
- 4.2 Strategic dashboard
- 4.3 Innovation & sustainability landscape
Chapter 5 Market Size and Forecast, By Technology, 2021 – 2034 (USD Million, Billion Barrels)
- 5.1 Key trends
- 5.2 Gas
- 5.2.1 CO2
- 5.2.2 Nitrogen
- 5.2.3 Others
- 5.3 Thermal
- 5.3.1 Steam
- 5.3.2 In-situ combustion
- 5.3.3 Hot water
- 5.4 Chemical
- 5.4.1 Polymer
- 5.4.2 Alkaline
- 5.4.3 Surfactant
- 5.5 Others
Chapter 6 Market Size and Forecast, By Application, 2021 – 2034 (USD Million, Billion Barrels)
- 6.1 Key trends
- 6.2 Onshore
- 6.3 Offshore
Chapter 7 Market Size and Forecast, By Region, 2021 – 2034 (USD Million, Billion Barrels)
- 7.1 Key trends
- 7.2 North America
- 7.2.1 U.S
- 7.2.2 Canada
- 7.2.3 Mexico
- 7.3 Europe
- 7.3.1 Germany
- 7.3.2 Russia
- 7.3.3 UK
- 7.3.4 Norway
- 7.3.5 Netherlands
- 7.4 Asia Pacific
- 7.4.1 China
- 7.4.2 India
- 7.4.3 Indonesia
- 7.4.4 Malaysia
- 7.5 Middle East & Africa
- 7.5.1 Saudi Arabia
- 7.5.2 UAE
- 7.5.3 Oman
- 7.5.4 Türkiye
- 7.5.5 Nigeria
- 7.5.6 Egypt
- 7.6 Latin America
- 7.6.1 Brazil
Chapter 8 Company Profiles
- 8.1 ADNOC
- 8.2 Baker Hughes
- 8.3 BP
- 8.4 Cenovus
- 8.5 Chevron
- 8.6 CNPC
- 8.7 ConocoPhillips
- 8.8 ExxonMobil
- 8.9 Halliburton
- 8.10 Kinder Morgan
- 8.11 Linde
- 8.12 Lukoil
- 8.13 Occidental
- 8.14 SLB
- 8.15 Titan Oil Recovery
- 8.16 TotalEnergies
 按技術、應用和地區提高採收率市場
 化學提高採收率市場(依產品類型、油藏類型、最終用戶和通路分類)-2025-2032年全球預測按方法、儲存類型、採收機制、應用和部署類型提高採收率市場-2025-2032 年全球預測
 全球微生物提高採收率市場
 美國的提高石油採收率用奈米粒子市場:類型·注射法·各地區的機會及預測 (2018-2032年)
 2025年提高採收率全球市場報告
 強化採油市場(依技術、應用、最終用戶、國家及地區)-2025 年至 2032 年全球產業分析、市場規模、市場佔有率及預測奈米顆粒在強化採油市場的評估:按類型、注入方法和地區劃分的機會與預測(2018-2032 年)
 化學的提高石油採收率 (EOR) 市場:2025-2035年
 提高採收率市場規模、佔有率及成長分析(依技術、應用及地區)-2025-2032 年產業預測