


 |
市場調查報告書
商品編碼
1667189
高光譜成像系統市場機會、成長動力、產業趨勢分析與 2025 - 2034 年預測Hyperspectral Imaging Systems Market Opportunity, Growth Drivers, Industry Trend Analysis, and Forecast 2025 - 2034 |
||||||
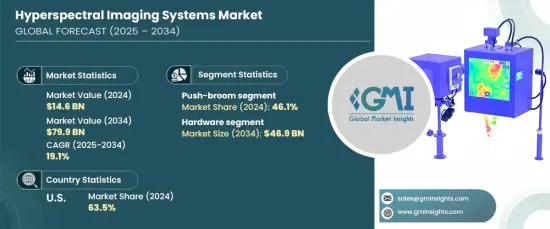
2024 年全球高光譜成像系統市場價值為 146 億美元,預計 2025 年至 2034 年期間的複合年成長率為 19.1%。這些創新促進了緊湊型高光譜相機和輕型感測器的發展,它們可以整合到無人機、無人駕駛飛行器(UAV)和攜帶式設備中,使該技術更加容易獲得。高光譜成像擴大用於遙感和實地調查,並擴大其在地質、林業和災害管理等領域的影響力。此外,採用簡介高光譜相機和推掃式掃描器等先進的掃描技術簡化了操作,使系統更易於小型行業使用。這些技術突破為各領域的高光譜成像打開了新的大門。
食品和飲料等需要精確品質控制的行業對高光譜成像系統的需求特別高。這些系統正成為檢測污染物、確保食品安全和監測產品品質的重要工具。高光譜成像可以有效識別食品中的外來物、腐敗和不一致之處,支持更嚴格的食品安全法規和消費者對高品質產品日益成長的需求。
| 市場範圍 | |
|---|---|
| 起始年份 | 2024 |
| 預測年份 | 2025-2034 |
| 起始值 | 146億美元 |
| 預測值 | 799億美元 |
| 複合年成長率 | 19.1% |
根據技術,市場可分為推掃式、簡介式和掃掃式高光譜成像。推掃式高光譜成像領域在 2024 年佔據最大佔有率,佔 46.1% 的市場。推掃技術因其較高的空間和光譜解析度而受到廣泛青睞,可以捕獲詳細的光譜資料,特別是在農業、環境監測和國防監視等應用領域。然而,雖然該技術提供了出色的性能,但它需要在掃描過程中進行精確的運動控制和對準,這使得部署更加複雜和更昂貴。
高光譜成像系統市場也分為硬體和軟體部分。預計到 2034 年硬體部分將創收 469資料美元。隨著感測器技術和小型化的進步,對緊湊型和攜帶式高光譜成像解決方案的需求激增。這些改進使得在無人機、無人駕駛飛機和手持設備中部署高光譜成像系統成為可能,從而擴大了其在農業、國防和醫療保健等領域的用途。
2024 年,美國將佔據北美市場的 63.5% 的主導佔有率,這得益於國防、航太和醫療保健領域的大量投資。美國國防部利用高光譜成像進行軍事監視、目標偵測和邊境安全。此外,醫療保健產業也受益於這些系統進行非侵入性診斷、疾病檢測和手術指導。精準農業和食品安全領域高光譜成像的日益普及,以及研究機構和政府措施的大力支持也推動了美國市場的成長。
目錄
第 1 章:方法論與範圍
- 市場範圍和定義
- 基礎估算與計算
- 預測計算
- 資料來源
- 基本的
- 次要
- 付費來源
- 公共資源
第 2 章:執行摘要
第 3 章:產業洞察
- 產業生態系統分析
- 影響價值鏈的因素
- 利潤率分析
- 中斷
- 未來展望
- 製造商
- 經銷商
- 供應商概況
- 利潤率分析
- 重要新聞及舉措
- 監管格局
- 衝擊力
- 成長動力
- 感測器和小型化的技術進步
- 食品和飲料品質控制需求增加
- 在農業和環境監測的應用
- 國防和監視應用的需求不斷成長
- 產業陷阱與挑戰
- 實施成本高且複雜
- 缺乏標準化資料處理和熟練的勞動力
- 成長動力
- 成長潛力分析
- 波特的分析
- PESTEL 分析
第4章:競爭格局
- 介紹
- 公司市佔率分析
- 競爭定位矩陣
- 戰略展望矩陣
第 5 章:市場估計與預測:按組件,2021 年至 2034 年
- 主要趨勢
- 硬體
- 相機
- 感應器
- 鏡頭
- 偵測器
- 軟體
- 影像處理軟體
- 數據分析軟體:
- 視覺化軟體
- 校準軟體
- 光譜分析軟體
- 機器學習和人工智慧軟體
第 6 章:市場估計與預測:按技術,2021 年至 2034 年
- 主要趨勢
- 推掃式高光譜成像
- 簡介高光譜成像
- Whiskbroom 高光譜成像
- 其他
第 7 章:市場估計與預測:按光譜範圍,2021 年至 2034 年
- 主要趨勢
- 可見光/近紅外線 (VNIR)
- 短波紅外線 (SWIR)
- 長波紅外線 (LWIR)
第 8 章:市場估計與預測:按應用,2021 年至 2034 年
- 主要趨勢
- 農業
- 醫療診斷
- 環境監測
- 食品和飲料
- 工業檢測
- 其他
第 9 章:市場估計與預測:按地區,2021 年至 2034 年
- 主要趨勢
- 北美洲
- 美國
- 加拿大
- 歐洲
- 英國
- 德國
- 法國
- 義大利
- 西班牙
- 俄羅斯
- 亞太地區
- 中國
- 印度
- 日本
- 韓國
- 澳洲
- 拉丁美洲
- 巴西
- 墨西哥
- 中東及非洲
- 南非
- 沙烏地阿拉伯
- 阿拉伯聯合大公國
第10章:公司簡介
- Applied Spectral Imaging
- BaySpec, Inc.
- ClydeHSI
- Corning Incorporated
- Cubert GmbH
- Diaspective Vision
- Gamaya
- Headwall Photonics, Inc.
- Hinalea Imaging Corp.
- HyperMed Imaging, Inc.
- imec
- Malvern Panalytical Ltd
- Norsk Elektro Optikk AS
- Orbital Sidekick
- Photon Etc
- Resonon
- Specim, Spectral Imaging Ltd.
- Surface Optics Corporation
- Telops Inc.
- XIMEA GmbH
The Global Hyperspectral Imaging Systems Market was valued at USD 14.6 billion in 2024 and is expected to expand at a CAGR of 19.1% from 2025 to 2034. The market growth is driven by continuous advancements in hyperspectral imaging technology, such as sensor miniaturization, enhanced spectral resolution, and cost-effective solutions. These innovations have led to the development of compact hyperspectral cameras and lightweight sensors that can be integrated into drones, unmanned aerial vehicles (UAVs), and portable devices, making the technology more accessible. Hyperspectral imaging is increasingly used for remote sensing and field surveys, expanding its presence in sectors like geology, forestry, and disaster management. Additionally, the adoption of advanced scanning technologies like snapshot hyperspectral cameras and push-broom scanners has simplified operations and made the systems easier to use for smaller industries. These technological breakthroughs are opening new doors for hyperspectral imaging in various fields.
The demand for hyperspectral imaging systems is particularly high in industries that require precise quality control, such as food and beverages. These systems are becoming vital tools for detecting contaminants, ensuring food safety, and monitoring product quality. Hyperspectral imaging can effectively identify foreign materials, spoilage, and inconsistencies in food items, supporting stricter food safety regulations and the growing consumer demand for high-quality products.
| Market Scope | |
|---|---|
| Start Year | 2024 |
| Forecast Year | 2025-2034 |
| Start Value | $14.6 billion |
| Forecast Value | $79.9 billion |
| CAGR | 19.1% |
The market can be categorized by technology into push-broom, snapshot, and whiskbroom hyperspectral imaging. The push-broom hyperspectral imaging segment was the largest in 2024, accounting for 46.1% of the market. Push-broom technology is widely favored due to its high spatial and spectral resolution, allowing for detailed spectral data capture, especially in applications like agriculture, environmental monitoring, and defense surveillance. However, while this technology provides excellent performance, its need for precise motion control and alignment during scanning makes deployment more complex and costly.
The hyperspectral imaging systems market is also divided into hardware and software components. The hardware segment is expected to generate USD 46.9 billion by 2034. This segment includes key components such as hyperspectral sensors, cameras, light sources, and data acquisition systems. With advancements in sensor technology and miniaturization, the demand for compact and portable hyperspectral imaging solutions has surged. These improvements make it possible to deploy hyperspectral imaging systems in drone, UAV, and handheld formats, expanding their use in fields like agriculture, defense, and healthcare.
In 2024, the U.S. held the dominant share of the North American market at 63.5%, driven by substantial investments in defense, aerospace, and healthcare. The U.S. Department of Defense utilizes hyperspectral imaging for military surveillance, target detection, and border security. Additionally, the healthcare industry benefits from these systems for non-invasive diagnostics, disease detection, and surgical guidance. The U.S. market's growth is also supported by the increasing adoption of hyperspectral imaging in precision agriculture and food safety, along with a strong presence of research institutions and government initiatives.
Table of Contents
Chapter 1 Methodology & Scope
- 1.1 Market scope & definitions
- 1.2 Base estimates & calculations
- 1.3 Forecast calculations
- 1.4 Data sources
- 1.4.1 Primary
- 1.4.2 Secondary
- 1.4.2.1 Paid sources
- 1.4.2.2 Public sources
Chapter 2 Executive Summary
- 2.1 Industry synopsis, 2021-2034
Chapter 3 Industry Insights
- 3.1 Industry ecosystem analysis
- 3.1.1 Factor affecting the value chain
- 3.1.2 Profit margin analysis
- 3.1.3 Disruptions
- 3.1.4 Future outlook
- 3.1.5 Manufacturers
- 3.1.6 Distributors
- 3.2 Supplier landscape
- 3.3 Profit margin analysis
- 3.4 Key news & initiatives
- 3.5 Regulatory landscape
- 3.6 Impact forces
- 3.6.1 Growth drivers
- 3.6.1.1 Technological advancements in sensors and miniaturization
- 3.6.1.2 Increased demand in food and beverage quality control
- 3.6.1.3 Adoption in agriculture and environmental monitoring
- 3.6.1.4 Rising demand in defense and surveillance applications
- 3.6.2 Industry pitfalls & challenges
- 3.6.2.1 High implementation costs and complexity
- 3.6.2.2 Lack of standardized data processing and skilled workforce
- 3.6.1 Growth drivers
- 3.7 Growth potential analysis
- 3.8 Porter’s analysis
- 3.9 PESTEL analysis
Chapter 4 Competitive Landscape, 2024
- 4.1 Introduction
- 4.2 Company market share analysis
- 4.3 Competitive positioning matrix
- 4.4 Strategic outlook matrix
Chapter 5 Market Estimates & Forecast, By Component, 2021-2034 (USD Billion)
- 5.1 Key trends
- 5.2 Hardware
- 5.2.1 Cameras
- 5.2.2 Sensors
- 5.2.3 Lenses
- 5.2.4 Detectors
- 5.3 Software
- 5.3.1 Image processing software
- 5.3.2 Data analysis software:
- 5.3.3 Visualization software
- 5.3.4 Calibration software
- 5.3.5 Spectral analysis software
- 5.3.6 Machine learning and AI software
Chapter 6 Market Estimates & Forecast, By Technology, 2021-2034 (USD Billion)
- 6.1 Key trends
- 6.2 Push-broom hyperspectral imaging
- 6.3 Snapshot hyperspectral imaging
- 6.4 Whiskbroom hyperspectral imaging
- 6.5 Others
Chapter 7 Market Estimates & Forecast, By Spectrum Range, 2021-2034 (USD Billion)
- 7.1 Key trends
- 7.2 Visible/Near-Infrared (VNIR)
- 7.3 Shortwave Infrared (SWIR)
- 7.4 Longwave Infrared (LWIR)
Chapter 8 Market Estimates & Forecast, By Application, 2021-2034 (USD Billion)
- 8.1 Key trends
- 8.2 Agriculture
- 8.3 Medical diagnostics
- 8.4 Environmental monitoring
- 8.5 Food and beverages
- 8.6 Industrial inspection
- 8.7 Others
Chapter 9 Market Estimates & Forecast, By Region, 2021-2034 (USD Billion)
- 9.1 Key trends
- 9.2 North America
- 9.2.1 U.S.
- 9.2.2 Canada
- 9.3 Europe
- 9.3.1 UK
- 9.3.2 Germany
- 9.3.3 France
- 9.3.4 Italy
- 9.3.5 Spain
- 9.3.6 Russia
- 9.4 Asia Pacific
- 9.4.1 China
- 9.4.2 India
- 9.4.3 Japan
- 9.4.4 South Korea
- 9.4.5 Australia
- 9.5 Latin America
- 9.5.1 Brazil
- 9.5.2 Mexico
- 9.6 MEA
- 9.6.1 South Africa
- 9.6.2 Saudi Arabia
- 9.6.3 UAE
Chapter 10 Company Profiles
- 10.1 Applied Spectral Imaging
- 10.2 BaySpec, Inc.
- 10.3 ClydeHSI
- 10.4 Corning Incorporated
- 10.5 Cubert GmbH
- 10.6 Diaspective Vision
- 10.7 Gamaya
- 10.8 Headwall Photonics, Inc.
- 10.9 Hinalea Imaging Corp.
- 10.10 HyperMed Imaging, Inc.
- 10.11 imec
- 10.12 Malvern Panalytical Ltd
- 10.13 Norsk Elektro Optikk AS
- 10.14 Orbital Sidekick
- 10.15 Photon Etc
- 10.16 Resonon
- 10.17 Specim, Spectral Imaging Ltd.
- 10.18 Surface Optics Corporation
- 10.19 Telops Inc.
- 10.20 XIMEA GmbH
 2025年高高光譜遙測影像系統全球市場報告
 高光譜影像市場:按類型、應用、最終用戶和地區分類
 高光譜影像:技術與全球市場
 醫學中的頻譜成像:評估技術趨勢和成長機會
 全球醫療高光譜成像市場:產業分析、規模、佔有率、成長、趨勢和預測,2025-2032年高光譜成像系統市場 - 全球產業規模、佔有率、趨勢、機會和預測,按產品、技術、應用、地區和競爭細分,2020-2030F高光譜遙測影像系統市場規模、佔有率、成長分析(按產品、按波長、按技術、按應用、按地區)- 產業預測,2024-2031 年
 高光譜遙測影像系統市場:依產品、技術、頻譜範圍、應用、最終用途 - 2025-2030 年全球預測高光譜影像市場規模、佔有率、成長分析、按類型、按技術、按波長、按最終用戶、按地區 - 行業預測,2024-2031 年高光譜影像系統市場,規模,佔有率,趨勢,產業分析報告:各產品,各技術,各用途,各地區 - 市場預測 2025年~2034年