


 |
市場調查報告書
商品編碼
1684661
光譜感測器市場機會、成長動力、產業趨勢分析及 2025 - 2034 年預測Spectral Sensor Market Opportunity, Growth Drivers, Industry Trend Analysis, and Forecast 2025 - 2034 |
||||||
2024 年全球光譜感測器市場價值為 14 億美元,預計將大幅成長,預計 2025 年至 2034 年的複合年成長率為 12.9%。光譜感測器處於這一轉變的最前沿,使農民能夠深入了解作物健康、土壤條件和營養水平。
透過提供即時資料,光譜感測器有助於最佳化肥料、水利用和病蟲害防治等投入,最終提高作物產量並實現更有效率的資源管理。隨著全球農業轉向更多技術驅動的實踐,光譜感測器的採用預計將上升,從而支持數位化農業的更廣泛趨勢。除了農業之外,市場還受到環境監測、醫療保健和汽車等行業日益成長的興趣,精準的數據驅動洞察力對於這些行業至關重要。
| 市場範圍 | |
|---|---|
| 起始年份 | 2024 |
| 預測年份 | 2025-2034 |
| 起始值 | 14億美元 |
| 預測值 | 46億美元 |
| 複合年成長率 | 12.9% |
市場分為兩種主要的感測器類型:多光譜感測器和高光譜感測器。高光譜感測器市場規模預計到 2034 年達到 26 億美元,這得益於其捕獲高度詳細的光譜資料的能力。高光譜感測器提供更高解析度的資訊,使其成為需要精確材料檢測或環境分析的行業必不可少的。然而,更常用的是多光譜感測器,它可以在有限範圍的光譜帶(通常在三到十個之間)內捕獲資料。這些感測器在農業、環境監測和遙感領域特別受歡迎,因為它們能夠以更實惠的成本檢測植被健康狀況、土壤狀況和水質並提供可操作的見解。它們的簡單性和有效性使其成為不需要高光譜感測器的高解析度功能的行業的理想選擇。
從技術方面來看,光譜感測器市場進一步細分為成像感測器和非成像感測器。非影像感測器領域正在快速成長,預計 2025 年至 2034 年之間的複合年成長率為 14.4%。另一方面,成像光譜感測器用於需要高解析度資料的應用,例如精準農業和詳細的環境評估。這些感測器可以捕獲空間和光譜資訊,從而對場景進行徹底的分析。它們與無人機和衛星的結合可進行大規模資料收集,成為市場成長的主要驅動力。
2024 年,美國光譜感測器市場佔有 74.6% 的佔有率。這種主導地位的推動因素包括技術的快速進步、精準農業的大量投資以及環境監測和醫療保健領域的日益普及。美國是光譜感測器市場主要參與者的所在地,其強大的研發能力推動了持續創新。政府致力於推廣永續農業實踐和先進農業技術的舉措進一步加速了光譜感測器在各個行業的應用。此外,光譜感測器在汽車和消費性電子產品領域的應用日益廣泛,為市場擴張提供了進一步的動力。
目錄
第 1 章:方法論與範圍
- 市場範圍和定義
- 基礎估算與計算
- 預測計算
- 資料來源
- 基本的
- 次要
- 付費來源
- 公共資源
第 2 章:執行摘要
第 3 章:產業洞察
- 產業生態系統分析
- 影響價值鏈的因素
- 利潤率分析
- 中斷
- 未來展望
- 製造商
- 經銷商
- 供應商概況
- 利潤率分析
- 重要新聞及舉措
- 監管格局
- 衝擊力
- 成長動力
- 精準農業需求不斷成長
- 擴大環境監測應用
- 消費性電子產品的進步
- 汽車業採用率不斷提高
- 增加對生物醫學應用的投資
- 產業陷阱與挑戰
- 資料處理與管理挑戰
- 初始成本高且整合複雜
- 成長動力
- 成長潛力分析
- 波特的分析
- PESTEL 分析
第4章:競爭格局
- 介紹
- 公司市佔率分析
- 競爭定位矩陣
- 戰略展望矩陣
第 5 章:市場估計與預測:按產品類型,2021-2034 年
- 主要趨勢
- 多光譜感測器
- 高光譜感測器
第 6 章:市場估計與預測:按技術,2021 年至 2034 年
- 主要趨勢
- 影像學
- 非影像
第 7 章:市場估計與預測:按應用,2021 年至 2034 年
- 主要趨勢
- 農業
- 環境監測
- 衛生保健
- 食品和飲料
- 航太和國防
- 其他
第 8 章:市場估計與預測:按地區,2021 年至 2034 年
- 主要趨勢
- 北美洲
- 美國
- 加拿大
- 歐洲
- 英國
- 德國
- 法國
- 義大利
- 西班牙
- 俄羅斯
- 亞太地區
- 中國
- 印度
- 日本
- 韓國
- 澳洲
- 拉丁美洲
- 巴西
- 墨西哥
- 中東及非洲
- 南非
- 沙烏地阿拉伯
- 阿拉伯聯合大公國
第9章:公司簡介
- Axiom Semiconductor
- BAE Systems
- BaySpec, Inc.
- Corning Incorporated
- FLIR Systems
- Hamamatsu Photonics KK
- Hyperspectral Imaging Systems LLC
- L3Harris Technologies
- Lockheed Martin
- Middleton Spectral Vision
- Pepperl+Fuchs, Inc.
- Raytheon Technologies
- Sensors Unlimited (UTC)
- SRI International
- Teledyne Technologies
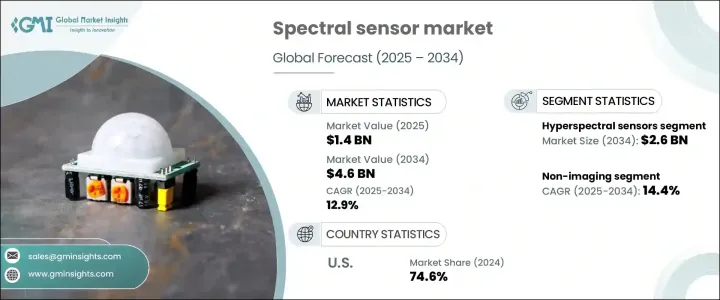
The Global Spectral Sensor Market, valued at USD 1.4 billion in 2024, is on track to experience substantial growth, with a projected CAGR of 12.9% from 2025 to 2034. This growth is being fueled by the rising demand for more precise agricultural solutions as the world faces the challenges of increasing food demand and the growing emphasis on sustainable farming. Spectral sensors are at the forefront of this transformation, enabling farmers to gain valuable insights into crop health, soil conditions, and nutrient levels.
By providing real-time data, spectral sensors help optimize inputs like fertilizers, water usage, and pest control, ultimately leading to better crop yields and more efficient resource management. As global agriculture shifts toward more technology-driven practices, the adoption of spectral sensors is expected to rise, supporting the broader trend of digital farming. Beyond agriculture, the market is also experiencing increased interest from industries such as environmental monitoring, healthcare, and automotive, where precise, data-driven insights are critical.
| Market Scope | |
|---|---|
| Start Year | 2024 |
| Forecast Year | 2025-2034 |
| Start Value | $1.4 Billion |
| Forecast Value | $4.6 Billion |
| CAGR | 12.9% |
The market is divided into two primary sensor types: multispectral and hyperspectral sensors. The hyperspectral sensor segment is poised to reach USD 2.6 billion by 2034, driven by its ability to capture highly detailed spectral data. Hyperspectral sensors provide a higher resolution of information, making them essential in industries that require precise material detection or environmental analysis. However, multispectral sensors, which capture data across a limited range of spectral bands (usually between three to ten), are more commonly used. These sensors are particularly favored in agriculture, environmental monitoring, and remote sensing for their ability to detect vegetation health, soil conditions, and water quality with actionable insights at a more affordable cost. Their simplicity and effectiveness make them an attractive option for industries that don't require the high-resolution capabilities of hyperspectral sensors.
In terms of technology, the spectral sensor market is further segmented into imaging and non-imaging sensors. The non-imaging sensor segment is growing at a rapid pace, with a projected CAGR of 14.4% between 2025 and 2034. Non-imaging sensors are often simpler and more cost-effective, making them ideal for widespread use in applications like agriculture and environmental monitoring. On the other hand, imaging spectral sensors are used in applications requiring high-resolution data, such as precision agriculture and detailed environmental assessments. These sensors can capture both spatial and spectral information, providing a thorough analysis of a scene. Their integration with drones and satellites for large-scale data collection has been a key driver of market growth.
In 2024, the U.S. spectral sensor market held a commanding 74.6% share. This dominance is driven by rapid technological advancements, significant investments in precision agriculture, and growing adoption in environmental monitoring and healthcare sectors. The U.S. is home to major players in the spectral sensor market, bolstered by strong research and development capabilities that foster continuous innovation. Government initiatives aimed at promoting sustainable agricultural practices and advanced farming techniques are further accelerating the use of spectral sensors across industries. Additionally, the growing application of spectral sensors in automotive and consumer electronics is providing further impetus to market expansion.
Table of Contents
Chapter 1 Methodology & Scope
- 1.1 Market scope & definitions
- 1.2 Base estimates & calculations
- 1.3 Forecast calculations
- 1.4 Data sources
- 1.4.1 Primary
- 1.4.2 Secondary
- 1.4.2.1 Paid sources
- 1.4.2.2 Public sources
Chapter 2 Executive Summary
- 2.1 Industry synopsis, 2021-2034
Chapter 3 Industry Insights
- 3.1 Industry ecosystem analysis
- 3.1.1 Factor affecting the value chain
- 3.1.2 Profit margin analysis
- 3.1.3 Disruptions
- 3.1.4 Future outlook
- 3.1.5 Manufacturers
- 3.1.6 Distributors
- 3.2 Supplier landscape
- 3.3 Profit margin analysis
- 3.4 Key news & initiatives
- 3.5 Regulatory landscape
- 3.6 Impact forces
- 3.6.1 Growth drivers
- 3.6.1.1 Increasing demand for precision agriculture
- 3.6.1.2 Expanding applications in environmental monitoring
- 3.6.1.3 Advancements in consumer electronics
- 3.6.1.4 Rising adoption in the automotive industry
- 3.6.1.5 Increasing investments in biomedical applications
- 3.6.2 Industry pitfalls & challenges
- 3.6.2.1 Data processing and management challenges
- 3.6.2.2 High initial costs and complex integration
- 3.6.1 Growth drivers
- 3.7 Growth potential analysis
- 3.8 Porter's analysis
- 3.9 PESTEL analysis
Chapter 4 Competitive Landscape, 2024
- 4.1 Introduction
- 4.2 Company market share analysis
- 4.3 Competitive positioning matrix
- 4.4 Strategic outlook matrix
Chapter 5 Market Estimates & Forecast, By Product Type, 2021-2034 (USD Billion) (Million Units)
- 5.1 Key trends
- 5.2 Multispectral sensors
- 5.3 Hyperspectral sensors
Chapter 6 Market Estimates & Forecast, By Technology, 2021-2034 (USD Billion) (Million Units)
- 6.1 Key trends
- 6.2 Imaging
- 6.3 Non-imaging
Chapter 7 Market Estimates & Forecast, By Application, 2021-2034 (USD Billion) (Million Units)
- 7.1 Key trends
- 7.2 Agriculture
- 7.3 Environmental monitoring
- 7.4 Healthcare
- 7.5 Food & beverage
- 7.6 Aerospace & defense
- 7.7 Others
Chapter 8 Market Estimates & Forecast, By Region, 2021-2034 (USD Billion) (Million Units)
- 8.1 Key trends
- 8.2 North America
- 8.2.1 U.S.
- 8.2.2 Canada
- 8.3 Europe
- 8.3.1 UK
- 8.3.2 Germany
- 8.3.3 France
- 8.3.4 Italy
- 8.3.5 Spain
- 8.3.6 Russia
- 8.4 Asia Pacific
- 8.4.1 China
- 8.4.2 India
- 8.4.3 Japan
- 8.4.4 South Korea
- 8.4.5 Australia
- 8.5 Latin America
- 8.5.1 Brazil
- 8.5.2 Mexico
- 8.6 MEA
- 8.6.1 South Africa
- 8.6.2 Saudi Arabia
- 8.6.3 UAE
Chapter 9 Company Profiles
- 9.1 Axiom Semiconductor
- 9.2 BAE Systems
- 9.3 BaySpec, Inc.
- 9.4 Corning Incorporated
- 9.5 FLIR Systems
- 9.6 Hamamatsu Photonics K.K.
- 9.7 Hyperspectral Imaging Systems LLC
- 9.8 L3Harris Technologies
- 9.9 Lockheed Martin
- 9.10 Middleton Spectral Vision
- 9.11 Pepperl+Fuchs, Inc.
- 9.12 Raytheon Technologies
- 9.13 Sensors Unlimited (UTC)
- 9.14 SRI International
- 9.15 Teledyne Technologies
 2025年酒精感測器全球市場報告
 重力感測器市場報告:趨勢、預測和競爭分析(至 2031 年)電子倍增管市場報告:趨勢、預測和競爭分析(至 2031 年)
 賽車運動用感測器的全球市場 (~2032年):感測器類型·類型·賽車類型·銷售管道·各地區
 色彩對比感測器市場規模、佔有率和成長分析(按技術、垂直和地區)- 產業預測 2025-2032
 電梯地震感測器市場-2025年至2030年的預測2030 年波前感測器市場預測:按類型、波長、應用、最終用戶和地區進行全球分析自由落體感測器市場:現狀分析與未來預測 (2024年~2032年)
 毫米波感測器和模組的全球市場規模、佔有率和趨勢分析:按頻寬、應用和區域分類的展望和預測(2024-2031)
 2025-2033 年日本感測器市場報告(按參數測量、操作模式、最終用途產業和地區)