


 |
市場調查報告書
商品編碼
1698318
WiMAX(全球微波接入互通性)市場機會、成長動力、產業趨勢分析及 2025-2034 年預測WiMAX (Worldwide Interoperability for Microwave Access) Market Opportunity, Growth Drivers, Industry Trend Analysis, and Forecast 2025-2034 |
||||||
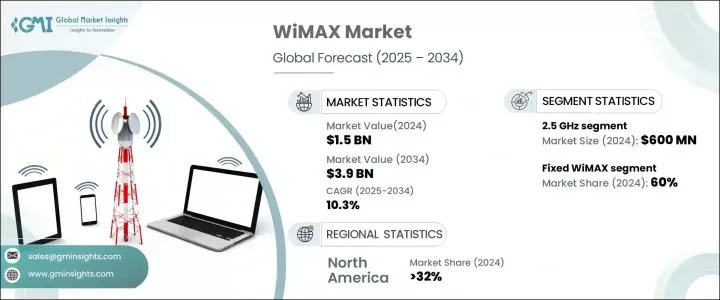
2024 年全球 WiMAX 市場價值為 15 億美元,預計 2025 年至 2034 年期間的複合年成長率為 10.3%。隨著各行各業數位轉型的加速,對高速網路的需求持續激增。 WiMAX 技術在彌合連接差距方面發揮著至關重要的作用,尤其是在傳統寬頻基礎設施仍然有限的農村和低度開發地區。與需要大量基礎工作和高額投資的 DSL 或光纖不同,WiMAX 無需複雜的基礎設施即可提供高速網際網路,提供了高效的替代方案。
對於希望擴大網路覆蓋範圍而又不需要承擔固定線路網路的高成本和延遲的服務供應商來說,這是一個有吸引力的選擇。遠距工作、線上教育、遠距醫療和數位銀行的日益成長的趨勢進一步推動了對可靠寬頻解決方案的需求,使得 WiMAX 成為不斷發展的網際網路生態系統中的關鍵技術。隨著無線通訊的不斷進步、頻譜效率的提高以及對 5G 技術的投資不斷增加,WiMAX 預計將在未來十年獲得進一步的發展。
| 市場範圍 | |
|---|---|
| 起始年份 | 2024 |
| 預測年份 | 2025-2034 |
| 起始值 | 15億美元 |
| 預測值 | 39億美元 |
| 複合年成長率 | 10.3% |
WiMAX市場依頻段分為2.3 GHz、2.5 GHz及其他頻段。 2024 年,2.5 GHz 頻段佔據市場主導地位,佔 44% 的佔有率,創造 6 億美元的收入。此頻段實現了覆蓋範圍和容量的最佳平衡,使其成為服務提供者的首選。 2.5 GHz 頻譜能夠支援視訊串流、雲端遊戲和企業通訊解決方案等高頻寬應用,這推動了它的採用。隨著對無縫連接和更高資料吞吐量的需求不斷增加,服務供應商繼續利用該頻段來增強其在城市和農村市場的服務。
從技術角度來看,市場分為固定WiMAX和行動WiMAX。固定 WiMAX 憑藉其成本效益和卓越的資料傳輸能力,在 2024 年佔據市場主導地位,佔有 60% 的佔有率。該技術有效利用 2.3 GHz、2.5 GHz 和 3.5 GHz 頻段的頻譜來提供遠距離、高容量的連接。在郊區和農村地區,部署傳統寬頻基礎設施既昂貴又耗時,固定 WiMAX 仍然是首選解決方案。它能夠在保持成本效益的同時迅速擴展寬頻接入,使其成為縮小數位落差的重要工具。
2024 年,北美將佔據 WiMAX 市場的 32%,其中美國將佔據該地區的主導地位。美國和加拿大早期採用 WiMAX 對推動其廣泛實施發揮了重要作用。這些國家認知到 WiMAX 作為一種經濟實惠且可擴展的寬頻解決方案的潛力,因此將其納入了國家寬頻擴展策略。 WiMAX 能夠有效地在服務不足的地區提供網路接入,這進一步加強了它的採用,確保了整個北美市場的穩定成長。
目錄
第1章:方法論與範圍
- 研究設計
- 研究方法
- 資料收集方法
- 基礎估算與計算
- 基準年計算
- 市場評估的主要趨勢
- 預測模型
- 初步研究和驗證
- 主要來源
- 資料探勘來源
- 市場範圍和定義
第2章:執行摘要
第3章:行業洞察
- 產業生態系統分析
- 供應商格局
- 網路設備製造商
- 電信服務供應商
- 設備製造商
- 最終用途
- 利潤率分析
- 技術與創新格局
- 專利分析
- 重要新聞和舉措
- 監管格局
- 衝擊力
- 成長動力
- 改善農村連通性和最後一哩路通道
- 降低部署成本
- 支援固定和行動網路
- 靈活、可擴展的網路架構
- 產業陷阱與挑戰
- 來自LTE和5G技術的競爭
- 主要參與者的投資和支持減少
- 成長動力
- 成長潛力分析
- 波特的分析
- PESTEL 分析
第4章:競爭格局
- 介紹
- 公司市佔率分析
- 競爭定位矩陣
- 戰略展望矩陣
第5章:市場估計與預測:依技術分類,2021 - 2034 年
- 主要趨勢
- 固定的
- 移動的
第6章:市場估計與預測:按頻段,2021 - 2034 年
- 主要趨勢
- 2.3 GHz
- 2.5 GHz
- 其他
第7章:市場估計與預測:按應用,2021 - 2034 年
- 主要趨勢
- 個人的
- 住宅
- 企業
第8章:市場估計與預測:依最終用途,2021 - 2034 年
- 主要趨勢
- 電信
- 政府
- 衛生保健
- 航空
- 其他
第9章:市場估計與預測:按地區,2021 - 2034 年
- 主要趨勢
- 北美洲
- 美國
- 加拿大
- 歐洲
- 英國
- 德國
- 法國
- 義大利
- 西班牙
- 俄羅斯
- 北歐人
- 亞太地區
- 中國
- 印度
- 日本
- 澳洲
- 韓國
- 東南亞
- 拉丁美洲
- 巴西
- 墨西哥
- 阿根廷
- 中東及非洲
- 阿拉伯聯合大公國
- 南非
- 沙烏地阿拉伯
第10章:公司簡介
- Airspan Networks
- Alcatel Lucent
- Alvarion Ltd
- BSNL
- Cisco
- DragonWave-X
- Fujitsu
- Green Packet
- Huawei
- Intel
- Motorola
- Nextel Systems Ltd
- Nokia
- Proxim Wireless
- Samsung
- Xilinx
- ZTE Corporation
The Global WiMAX Market was valued at USD 1.5 billion in 2024 and is projected to expand at a CAGR of 10.3% between 2025 and 2034. The demand for high-speed internet continues to surge as digital transformation accelerates across industries. WiMAX technology is playing a crucial role in bridging connectivity gaps, especially in rural and underdeveloped areas where traditional broadband infrastructure remains limited. Unlike DSL or fiber optics, which require extensive groundwork and high investment, WiMAX offers an efficient alternative by delivering high-speed internet without complex infrastructure.
This makes it an attractive option for service providers looking to expand network coverage without the high costs and delays associated with fixed-line networks. The increasing shift toward remote work, online education, telemedicine, and digital banking is further driving the need for reliable broadband solutions, positioning WiMAX as a key technology in the evolving internet ecosystem. With ongoing advancements in wireless communication, improvements in spectrum efficiency, and growing investments in 5G-ready technologies, WiMAX is expected to gain further traction over the next decade.
| Market Scope | |
|---|---|
| Start Year | 2024 |
| Forecast Year | 2025-2034 |
| Start Value | $1.5 Billion |
| Forecast Value | $3.9 Billion |
| CAGR | 10.3% |
The WiMAX market is segmented by frequency band into 2.3 GHz, 2.5 GHz, and other bands. In 2024, the 2.5 GHz band dominated the market, capturing 44% share and generating USD 600 million in revenue. This band delivers an optimal balance of coverage and capacity, making it the preferred choice among service providers. The ability of the 2.5 GHz spectrum to support high-bandwidth applications such as video streaming, cloud gaming, and enterprise communication solutions has fueled its adoption. As the demand for seamless connectivity and higher data throughput increases, service providers continue to leverage this frequency band to enhance their service offerings in both urban and rural markets.
In terms of technology, the market is divided into fixed WiMAX and mobile WiMAX. Fixed WiMAX led the market in 2024 with a 60% share, driven by its cost-effectiveness and superior data transfer capabilities. This technology efficiently utilizes spectrum in the 2.3 GHz, 2.5 GHz, and 3.5 GHz bands to deliver long-range, high-capacity connectivity. Fixed WiMAX remains a preferred solution in suburban and rural regions where deploying traditional broadband infrastructure is both expensive and time-consuming. Its ability to rapidly expand broadband access while maintaining cost efficiency makes it a vital tool for closing the digital divide.
North America accounted for 32% of the WiMAX market in 2024, with the U.S. leading the regional landscape. Early adoption of WiMAX in the U.S. and Canada played a significant role in driving widespread implementation. Recognizing its potential as an affordable and scalable broadband solution, these countries integrated WiMAX into their national broadband expansion strategies. The ability of WiMAX to efficiently provide internet access in underserved regions has further strengthened its adoption, ensuring steady market growth across North America.
Table of Contents
Chapter 1 Methodology & Scope
- 1.1 Research design
- 1.1.1 Research approach
- 1.1.2 Data collection methods
- 1.2 Base estimates & calculations
- 1.2.1 Base year calculation
- 1.2.2 Key trends for market estimation
- 1.3 Forecast model
- 1.4 Primary research and validation
- 1.4.1 Primary sources
- 1.4.2 Data mining sources
- 1.5 Market scope & definition
Chapter 2 Executive Summary
- 2.1 Industry 3600 synopsis, 2021 - 2034
Chapter 3 Industry Insights
- 3.1 Industry ecosystem analysis
- 3.2 Supplier landscape
- 3.2.1 Network equipment manufacturers
- 3.2.2 Telecom service providers
- 3.2.3 Device manufacturers
- 3.2.4 End Use
- 3.3 Profit margin analysis
- 3.4 Technology & innovation landscape
- 3.5 Patent analysis
- 3.6 Key news & initiatives
- 3.7 Regulatory landscape
- 3.8 Impact forces
- 3.8.1 Growth drivers
- 3.8.1.1 Improving rural connectivity and last-mile access
- 3.8.1.2 Lower deployment costs
- 3.8.1.3 Support for both fixed and mobile networks
- 3.8.1.4 Flexible and scalable network architecture
- 3.8.2 Industry pitfalls & challenges
- 3.8.2.1 Competition from LTE and 5G technologies
- 3.8.2.2 Declining investment and support from key players
- 3.8.1 Growth drivers
- 3.9 Growth potential analysis
- 3.10 Porter's analysis
- 3.11 PESTEL analysis
Chapter 4 Competitive Landscape, 2024
- 4.1 Introduction
- 4.2 Company market share analysis
- 4.3 Competitive positioning matrix
- 4.4 Strategic outlook matrix
Chapter 5 Market Estimates & Forecast, By Technology, 2021 - 2034 ($Bn)
- 5.1 Key trends
- 5.2 Fixed
- 5.3 Mobile
Chapter 6 Market Estimates & Forecast, By Frequency Band, 2021 - 2034 ($Bn)
- 6.1 Key trends
- 6.2 2.3 GHz
- 6.3 2.5 GHz
- 6.4 Others
Chapter 7 Market Estimates & Forecast, By Application, 2021 - 2034 ($Bn)
- 7.1 Key trends
- 7.2 Personal
- 7.3 Residential
- 7.4 Enterprise
Chapter 8 Market Estimates & Forecast, By End-use, 2021 - 2034 ($Bn)
- 8.1 Key trends
- 8.2 Telecommunication
- 8.3 Government
- 8.4 Healthcare
- 8.5 Aviation
- 8.6 Others
Chapter 9 Market Estimates & Forecast, By Region, 2021 - 2034 ($Bn)
- 9.1 Key trends
- 9.2 North America
- 9.2.1 U.S.
- 9.2.2 Canada
- 9.3 Europe
- 9.3.1 UK
- 9.3.2 Germany
- 9.3.3 France
- 9.3.4 Italy
- 9.3.5 Spain
- 9.3.6 Russia
- 9.3.7 Nordics
- 9.4 Asia Pacific
- 9.4.1 China
- 9.4.2 India
- 9.4.3 Japan
- 9.4.4 Australia
- 9.4.5 South Korea
- 9.4.6 Southeast Asia
- 9.5 Latin America
- 9.5.1 Brazil
- 9.5.2 Mexico
- 9.5.3 Argentina
- 9.6 MEA
- 9.6.1 UAE
- 9.6.2 South Africa
- 9.6.3 Saudi Arabia
Chapter 10 Company Profiles
- 10.1 Airspan Networks
- 10.2 Alcatel Lucent
- 10.3 Alvarion Ltd
- 10.4 BSNL
- 10.5 Cisco
- 10.6 DragonWave-X
- 10.7 Fujitsu
- 10.8 Green Packet
- 10.9 Huawei
- 10.10 Intel
- 10.11 Motorola
- 10.12 Nextel Systems Ltd
- 10.13 Nokia
- 10.14 Proxim Wireless
- 10.15 Samsung
- 10.16 Xilinx
- 10.17 ZTE Corporation
 2025年無線通訊晶片組全球市場報告下一代無線通訊市場:2025 年
 下一代無線通訊市場:按組件、技術類型和應用分類 - 2025-2030 年全球預測公民頻段無線電市場:按產品類型、最終用戶細分、銷售管道- 全球預測 2025-2030 年無線通訊晶片組市場 - 2018-2028 年全球產業規模、佔有率、趨勢、機會和預測,按產品、類型、最終用戶應用、地區和競爭細分
 全球 WiMAX 解決方案市場規模研究與預測,依產品(行動 WiMAX、固定 WiMAX、鄉村 WiMAX)、頻段(2.3 GHz、2.5 GHz、其他)、應用(企業、個人、住宅)及區域分析,2023-2030
 營運商無線宏觀經濟趨勢(2023 年):MWC 結果