

 |
市場調查報告書
商品編碼
1698569
電動車充電站市場機會、成長動力、產業趨勢分析及 2025-2034 年預測Electric Vehicle Charging Station Market Opportunity, Growth Drivers, Industry Trend Analysis, and Forecast 2025-2034 |
||||||
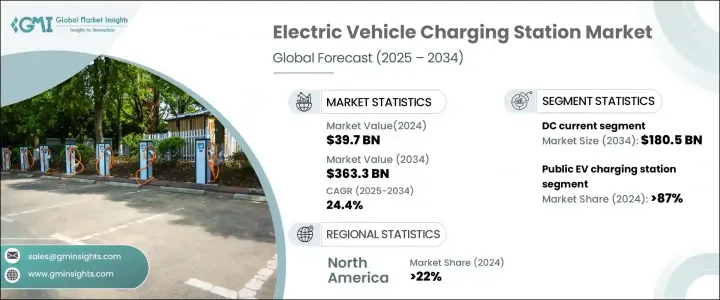
2024 年全球電動車充電站市場規模達 397 億美元,預計 2025 年至 2034 年的複合年成長率為 24.4%。電動車的快速普及、政府的支持性政策以及充電技術的進步是這項成長的主要驅動力。對快速充電基礎設施的需求不斷成長,促使汽車製造商和能源供應商合作建造大規模充電網路。
世界各國政府正在擴大激勵措施和補貼以加速部署。監管舉措正在透過強制要求廣泛建設充電基礎設施來塑造該行業。物聯網和人工智慧的融合最佳化了負載管理並增強了電網整合。然而,由於不同地區的收費標準和協議不同,互通性仍然是一項重大挑戰。該行業也正在向再生能源整合轉變,許多充電站都採用太陽能和電池儲存來提高永續性。
| 市場範圍 | |
|---|---|
| 起始年份 | 2024 |
| 預測年份 | 2025-2034 |
| 起始值 | 397億美元 |
| 預測值 | 3633億美元 |
| 複合年成長率 | 24.4% |
電動車充電站市場規模在 2022 年為 257 億美元,2023 年為 307 億美元,2024 年將達到 397 億美元。該領域包括交流充電和直流充電,其中直流充電佔據主導地位,預計到 2034 年將超過 1805 億美元。向直流快速充電的轉變正在加速,尤其是在商業和高速公路應用領域。這些充電器大大縮短了充電時間,使其成為長途旅行和商業車隊的理想選擇。然而,由於昂貴的設備、先進的電網整合和基礎設施要求,部署直流快速充電器的高成本仍然是一個障礙。單一直流快速充電站的預計投資額在 62,160 美元至 248,640 美元之間。
交流充電雖然速度較慢,但由於價格低廉且廣泛可用,對於住宅和工作場所使用仍然至關重要。大約 80% 的電動車充電都在家中進行,因此交流充電器對於日常通勤至關重要。 1級和2級交流充電器廣泛應用於家庭、辦公室和公共區域。公共交流充電站必須滿足 7.4 kW 的最低輸出功率要求。
2024 年,公共充電站佔據了超過 87% 的市場佔有率,預計到 2034 年將以每年超過 26% 的速度成長。擴建工作主要集中在城市地區、高速公路和商業中心,以支援日益成長的電動車隊。近年來,充電樁安裝數量激增,緩解了里程焦慮,方便了長途旅行。公共充電基礎設施的融資格局正在發生變化,政府和私人實體都投入了大量資金。美國政府承諾投入 50 億美元,在 2026 年擴大電動車充電基礎設施。
儘管取得了這些進步,但挑戰依然存在,包括高昂的安裝成本、土地徵用費用以及電網容量限制。快速充電站的安裝成本在 20,836 美元到 104,180 美元之間。由於成本效益,住宅和工作場所充電仍然是首選,家庭充電比公共充電站便宜 50%。持續的技術進步,包括自動計費、智慧電網整合和互通性要求,將提高電動車充電網路的效率。到 2025 年,所有公共充電站都必須遵守互通性法規,確保電動車用戶的無縫存取。
2024 年,北美佔據了超過 22% 的市場收入,預計到 2034 年將進一步增加。美國電動車充電站市場規模從 2022 年的 4 億美元成長到 2023 年的 5 億美元,再到 2024 年達到 7 億美元。聯邦和州一級的資助計劃正在推動這一成長。國家電動車基礎設施公式計劃撥款 50 億美元,用於在所有州建立互聯充電網路。美國政府承諾投入 75 億美元在全國建設 50 萬個充電樁的電動車充電基礎設施,確保為電動車用戶提供強大且可存取的網路。
目錄
第1章:方法論與範圍
- 市場範圍和定義
- 市場估計和預測參數
- 預測計算
- 資料來源
- 基本的
- 次要
- 有薪資的
- 民眾
第2章:執行摘要
第3章:行業洞察
- 產業生態系統分析
- 監管格局
- 產業衝擊力
- 成長動力
- 產業陷阱與挑戰
- 成長潛力分析
- 波特的分析
- PESTEL分析
第4章:競爭格局
- 介紹
- 戰略展望
- 創新與永續發展格局
第5章:市場規模及預測:依當前,2021 – 2034 年
- 主要趨勢
- 交流電
- 1級
- 2級
- 直流
- 直流快速
- 其他
第6章:市場規模及預測:依充電站點分類,2021 年至 2034 年
- 主要趨勢
- 民眾
- 私人的
第7章:市場規模及預測:依地區,2021 年至 2034 年
- 主要趨勢
- 北美洲
- 美國
- 加拿大
- 墨西哥
- 歐洲
- 挪威
- 德國
- 法國
- 荷蘭
- 英國
- 瑞典
- 亞太地區
- 中國
- 日本
- 印度
- 韓國
- 新加坡
- 中東和非洲
- 沙烏地阿拉伯
- 阿拉伯聯合大公國
- 南非
- 拉丁美洲
- 巴西
- 阿根廷
第8章:公司簡介
- ABB
- Blink Charging
- CHAEVI
- ChargePoint
- Delta Electronics
- Eaton
- Elli
- EVBox
- GreenWay Infrastructure
- Hyundai Motor
- Leviton Manufacturing
- NIO
- Nissan Motor
- Schneider Electric
- Siemens
- SK Signet
- Tesla
- VinFast
- Volta
- Zunder
The Global Electric Vehicle Charging Station Market reached USD 39.7 billion in 2024 and is projected to grow at a CAGR of 24.4% from 2025 to 2034. The rapid adoption of electric vehicles, supportive government policies, and advancements in charging technologies are key drivers of this growth. Increasing demand for fast-charging infrastructure is prompting automakers and energy providers to collaborate on large-scale charging networks.
Governments worldwide are expanding incentives and subsidies to accelerate deployment. Regulatory initiatives are shaping the industry by mandating widespread charging infrastructure. The integration of IoT and artificial intelligence optimizes load management and enhances grid integration. However, interoperability remains a significant challenge due to diverse charging standards and protocols across different regions. The industry is also shifting toward renewable energy integration, with many charging stations incorporating solar power and battery storage to improve sustainability.
| Market Scope | |
|---|---|
| Start Year | 2024 |
| Forecast Year | 2025-2034 |
| Start Value | $39.7 Billion |
| Forecast Value | $363.3 Billion |
| CAGR | 24.4% |
The market for electric vehicle charging stations stood at USD 25.7 billion in 2022 and USD 30.7 billion in 2023 before reaching USD 39.7 billion in 2024. The segment includes AC and DC charging, with DC charging dominating the market and expected to surpass USD 180.5 billion by 2034. The transition toward DC fast charging is accelerating, particularly in commercial and highway applications. These chargers significantly reduce charging time, making them ideal for long-distance travel and commercial fleets. However, the high cost of deploying DC fast chargers remains a barrier due to expensive equipment, advanced grid integration, and infrastructure requirements. The estimated investment for a single DC fast charging station ranges between USD 62,160 and USD 248,640.
AC charging, while slower, remains crucial for residential and workplace use due to affordability and widespread availability. Approximately 80% of electric vehicle charging occurs at home, making AC chargers essential for daily commuting. Level 1 and Level 2 AC chargers are widely used in households, offices, and public areas. Public AC charging stations must meet a minimum output power requirement of 7.4 kW.
Public charging stations accounted for over 87% of the market share in 2024 and are expected to grow at more than 26% annually until 2034. Expansion efforts are particularly focused on urban areas, highways, and commercial centers to support the increasing EV fleet. Charging point installations have surged in recent years, alleviating range anxiety and facilitating long-distance travel. The funding landscape for public charging infrastructure is evolving, with significant investments from both governments and private entities. The U.S. government has committed USD 5 billion to expand EV charging infrastructure through 2026.
Despite these advancements, challenges persist, including high installation costs, land acquisition expenses, and grid capacity limitations. Installation costs for fast-charging stations vary between USD 20,836 and USD 104,180. Residential and workplace charging remains the preferred choice due to cost-effectiveness, with home charging being up to 50% cheaper than public stations. Ongoing technological advancements, including automated billing, smart grid integration, and interoperability requirements, will enhance the efficiency of EV charging networks. By 2025, all public charging stations will be required to comply with interoperability regulations, ensuring seamless access for EV users.
North America held over 22% of the market revenue in 2024, with its share expected to increase further by 2034. The U.S. EV charging station market grew from USD 400 million in 2022 to USD 500 million in 2023 and USD 700 million in 2024. Federal and state-level funding initiatives are fueling this growth. The National Electric Vehicle Infrastructure Formula Program allocates USD 5 billion to develop an interconnected charging network across all states. The U.S. government has committed USD 7.5 billion to building a nationwide EV charging infrastructure of 500,000 chargers, ensuring a robust and accessible network for electric vehicle users.
Table of Contents
Chapter 1 Methodology & Scope
- 1.1 Market scope & definitions
- 1.2 Market estimates & forecast parameters
- 1.3 Forecast calculation
- 1.4 Data sources
- 1.4.1 Primary
- 1.4.2 Secondary
- 1.4.2.1 Paid
- 1.4.2.2 Public
Chapter 2 Executive Summary
- 2.1 Industry synopsis, 2021 - 2034
Chapter 3 Industry Insights
- 3.1 Industry ecosystem analysis
- 3.2 Regulatory landscape
- 3.3 Industry impact forces
- 3.3.1 Growth drivers
- 3.3.2 Industry pitfalls & challenges
- 3.4 Growth potential analysis
- 3.5 Porter's analysis
- 3.5.1 Bargaining power of suppliers
- 3.5.2 Bargaining power of buyers
- 3.5.3 Threat of new entrants
- 3.5.4 Threat of substitutes
- 3.6 PESTEL analysis
Chapter 4 Competitive Landscape, 2024
- 4.1 Introduction
- 4.2 Strategic outlook
- 4.3 Innovation & sustainability landscape
Chapter 5 Market Size and Forecast, By Current, 2021 – 2034 (Units, USD Billion)
- 5.1 Key trends
- 5.2 AC
- 5.2.1 Level 1
- 5.2.2 Level 2
- 5.3 DC
- 5.3.1 DC Fast
- 5.3.2 Others
Chapter 6 Market Size and Forecast, By Charging Site, 2021 – 2034 (Units, USD Billion)
- 6.1 Key trends
- 6.2 Public
- 6.3 Private
Chapter 7 Market Size and Forecast, By Region, 2021 – 2034 (Units, USD Billion)
- 7.1 Key trends
- 7.2 North America
- 7.2.1 U.S.
- 7.2.2 Canada
- 7.2.3 Mexico
- 7.3 Europe
- 7.3.1 Norway
- 7.3.2 Germany
- 7.3.3 France
- 7.3.4 Netherlands
- 7.3.5 UK
- 7.3.6 Sweden
- 7.4 Asia Pacific
- 7.4.1 China
- 7.4.2 Japan
- 7.4.3 India
- 7.4.4 South Korea
- 7.4.5 Singapore
- 7.5 Middle East & Africa
- 7.5.1 Saudi Arabia
- 7.5.2 UAE
- 7.5.3 South Africa
- 7.6 Latin America
- 7.6.1 Brazil
- 7.6.2 Argentina
Chapter 8 Company Profiles
- 8.1 ABB
- 8.2 Blink Charging
- 8.3 CHAEVI
- 8.4 ChargePoint
- 8.5 Delta Electronics
- 8.6 Eaton
- 8.7 Elli
- 8.8 EVBox
- 8.9 GreenWay Infrastructure
- 8.10 Hyundai Motor
- 8.11 Leviton Manufacturing
- 8.12 NIO
- 8.13 Nissan Motor
- 8.14 Schneider Electric
- 8.15 Siemens
- 8.16 SK Signet
- 8.17 Tesla
- 8.18 VinFast
- 8.19 Volta
- 8.20 Zunder
 直流快速電動車充電站市場規模、佔有率和成長分析(按充電基礎設施、充電類型、最終用戶和地區)- 產業預測 2025-2032
 電動車 (EV) 充電站市場:全球 2025-2029 年
 印度的電動車充電站市場評估:各類型,各充電器類型,各充電所有者類型,各連接器類型,各終端用戶,各地區,機會,預測,2018年~2032年
 2025-2033 年電動車充電站市場報告(按充電站類型、車輛類型、安裝類型、充電水平、連接器類型、應用和地區分類)
 電動車充電站能源基礎設施市場規模、佔有率和成長分析(按充電器類型、應用、連接器類型、充電等級和地區)- 2025-2032 年產業預測
 全球太陽能充電台市場分析與預測(至2033年):類型、產品、服務、技術、組件、應用、材料類型、部署、最終用戶、功能
 電動車 (EV) 充電站市場規模、佔有率、成長分析、按充電等級、按模式、按連接階段、按直流快速充電類型、按充電點類型、按安裝類型、按地區- 產業預測,2025-2032年年
 住宅電動車充電市場分析與預測(2024-2033):單戶與多戶建築的智慧電動車充電技術
 直流快速電動車充電站市場機會、成長動力、產業趨勢分析及 2025 - 2034 年預測
 電動車充電站市場:按應用、按充電器類型、按車輛類型、按級別、按地區。