


 |
市場調查報告書
商品編碼
1699338
電動車 (EV) 充電線市場機會、成長動力、產業趨勢分析及 2025-2034 年預測Electric Vehicle (EV) Charging Cable Market Opportunity, Growth Drivers, Industry Trend Analysis, and Forecast 2025-2034 |
||||||
2024 年全球電動車充電線市場價值為 15 億美元,預計 2025 年至 2034 年期間的複合年成長率為 17.8%。在消費者日益普及和政府大力支持的推動下,電動車產業的快速擴張正在推動對可靠充電基礎設施的需求。隨著世界各國推動更環保的交通解決方案,對高品質充電線的需求變得比以往任何時候都更加迫切。
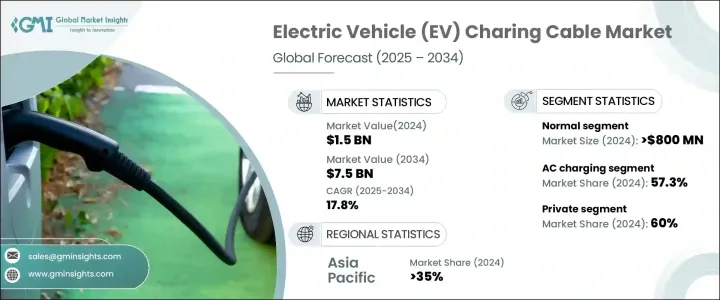
汽車製造商正在增加電動車的產量,因此對支援各種充電速度和車型的高效充電解決方案的需求也隨之增加。政府和私營部門參與者正在大力投資擴大公共和私人充電網路,進一步擴大對電動車充電電纜的需求。隨著電池技術的進步和向快速充電功能的轉變,業界對高功率和液冷電纜的偏好日益成長。電纜材料的創新、耐用性和增強的安全性能也在推動其應用,使充電電纜成為未來永續交通的關鍵組成部分。
| 市場範圍 | |
|---|---|
| 起始年份 | 2024 |
| 預測年份 | 2025-2034 |
| 起始值 | 15億美元 |
| 預測值 | 75億美元 |
| 複合年成長率 | 17.8% |
電動車充電電纜市場分為一般電纜、高功率電纜和液冷大功率電纜。 2024 年,普通電纜部分將引領市場,創造 8 億美元的收入。這種主導地位可以歸因於這些電纜的價格低廉且易於製造,使其成為汽車製造商和消費者的首選。同時,高功率電纜正成為成長最快的領域,預計2025年至2034年的複合年成長率約為19%。這些電纜對於支援超快速充電站越來越重要,使電動車能夠在更短的時間內充電並提高用戶的便利性。
2024 年,亞太地區佔電動車充電電纜市場的 35%,其中中國以 2.499 億美元的收入領先該地區。在政府優惠政策和大力投資充電基礎設施的支持下,中國大力推動電動車的發展,鞏固了其作為關鍵市場驅動力的地位。作為全球最大的電動車市場,中國不斷在充電技術方面樹立標桿,影響全球充電電纜需求的趨勢。該國廣泛的電動車普及率和快速的基礎設施發展凸顯了充電電纜在實現向電動交通的廣泛過渡中的關鍵作用。
目錄
第1章:方法論與範圍
- 研究設計
- 研究方法
- 資料收集方法
- 基礎估算與計算
- 基準年計算
- 市場評估的主要趨勢
- 預測模型
- 初步研究和驗證
- 主要來源
- 資料探勘來源
- 市場範圍和定義
第2章:執行摘要
第3章:行業洞察
- 產業生態系統分析
- 原物料供應商
- 零件供應商
- 製造商
- 技術提供者
- 最終用途
- 供應商格局
- 利潤率分析
- 技術與創新格局
- 專利分析
- 重要新聞和舉措
- 監管格局
- 價格趨勢
- 成本細分分析
- 衝擊力
- 成長動力
- 電動車的興起
- 政府支持
- 對快速充電解決方案的需求
- 產業陷阱與挑戰
- 基礎設施成本高
- 市場競爭與定價
- 成長動力
- 成長潛力分析
- 波特的分析
- PESTEL分析
第4章:競爭格局
- 介紹
- 公司市佔率分析
- 競爭定位矩陣
- 戰略展望矩陣
第5章:市場估計與預測:按電纜,2021 - 2034 年
- 主要趨勢
- 普通的
- 高功率
- 液冷大功率
第6章:市場估計與預測:按功率,2021 - 2034 年
- 主要趨勢
- 交流充電
- 直流充電
第7章:市場估計與預測:依電纜長度,2021 - 2034 年
- 主要趨勢
- 5米以下
- 6-10米
- 10公尺以上
第8章:市場估計與預測:按形狀,2021 - 2034 年
- 主要趨勢
- 直的
- 盤繞
第9章:市場估計與預測:按收費水平,2021 - 2034 年
- 主要趨勢
- 1級
- 2級
- 3級
第 10 章:市場估計與預測:按應用,2021 年至 2034 年
- 主要趨勢
- 民眾
- 私人的
第 11 章:市場估計與預測:按夾克材料,2021 年至 2034 年
- 主要趨勢
- 全橡膠
- 熱塑性彈性體 (TPE)
- 聚氯乙烯(PVC)
第 12 章:市場估計與預測:按連接器,2021 年至 2034 年
- 主要趨勢
- 類型 1
- 類型 2
- CCS1
- CCS2
- 查德莫
- 國標/T
- NACS/TESLA連接器
第 13 章:市場估計與預測:按直徑,2021 年至 2034 年
- 主要趨勢
- 10毫米
- 10-20毫米
- >20毫米
第 14 章:市場估計與預測:按模式,2021 年至 2034 年
- 主要趨勢
- 模式 1 和 2
- 模式 3
- 模式 4
第 15 章:市場估計與預測:按地區,2021 年至 2034 年
- 主要趨勢
- 北美洲
- 美國
- 加拿大
- 歐洲
- 英國
- 德國
- 法國
- 義大利
- 西班牙
- 俄羅斯
- 北歐人
- 亞太地區
- 中國
- 印度
- 日本
- 澳洲
- 韓國
- 東南亞
- 拉丁美洲
- 巴西
- 墨西哥
- 阿根廷
- MEA
- 阿拉伯聯合大公國
- 南非
- 沙烏地阿拉伯
第 16 章:公司簡介
- AG Electrical
- Aptiv
- Besen International
- Brugg eConnect
- Chengdu Khons
- Coroplast
- Dyden
- Eland Cable
- EV Cable
- General Cable Technologies
- Guangdong OMG
- HUBER+SUHNER
- Leoni AG
- Mennekes Elektrotechnik
- Phoenix Contact
- Sinbon Electronics
- Suzlon Cable
- Systems Wire Cables
- TE Connectivity
- Teison Energy Technology
The Global Electric Vehicle Charging Cable Market was valued at USD 1.5 billion in 2024 and is projected to grow at a CAGR of 17.8% between 2025 and 2034. The rapid expansion of the electric vehicle sector, driven by increasing consumer adoption and strong governmental support, is fueling the demand for reliable charging infrastructure. As nations worldwide push for greener transportation solutions, the need for high-quality charging cables is becoming more critical than ever.
Automakers are ramping up EV production, leading to a greater need for efficient charging solutions that support various charging speeds and vehicle types. Governments and private sector players are making significant investments in expanding public and private charging networks, further amplifying demand for EV charging cables. With advancements in battery technology and the shift toward fast-charging capabilities, the industry is witnessing a growing preference for high-power and liquid-cooled cables. Innovations in cable materials, improved durability, and enhanced safety features are also driving adoption, making charging cables a crucial component in the future of sustainable transportation.
| Market Scope | |
|---|---|
| Start Year | 2024 |
| Forecast Year | 2025-2034 |
| Start Value | $1.5 Billion |
| Forecast Value | $7.5 Billion |
| CAGR | 17.8% |
The electric vehicle charging cable market is categorized into normal, high-power, and liquid-cooled high-power cables. In 2024, the normal cable segment led the market, generating USD 800 million in revenue. This dominance can be attributed to the affordability and ease of manufacturing associated with these cables, making them a preferred choice for both automakers and consumers. Meanwhile, high-power cables are emerging as the fastest-growing segment, with a projected CAGR of approximately 19% from 2025 to 2034. These cables are increasingly essential in supporting ultra-fast charging stations, enabling EVs to recharge in significantly less time and improving user convenience.
Asia-Pacific held a 35% share of the EV charging cable market in 2024, with China leading the region by generating USD 249.9 million in revenue. The country's robust push for electric mobility, supported by favorable government policies and aggressive investments in charging infrastructure, has solidified its position as a key market driver. As the largest EV market in the world, China continues to set benchmarks in charging technology, influencing global trends in charging cable demand. The country's extensive EV adoption rates and rapid infrastructure development highlight the critical role of charging cables in enabling the widespread transition to electric transportation.
Table of Contents
Chapter 1 Methodology & Scope
- 1.1 Research design
- 1.1.1 Research approach
- 1.1.2 Data collection methods
- 1.2 Base estimates & calculations
- 1.2.1 Base year calculation
- 1.2.2 Key trends for market estimation
- 1.3 Forecast model
- 1.4 Primary research and validation
- 1.4.1 Primary sources
- 1.4.2 Data mining sources
- 1.5 Market scope & definition
Chapter 2 Executive Summary
- 2.1 Industry synopsis, 2021 - 2034
Chapter 3 Industry Insights
- 3.1 Industry ecosystem analysis
- 3.1.1 Raw material suppliers
- 3.1.2 Component suppliers
- 3.1.3 Manufacturers
- 3.1.4 Technology providers
- 3.1.5 End use
- 3.2 Supplier landscape
- 3.3 Profit margin analysis
- 3.4 Technology & innovation landscape
- 3.5 Patent analysis
- 3.6 Key news & initiatives
- 3.7 Regulatory landscape
- 3.8 Price trends
- 3.9 Cost breakdown analysis
- 3.10 Impact forces
- 3.10.1 Growth drivers
- 3.10.1.1 Rise of EVs
- 3.10.1.2 Government support
- 3.10.1.3 Demand for fast charging solutions
- 3.10.2 Industry pitfalls & challenges
- 3.10.2.1 High infrastructure costs
- 3.10.2.2 Market competition and pricing
- 3.10.1 Growth drivers
- 3.11 Growth potential analysis
- 3.12 Porter's analysis
- 3.13 PESTEL analysis
Chapter 4 Competitive Landscape, 2024
- 4.1 Introduction
- 4.2 Company market share analysis
- 4.3 Competitive positioning matrix
- 4.4 Strategic outlook matrix
Chapter 5 Market Estimates & Forecast, By Cable, 2021 - 2034 ($Bn, Units)
- 5.1 Key trends
- 5.2 Normal
- 5.3 High power
- 5.4 Liquid-cooled high power
Chapter 6 Market Estimates & Forecast, By Power, 2021 - 2034 ($Bn, Units)
- 6.1 Key trends
- 6.2 AC charging
- 6.3 DC charging
Chapter 7 Market Estimates & Forecast, By Cable Length, 2021 - 2034 ($Bn, Units)
- 7.1 Key trends
- 7.2 Below 5 meters
- 7.3 6-10 meters
- 7.4 Above 10 meters
Chapter 8 Market Estimates & Forecast, By Shape, 2021 - 2034 ($Bn, Units)
- 8.1 Key trends
- 8.2 Straight
- 8.3 Coiled
Chapter 9 Market Estimates & Forecast, By Charging Level, 2021 - 2034 ($Bn, Units)
- 9.1 Key trends
- 9.2 Level 1
- 9.3 Level 2
- 9.4 Level 3
Chapter 10 Market Estimates & Forecast, By Application, 2021 - 2034 ($Bn, Units)
- 10.1 Key trends
- 10.2 Public
- 10.3 Private
Chapter 11 Market Estimates & Forecast, By Jacket Material, 2021 - 2034 ($Bn, Units)
- 11.1 Key trends
- 11.2 All rubber
- 11.3 Thermoplastic Elastomer (TPE)
- 11.4 Polyvinyle Chlroide (PVC)
Chapter 12 Market Estimates & Forecast, By Connector, 2021 - 2034 ($Bn, Units)
- 12.1 Key trends
- 12.2 Type 1
- 12.3 Type 2
- 12.4 CCS1
- 12.5 CCS2
- 12.6 CHAdeMO
- 12.7 GB/T
- 12.8 NACS/TESLA Connectors
Chapter 13 Market Estimates & Forecast, By Diameter, 2021 - 2034 ($Bn, Units)
- 13.1 Key trends
- 13.2 10 mm
- 13.3 10-20 mm
- 13.4 >20mm
Chapter 14 Market Estimates & Forecast, By Mode, 2021 - 2034 ($Bn, Units)
- 14.1 Key trends
- 14.2 Mode 1 & 2
- 14.3 Mode 3
- 14.4 Mode 4
Chapter 15 Market Estimates & Forecast, By Region, 2021 - 2034 ($Bn, Units)
- 15.1 Key trends
- 15.2 North America
- 15.2.1 U.S.
- 15.2.2 Canada
- 15.3 Europe
- 15.3.1 UK
- 15.3.2 Germany
- 15.3.3 France
- 15.3.4 Italy
- 15.3.5 Spain
- 15.3.6 Russia
- 15.3.7 Nordics
- 15.4 Asia Pacific
- 15.4.1 China
- 15.4.2 India
- 15.4.3 Japan
- 15.4.4 Australia
- 15.4.5 South Korea
- 15.4.6 Southeast Asia
- 15.5 Latin America
- 15.5.1 Brazil
- 15.5.2 Mexico
- 15.5.3 Argentina
- 15.6 MEA
- 15.6.1 UAE
- 15.6.2 South Africa
- 15.6.3 Saudi Arabia
Chapter 16 Company Profiles
- 16.1 AG Electrical
- 16.2 Aptiv
- 16.3 Besen International
- 16.4 Brugg eConnect
- 16.5 Chengdu Khons
- 16.6 Coroplast
- 16.7 Dyden
- 16.8 Eland Cable
- 16.9 EV Cable
- 16.10 General Cable Technologies
- 16.11 Guangdong OMG
- 16.12 HUBER+SUHNER
- 16.13 Leoni AG
- 16.14 Mennekes Elektrotechnik
- 16.15 Phoenix Contact
- 16.16 Sinbon Electronics
- 16.17 Suzlon Cable
- 16.18 Systems Wire Cables
- 16.19 TE Connectivity
- 16.20 Teison Energy Technology
 全球電動汽車電纜市場全球電動車充電電纜市場
 電動車充電電纜市場規模、佔有率和成長分析(按電纜類型、充電電纜、連接器類型、直徑、材料、長度和地區)- 2025-2032 年產業預測
 2025-2033 年日本電動車充電電纜市場報告(按電纜長度、形狀、充電水平、功率類型、應用和地區)
 電動車充電電纜市場、規模、佔有率、趨勢、行業分析報告:按充電等級、電纜長度、應用、電源、模式、形狀、電纜類型、護套材料、連接器類型和地區 - 市場預測,2025-2034 年
 電動車充電電纜市場 - 全球產業規模、佔有率、趨勢、機會和預測,按應用、長度、充電水平、電源(替代充電、直接充電)、地區和競爭細分,2019-2029F到 2030 年電動汽車電纜市場預測:按組件、電動車類型、絕緣材料、應用和地區進行的全球分析電動車充電電纜市場:按形式、護套材料、模式、電纜長度、充電等級、電源、應用分類 - 2025-2030 年全球預測USB-C 充電線的全球市場:2033 年的機會與策略
 電動車 (EV) 充電電纜世界,2024-2028 年