

 |
市場調查報告書
商品編碼
1708243
兒科影像市場機會、成長動力、產業趨勢分析及 2025 - 2034 年預測Pediatric Imaging Market Opportunity, Growth Drivers, Industry Trend Analysis, and Forecast 2025 - 2034 |
||||||
2024 年全球兒科影像市場價值為 87 億美元,預計 2025 年至 2034 年的複合年成長率為 7.7%。兒科影像在診斷和評估從嬰兒期到青少年期的兒童病情方面發揮著至關重要的作用。醫學影像技術的進步徹底改變了兒科放射學,提高了安全性、準確性和效率,同時最大限度地降低了與輻射暴露相關的風險。低輻射成像、人工智慧診斷和 3D 成像技術等尖端創新正在顯著改善患者的治療效果,促進這一充滿活力的領域的發展。兒科疾病盛行率的不斷上升、醫療保健專業人員意識的不斷提高以及成像方式的不斷發展,進一步推動了市場擴張。此外,人工智慧在兒科影像領域的整合簡化了診斷流程,可以更快、更準確地進行解釋,從而改善臨床決策。全球對非侵入性診斷程序的日益重視和兒科專科醫院數量的不斷增加也推動了對先進影像解決方案的需求。
市場依影像方式細分,包括超音波、磁振造影 (MRI)、電腦斷層掃描 (CT)、X 光等。 2024 年,MRI 佔據了 36.5% 的市場佔有率,由於其能夠提供高解析度影像且不會讓年輕患者暴露於電離輻射,因此成為首選的成像方式。它在診斷神經、肌肉骨骼和軟組織疾病方面的有效性使其成為兒科醫療保健中不可或缺的一部分。最近的進步,例如降噪功能、更快的掃描能力以及兒童友善設計,使得 MRI 檢查對於年輕患者來說更容易接受且壓力更小,從而導致醫療機構擴大採用該技術。
| 市場範圍 | |
|---|---|
| 起始年份 | 2024 |
| 預測年份 | 2025-2034 |
| 起始值 | 87億美元 |
| 預測值 | 181億美元 |
| 複合年成長率 | 7.7% |
兒科影像也按應用分類,主要領域包括神經病學、骨科、心臟病學、腫瘤學和胃腸病學。由於兒童肌肉骨骼疾病和損傷發病率上升,骨科領域在 2024 年佔據最大佔有率,為 31.4%。對非侵入性診斷解決方案的需求正在增加,3D 影像、錐狀束 CT 和數位放射成像等創新在提高骨科診斷的準確性和效率方面發揮關鍵作用。這些技術進步正在改變兒童骨科疾病的診斷和治療方式,進一步促進市場成長。
2024 年美國兒科影像市場價值為 30 億美元,預計 2025 年至 2034 年的複合年成長率為 7.6%。兒科健康狀況(包括先天性心臟缺陷和神經系統疾病)的盛行率不斷上升,推動了對先進影像技術的需求。攜帶式超音波機器和低輻射 CT 掃描因其能夠提供高品質成像同時確保患者安全和舒適的能力而越來越受歡迎。對早期診斷的持續重視和兒科醫療基礎設施的擴大是美國兒科影像服務強勁成長的關鍵因素
目錄
第1章:方法論與範圍
第2章:執行摘要
第3章:行業洞察
- 產業生態系統分析
- 產業衝擊力
- 成長動力
- 兒科疾病盛行率不斷上升
- 成像技術的進步
- 意識和可及性不斷提高
- 政府支持舉措
- 產業陷阱與挑戰
- 輻射暴露問題
- 先進成像設備成本高昂
- 成長動力
- 成長潛力分析
- 監管格局
- 技術格局
- 未來市場趨勢
- 差距分析
- 波特的分析
- PESTEL分析
第4章:競爭格局
- 介紹
- 公司市佔率分析
- 公司矩陣分析
- 主要市場參與者的競爭分析
- 競爭定位矩陣
- 策略儀表板
第5章:市場估計與預測:依影像方式,2021 - 2034 年
- 主要趨勢
- 超音波
- 磁振造影(MRI)
- 電腦斷層掃描(CT)
- X光
- 其他成像方式
第6章:市場估計與預測:按應用,2021 - 2034 年
- 主要趨勢
- 神經病學
- 骨科
- 心臟病學
- 腫瘤學
- 胃腸病學
- 其他應用
第7章:市場估計與預測:依最終用途,2021 - 2034 年
- 主要趨勢
- 醫院
- 診斷影像中心
- 兒科診所
- 其他最終用途
第8章:市場估計與預測:按地區,2021 - 2034 年
- 主要趨勢
- 北美洲
- 美國
- 加拿大
- 歐洲
- 德國
- 英國
- 法國
- 西班牙
- 義大利
- 荷蘭
- 亞太地區
- 中國
- 印度
- 日本
- 澳洲
- 韓國
- 拉丁美洲
- 巴西
- 墨西哥
- 阿根廷
- 中東和非洲
- 沙烏地阿拉伯
- 南非
- 阿拉伯聯合大公國
第9章:公司簡介
- Agfa-Gevaert Group
- Analogic
- Canon
- Carestream Health
- Esaote
- FUJIFILM
- GE Healthcare
- Hyperfine
- Koninklijke Philips
- LMT Medical Systems
- Mindray
- Samsung Healthcare
- Shimadzu
- Siemens Healthineers
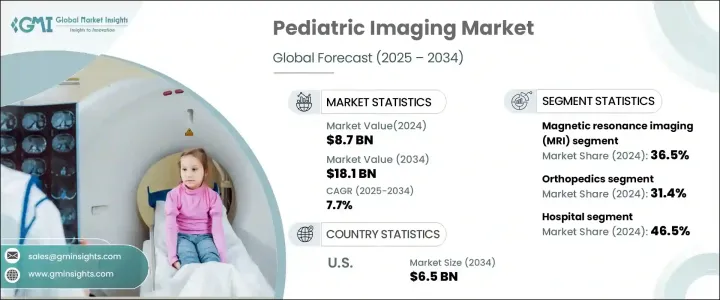
The Global Pediatric Imaging Market was valued at USD 8.7 billion in 2024 and is projected to grow at a CAGR of 7.7% from 2025 to 2034. Pediatric imaging plays a crucial role in diagnosing and assessing medical conditions in children, from infancy through adolescence. Advances in medical imaging technology have revolutionized pediatric radiology, enhancing safety, accuracy, and efficiency while minimizing risks associated with radiation exposure. Cutting-edge innovations such as low-radiation imaging, AI-driven diagnostics, and 3D imaging techniques are significantly improving patient outcomes, fostering growth in this dynamic sector. The increasing prevalence of pediatric disorders, rising awareness among healthcare professionals, and continuous developments in imaging modalities are further propelling market expansion. Additionally, the integration of artificial intelligence in pediatric imaging is streamlining diagnostic processes, allowing for faster and more precise interpretations, thereby improving clinical decision-making. The growing emphasis on non-invasive diagnostic procedures and the increasing number of pediatric specialty hospitals worldwide are also fueling the demand for advanced imaging solutions.
The market is segmented by imaging modalities, including ultrasound, magnetic resonance imaging (MRI), computed tomography (CT), X-ray, and others. MRI held a 36.5% market share in 2024, establishing itself as a preferred imaging modality due to its ability to provide high-resolution images without exposing young patients to ionizing radiation. Its effectiveness in diagnosing neurological, musculoskeletal, and soft tissue conditions makes it indispensable in pediatric healthcare. Recent advancements, such as noise reduction features, faster scanning capabilities, and child-friendly designs, have made MRI procedures more accessible and less stressful for young patients, leading to increased adoption across healthcare facilities.
| Market Scope | |
|---|---|
| Start Year | 2024 |
| Forecast Year | 2025-2034 |
| Start Value | $8.7 Billion |
| Forecast Value | $18.1 Billion |
| CAGR | 7.7% |
Pediatric imaging is also categorized by application, with key areas including neurology, orthopedics, cardiology, oncology, and gastroenterology. The orthopedics segment held the largest share at 31.4% in 2024, driven by the rising incidence of musculoskeletal disorders and injuries in children. The demand for non-invasive diagnostic solutions is escalating, and innovations such as 3D imaging, cone-beam CT, and digital radiography are playing a pivotal role in enhancing the accuracy and efficiency of orthopedic diagnostics. These technological advancements are transforming the way pediatric orthopedic conditions are diagnosed and treated, further bolstering market growth.
The U.S. Pediatric Imaging Market was valued at USD 3 billion in 2024 and is anticipated to grow at a CAGR of 7.6% from 2025 to 2034. The increasing prevalence of pediatric health conditions, including congenital heart defects and neurological disorders, is fueling demand for advanced imaging technologies. Portable ultrasound machines and low-radiation CT scans are gaining traction due to their ability to provide high-quality imaging while ensuring patient safety and comfort. The continued emphasis on early diagnosis and the expansion of pediatric healthcare infrastructure are key factors contributing to the strong growth of pediatric imaging services in the U.S.
Table of Contents
Chapter 1 Methodology and Scope
- 1.1 Market scope and definitions
- 1.2 Research design
- 1.2.1 Research approach
- 1.2.2 Data collection methods
- 1.3 Base estimates and calculations
- 1.3.1 Base year calculation
- 1.3.2 Key trends for market estimation
- 1.4 Forecast model
- 1.5 Primary research and validation
- 1.5.1 Primary sources
- 1.5.2 Data mining sources
Chapter 2 Executive Summary
- 2.1 Industry 3600 synopsis
Chapter 3 Industry Insights
- 3.1 Industry ecosystem analysis
- 3.2 Industry impact forces
- 3.2.1 Growth drivers
- 3.2.1.1 Increasing prevalence of pediatric diseases
- 3.2.1.2 Advancements in imaging technologies
- 3.2.1.3 Growing awareness and accessibility
- 3.2.1.4 Supportive government initiatives
- 3.2.2 Industry pitfalls and challenges
- 3.2.2.1 Radiation exposure concerns
- 3.2.2.2 High costs of advanced imaging equipment
- 3.2.1 Growth drivers
- 3.3 Growth potential analysis
- 3.4 Regulatory landscape
- 3.5 Technological landscape
- 3.6 Future market trends
- 3.7 Gap analysis
- 3.8 Porter's analysis
- 3.9 PESTEL analysis
Chapter 4 Competitive Landscape, 2024
- 4.1 Introduction
- 4.2 Company market share analysis
- 4.3 Company matrix analysis
- 4.4 Competitive analysis of major market players
- 4.5 Competitive positioning matrix
- 4.6 Strategy dashboard
Chapter 5 Market Estimates and Forecast, By Imaging Modality, 2021 - 2034 ($ Mn)
- 5.1 Key trends
- 5.2 Ultrasound
- 5.3 Magnetic resonance imaging (MRI)
- 5.4 Computed tomography (CT)
- 5.5 X-ray
- 5.6 Other imaging modalities
Chapter 6 Market Estimates and Forecast, By Application, 2021 - 2034 ($ Mn)
- 6.1 Key trends
- 6.2 Neurology
- 6.3 Orthopedics
- 6.4 Cardiology
- 6.5 Oncology
- 6.6 Gastroenterology
- 6.7 Other applications
Chapter 7 Market Estimates and Forecast, By End Use, 2021 - 2034 ($ Mn)
- 7.1 Key trends
- 7.2 Hospitals
- 7.3 Diagnostic imaging centers
- 7.4 Pediatric clinics
- 7.5 Other end use
Chapter 8 Market Estimates and Forecast, By Region, 2021 - 2034 ($ Mn)
- 8.1 Key trends
- 8.2 North America
- 8.2.1 U.S.
- 8.2.2 Canada
- 8.3 Europe
- 8.3.1 Germany
- 8.3.2 UK
- 8.3.3 France
- 8.3.4 Spain
- 8.3.5 Italy
- 8.3.6 Netherlands
- 8.4 Asia Pacific
- 8.4.1 China
- 8.4.2 India
- 8.4.3 Japan
- 8.4.4 Australia
- 8.4.5 South Korea
- 8.5 Latin America
- 8.5.1 Brazil
- 8.5.2 Mexico
- 8.5.3 Argentina
- 8.6 Middle East and Africa
- 8.6.1 Saudi Arabia
- 8.6.2 South Africa
- 8.6.3 UAE
Chapter 9 Company Profiles
- 9.1 Agfa-Gevaert Group
- 9.2 Analogic
- 9.3 Canon
- 9.4 Carestream Health
- 9.5 Esaote
- 9.6 FUJIFILM
- 9.7 GE Healthcare
- 9.8 Hyperfine
- 9.9 Koninklijke Philips
- 9.10 LMT Medical Systems
- 9.11 Mindray
- 9.12 Samsung Healthcare
- 9.13 Shimadzu
- 9.14 Siemens Healthineers


