


 |
市場調查報告書
商品編碼
1469871
全球通訊雲端市場策略:2024-2028Global Telecommunications Cloud Strategies Market: 2024-2028 |
||||||
| 關鍵統計數據 | |
|---|---|
| 2024 年電信雲端支出: | 266億美元 |
| 2028 年電信雲端支出: | 649億美元 |
| 2028 年蜂窩數據的雲端佔有率: | 52% |
| 預測期 | 2024-2028 |
該報告調查了全球電信雲端策略市場,並提供了有關雲端運算服務的好處、不同國家/地區雲端運算和平台的採用、對網路效能的好處、商業模式、網路營運和營運成本、行動用戶數量等資訊。
樣本視圖
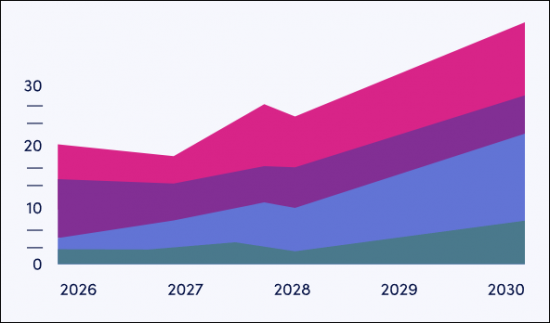
市場數據及預測報告
樣本視圖
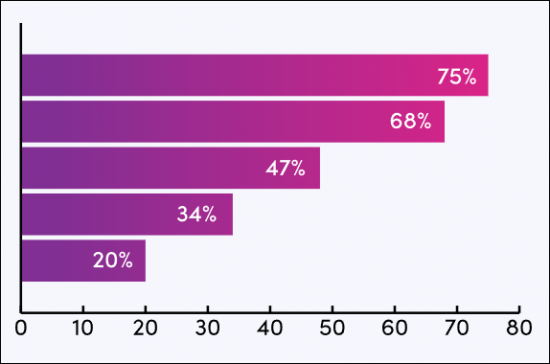
市場趨勢/策略報告
市場數據及預測報告
該研究套件包括對 16 個表格和大約 11,000 個數據點中的全套預測數據的存取。該調查套件包括以下指標:
- 公共通訊雲端支出
- 私人通訊雲端支出
- 蜂窩數據生成量
- 透過雲端的蜂窩數據量
- 使用傳統基礎設施的服務資料量
Juniper Research 互動式預測 (Excel) 具有以下功能:
- 統計分析:受益於搜尋資料期間所有地區和國家顯示的特定指標的能力。可以輕鬆修改圖表並將其匯出到剪貼簿。
- 國家資料工具:此工具可讓您查看預測期內的所有區域和國家指標。您可以縮小搜尋列中顯示的指標範圍。
- 國家比較工具:您可以選擇特定國家進行比較。該工具包括匯出圖表的功能。
- 假設分析:透過五個交互場景,使用者可以比較預測假設。
目錄
市場趨勢和策略
第一章 主要趨勢與策略建議
- 主要趨勢
- 策略建議
第二章 未來市場展望
- 通訊云:簡介
- 雲端通訊主要平台及服務
- IaaS
- PaaS
- SaaS
- 雲端服務計費模型
- 微服務、容器、Kubernetes、Docker
- Kubernetes
- 推動通訊雲端引入的趨勢
- 部署雲端通訊對於實現永續發展和能源效率目標至關重要
第 3 章 貨幣化機會
- 關鍵的雲端機會
- 雲端原生網路功能
- 無線接取網路
- 多接入邊緣運算
- 雲端通訊關鍵技術及項目
- 裸機雲
- 混合雲端和多雲部署
- 無伺服器架構
- Linux 基金會的 Nephio
第四章 儲備指數:依國家分類
- 電信雲端戰略準備指數:依國家分類
- 細分市場分析
- 優先市場
- i.中國
- ii. 美國
- 市場飽和
- 不斷成長的市場
- i.印度
- ii.沙烏地阿拉伯
- 優先市場
- 新興市場
- i.土耳其
- ii.智利
競爭排行榜
第一章 競技排行榜
第二章 供應商簡介
- AWS (Amazon Web Services)
- Cisco
- Dell
- Ericsson
- Google Cloud Platform
- Huawei
- IBM
- Microsoft
- Oracle
- VMware
- Vultr
- Juniper Research瞻博網路研究排行榜:評估方法
- 限制/解釋
數據和預測
第一章引言/研究方法
第二章 市場概況/未來市場展望
- 活躍行動用戶總數
- 營運商計費收入
- 電信業者的雲端總支出
- 電信業者公共通訊雲端支出總額
- 電信業者私有通訊雲端支出總額
- 雲端提供的網路數據
| KEY STATISTICS | |
|---|---|
| Telecommunications cloud expenditure in 2024: | $26.6bn |
| Telecommunications cloud expenditure in 2028: | $64.9bn |
| Proportion of cellular data serviced by the cloud in 2028: | 52% |
| Forecast period: | 2024-2028 |
Overview
Our 'Telecommunications Cloud' research suite provides actionable insights and analysis into this rapidly growing and competitive market; enabling stakeholders, such as operators, cloud providers, network equipment providers, and hyperscalers to navigate and capitalise on the development of cloud infrastructure in telecommunications networks.
This is achieved through a detailed assessment of the advantages of cloud computing services, the adoption of cloud computing and platforms across various countries, and the benefits to network performance, business models, network operations, and operational expenses. Moreover, the report provides detailed strategic recommendations and analysis of how operators can leverage advanced cloud technology to improve their enterprise and consumer customer experiences, as well as operational efficiency. This includes key recommendations on how operators can develop a flexible infrastructure and cloud-based solutions which offer advanced edge network capabilities and reduced time-to-market for new telecom services, whilst enhancing experiences for consumers.
The suite includes several different options that can be purchased separately, including access to data mapping, the cloudification of wireless cellular networks and future growth of telecommunications cloud, an insightful study uncovering the latest cloud computing trends and opportunities within the market, and a document containing extensive analysis of the 11 market leaders in cloud service provision.
The coverage can also be purchased as a Full Research Suite, which contains all these elements and offers a substantial discount.
Collectively, they provide a critical tool for understanding this rapidly emerging market, operators, cloud service providers, and hyperscalers; shaping their future strategy for monetisation and digital transformation in the telecom industry. Its unparalleled coverage makes this research suite an incredibly useful resource for charting the future of a crucial and rapidly growing market.
Key Features
- Market Dynamics: Insights into key trends and market expansion challenges within the telecommunications cloud market; addressing challenges posed by the highly complex nature of telecommunications cloud. It details and analyses the ongoing development of new standards for cloud-native architecture, open-source projects by communications service providers, such as Linux Nephio, and the development of hybrid cloud solutions. Also included is analysis and recommendations on how operators can gain a competitive edge in customer satisfaction through improved quality of service through leveraging advanced cloud computing technologies, such as public cloud services. These technologies will be vital to enabling operators to capitalise on the latest telecommunications business opportunities, through new business models, and customer segments, as well as reducing operational costs.
- Key Takeaways & Strategic Recommendations: In-depth analysis of key development opportunities and findings within the telecommunications cloud market, accompanied by strategic recommendations for operators and cloud service providers.
- Benchmark Industry Forecasts: The business overview into operators, telecommunications cloud service providers, and hyperscalers provides forecasts for the total number of active mobile subscribers, and operator revenue from mobile subscribers. Also included are forecasts for total telecommunications cloud expenditure split by public and private cloud technologies, and cellular data serviced by the cloud.
- Juniper Research Competitor Leaderboard: Key player capability and capacity assessment for 11 telecommunications cloud service providers via the Juniper Research Competitor Leaderboard. This features market sizing for major players in the telecommunications cloud industry and detailed analysis of their respective telco clouds.
SAMPLE VIEW
Market Data & Forecasting Report
The numbers tell you what's happening, but our written report details why, alongside the methodologies.
SAMPLE VIEW
Market Trends & Strategies Report
A comprehensive analysis of the current market landscape, alongside strategic recommendations.
Market Data & Forecasting Report
The research suite for the 'Telecommunications Cloud' market includes access to the full set of forecast data of 16 tables and almost 11,000 datapoints. Metrics in the research suite include:
- Total Expenditure Public Telecommunications Cloud
- Total Expenditure on Private Telecommunications Cloud
- Total Cellular Data Generated
- Total Cellular Data Serviced by the Cloud
- Total Data Serviced by Traditional Infrastructure
Juniper Research Interactive Forecast Excel contains the following functionality:
- Statistics Analysis: Users benefit from the ability to search for specific metrics, displayed for all regions and countries across the data period. Graphs are easily modified and can be exported to the clipboard.
- Country Data Tool: This tool lets users look at metrics for all regions and countries in the forecast period. Users can refine the metrics displayed via a search bar.
- Country Comparison Tool: Users can select and compare specific countries. The ability to export graphs is included in this tool.
- What-if Analysis: Here, users can compare forecast metrics against their own assumptions, via 5 interactive scenarios.
Market Trends & Strategies Report
This report thoroughly examines the 'Telecommunications Cloud' market landscape; assessing market trends and factors shaping the evolution of the rapidly developing and growing telco cloud market. The report delivers a comprehensive analysis of the strategic opportunities for operators, telecommunications cloud service providers, and hyperscalers.
The report addresses how stakeholders should navigate operational cost and service quality opportunities such as C-RAN (Centralised Radio Access Network), as well as open-source projects such as Kubernetes, Metal3 and Linux Nephio. Analysis and strategic recommendations on the latest cloud technologies, such as the development of the public cloud as telecommunications infrastructure, and MEC (Multi-access Edge Computing) are included.
It also includes evaluation of specific operators' cloudification strategies and the wider telecommunications cloud market in key countries. This includes analysis of the degree of cloud adoption, development of edge cloud capabilities, and country-level cloud computing trends.
Competitor Leaderboard Report
The Competitor Leaderboard report provides a detailed evaluation and market positioning for 11 leading cloud service providers. The vendors are positioned as established leaders, leading challengers, or disruptors and challengers based on capacity and capability assessment. This includes analysis of the key advantages in the market, cloud-native technology, business agility, computing resources, partner ecosystem, and cloud-based applications.
|
|
This document is centred around the Juniper Research Competitor Leaderboard, a vendor positioning tool that provides an at-a-glance view of the competitive landscape in a market, backed by a robust methodology.
Table of Contents
Market Trends &Strategies
1. Key Trends & Strategic Recommendations
- 1.1. Key Trends
- 1.2. Strategic Recommendations
2. Future Market Outlook
- 2.1. Introduction to Telecommunications Cloud
- Figure 2.1: Total Telecommunications Cloud Expenditure in 2024 (%), Split by Region
- 2.2. Key Platforms and Services in Cloud Telecommunications
- Figure 2.2: IaaS, PaaS, and SaaS Management Responsibilities
- 2.2.1. IaaS
- 2.2.2. PaaS
- 2.2.3. SaaS
- 2.2.4. Cloud Service Charging Models
- 2.3. Microservices, Containers, Kubernetes, and Docker
- 2.3.1. Kubernetes
- Figure 2.3: Kubernetes Components
- 2.3.2. Trends Driving Telecommunications Cloud Adoption
- i. Total Cost of Ownership Increased by Consumer and Enterprise Data Consumption
- Figure 2.4: Total Cellular Data Generated (PB), Split by 8 Key Regions, 2023-2028
- ii. New 5G Deployments Expand Cloud Opportunities in Telecommunications
- Figure 2.5: Total Number of 5G Connections (m), Split By 8 Key Regions, 2023-2028
- Figure 2.6: 5G Service-based Architecture
- i. Total Cost of Ownership Increased by Consumer and Enterprise Data Consumption
- 2.3.3. Cloud Telecommunications Deployments Critical to Reaching Sustainability and Energy Efficiency Goals
- 2.3.1. Kubernetes
3. Monetisable Opportunities
- 3.1. Key Opportunities for Cloudification
- 3.1.1. Cloud-native Network Functions
- i. ETSI Network Function Standards
- ii. Session Border Controller
- iii. Cloud-native Routers
- iv. Packet Gateways
- v. Call Session Control
- 3.1.2. C-RAN (Cloud Radio Access Network)
- Figure 3.1: Total Number of 5G NR Base Stations (Including Base Stations and Small Cells), Split by 8 Key Regions, 2023-2028
- Table 3.2: Advantages of C-RAN Deployments
- Figure 3.3: C-RAN Structure
- i. Challenges to C-RAN
- ii. Why C-RAN Is Critical to the Development of Open RAN (Radio Access Network)
- 3.1.3. Multi-access Edge Computing
- Figure 3.4: Multi-access Edge Computing Reference Architecture
- i. Smartphone Manufacturers
- ii. OTT Video Streaming Providers
- 3.1.1. Cloud-native Network Functions
- 3.2. Key Technologies and Projects in Cloud Telecommunications
- 3.2.1. Bare Metal Cloud
- Table 3.5: Bare Metal Cloud Limitations and Negatives
- i. Metal3
- 3.2.2. Hybrid Cloud and Multi-cloud Deployments
- Figure 3.6: Total Telecommunications Private and Public Cloud Expenditure by Operators ($m), 2023-2028
- i. Hybrid Cloud
- ii. Multi-cloud
- 3.2.3. Serverless Architectures
- Table 3.7: Negatives of a Serverless Architecture
- 3.2.1. Bare Metal Cloud
- 3.3. Nephio by the Linux Foundation
- Figure 3.8: Nephio's Functional Building Blocks
4. Country Readiness Index
- 4.1. Telecommunications Cloud Strategies Country Readiness Index
- Figure 4.1: Juniper Research's 8 Key Regions Definitions
- Table 4.2: Telecommunications Cloud Strategies: Country Readiness Index Scoring Criteria
- Figure 4.3: Juniper Research Telecommunications Cloud Country Readiness Index: Graph
- Table 4.4: Telecommunications Cloud Strategies Country Readiness Index: Market Segments
- 4.2. Market Segment Analysis
- 4.2.1. Focus Markets
- i. China
- Figure 4.5: Total Operator Expenditure on Cloud Deployments ($m) in China, 2023-2028
- Figure 4.6: Total Number of 5G Connections in China (m), 2023-2028
- ii. The US
- Figure 4.7: Total Operator Expenditure on Telecommunications Cloud in the US ($m), 2023-2028
- i. China
- 4.2.2. Saturated Markets
- 4.2.3. Growth Markets
- i. India
- Figure 4.8: Total Operator Revenue in India ($m), 2023-2028
- Figure 4.9: Total Operator Expenditure on Telecommunications Cloud in India ($m), 2023-2028
- ii. Saudi Arabia
- Figure 4.10: Average Operator Revenue per Mobile Subscriber per Month in Saudi Arabia ($), 2023-2028
- i. India
- 4.2.1. Focus Markets
- 4.3. Developing Markets
- Figure 4.11: Total Operator Expenditure on Telecommunications Cloud in Developing Markets, 2023-2028
- i. Turkey
- Figure 4.12: Total Number of Active Mobile Subscribers in Turkey (m), 2023-2028
- Figure 4.13: Total Network Traffic Serviced by Telecommunications Cloud in Turkey (PB), 2023-2028
- ii. Chile
- Figure 4.14: Average Operator Revenue per Mobile Subscriber per Month in Chile ($), 2023-2028
- Table 4.15: National Tier 1 Operator Subscribers in Chile in 2023
- Figure 4.16: Total Operator Expenditure on Telecommunication Cloud in Chile ($m), 2023-2028
- Table 4.17: Telecommunications Cloud Strategies Heatmap, North America
- Table 4.18: Telecommunications Cloud Strategies Heatmap, Latin America
- Table 4.19: Telecommunications Cloud Strategies Heatmap, West Europe
- Table 4.20: Telecommunications Cloud Strategies Heatmap, Central & East Europe
- Table 4.21: Telecommunications Cloud Strategies Heatmap, Far East & China
- Table 4.22: Telecommunications Cloud Strategies Heatmap, Indian Subcontinent
- Table 4.23: Telecommunications Cloud Strategies Heatmap, Rest of Asia Pacific
- Table 4.24: Telecommunications Cloud Strategies Heatmap, Africa & Middle East
Competitor Leaderboard
1. Competitor Leaderboard
- 1.1. Why Read This Report
- Table 1.1: Juniper Research Competitor Leaderboard: Vendors and Product Portfolios
- Figure 1.2: Juniper Research Competitor Leaderboard: Telecommunications Cloud Vendors
- Table 1.3: Juniper Research Competitor Leaderboard: Telecommunications Cloud Vendors & Positioning
- Table 1.4: Juniper Research Competitor Leaderboard Heatmap: Telecommunications Cloud Vendors
2. Vendor Profiles
- 2.1. Vendor Profile
- 2.1.1. AWS (Amazon Web Services)
- i. Corporate Information
- Table 2.1: AWS' Revenue in 2021 and 2022 ($bn)
- ii. Geographical Spread
- Figure 2.2: Amazon Web Service Infrastructure Deployments Map, 2023
- iii. Key Clients & Strategic Partnerships
- iv. High-level View of Offerings
- Figure 2.3: AWS Telco Network Builder
- v. Juniper Research's View: Key Strengths & Strategic Development Opportunities
- i. Corporate Information
- 2.1.2. Cisco
- i. Corporate Information
- ii. Geographical Spread
- iii. Key Clients & Strategic Partnerships.
- iv. High-Level View of Offerings
- Figure 2.4: Cisco Edge Cloud for Content
- v. Juniper Research's View: Key Strengths & Strategic Development Opportunities
- 2.1.3. Dell
- i. Corporate Information
- ii. Geographical Spread
- iii. Key Clients & Strategic Partnerships
- iv. High-level View of Offerings
- Figure 2.5: Dell Telecom Automation Suite
- Figure 2.6: Dell Telecom Multicloud Foundation
- Figure 2.7: Dell Telecom Infrastructure Block Operations Day 0 to Day 2 and Beyond
- v. Juniper Research's View: Key Strengths & Strategic Development Opportunities
- 2.1.4. Ericsson
- i. Corporate Information
- Table 2.8: Ericsson's Financial Information ($m), 2020-2023
- ii. Geographical Spread
- iii. Key Clients & Strategic Partnerships
- iv. High-level View of Offerings
- Figure 2.9: Ericsson Cloud Portfolio
- v. Juniper Research's View: Key Strengths & Strategic Development Opportunities.
- i. Corporate Information
- 2.1.5. Google Cloud Platform
- i. Corporate Information
- ii. Geographical Spread
- Figure 2.10: Google Cloud Platform Regions
- iii. Key Clients & Strategic Partnerships
- iv. High-level View of Offerings
- Figure 2.11: Telecom Network Automation
- v. Juniper Research's View: Key Strengths & Strategic Development Opportunities
- 2.1.6. Huawei
- i. Corporate
- Table 2.12: Huawei's Select Financial Information ($m), 2019-2022
- ii. Geographical Spread
- iii. Key Clients & Strategic Partnerships
- iv. High-level View of Offerings
- v. Juniper Research's View: Key Strengths & Strategic Development Opportunities
- i. Corporate
- 2.1.7. IBM
- i. Corporate Information
- ii. Geographical Spread
- Figure 2.14: IBM Data Centre and MZRs (Machine Readable Zone) Location Map
- iii. Key Clients & Strategic Partnerships
- iv. High-level View of Offerings
- Figure 2.15: IBM Cloud Pak for Network Automation
- v. Juniper Research's View: Key Strengths & Strategic Development Opportunities
- 2.1.8. Microsoft
- i. Corporate Information
- ii. Geographical Spread
- iii. Key Clients & Strategic Partnerships
- iv. High-level View of Offerings
- Figure 2.16: Azure Operator Nexus
- v. Juniper Research's View: Key Strengths & Strategic Development Opportunities
- 2.1.9. Oracle
- i. Corporate Information
- ii. Geographical Spread
- Figure 2.17: Oracle Cloud Regions
- iii. Key Clients & Strategic Partnerships
- iv. High-level View of Offerings
- v. Juniper Research's View: Key Strengths & Strategic Development Opportunities
- 2.1.10. VMware
- i. Corporate Information
- ii. Geographical Spread
- iii. Key Clients & Strategic Partnerships
- iv. High-level View of Offerings
- Figure 2.18: VMware Telco Cloud Infrastructure Components
- v. Juniper Research's View: Key Strengths & Strategic Development Opportunities
- 2.1.11. Vultr
- i. Corporate Information
- ii. Geographical Spread
- iii. Key Clients & Strategic Partnerships
- iv. High-level View of Offerings
- v. Juniper Research's View: Key Strengths & Strategic Development Opportunities
- 2.1.1. AWS (Amazon Web Services)
- 2.2. Juniper Research Leaderboard Assessment Methodology
- 2.3. Limitations & Interpretations
- Table 2.19: Juniper Research Competitor Leaderboard: Telecommunications Cloud Strategies
Data & Forecasting
1. Introduction and Methodology
- 1.1. Introduction & Forecast Methodology
- Figure 1.1: Total Global Expenditure on Cloud Telecommunications ($m), 2023-2028
- 1.2. Telecommunications Cloud Forecasting Methodology
- Figure 1.2: Telecommunications Cloud Strategies Methodology
2. Market Summary and Future Market Outlook
- 2.1. Total Number of Active Mobile Subscribers
- Figure & Table 2.1: Total Number of Active Mobile Subscribers (m), Split by 8 Key Regions, 2023-2028
- Table 2.2: Mobile Subscriber Penetration Rate (%), Split By 8 Key Regions, 2023-2028
- 2.2. Total Operator-billed Revenue
- Figure & Table 2.3: Total Operator-billed Revenue ($m), Split by 8 key Regions, 2023-2028
- Table 2.4: Average Operator Revenue per Mobile Subscriber per Month ($), Split by 8 Key Regions, 2023-2028
- 2.3. Total Operator Telecommunications Cloud Expenditure
- Figure & Table 2.5: Total Operator Telecommunications Cloud Expenditure ($m), Split by 8 Key Regions, 2023-2028
- 2.4. Total Operator Public Telecommunications Cloud Expenditure
- Figure & Table 2.6:Total Operator Expenditure on Public Telecommunications Cloud ($m), Split by 8 key Regions, 2023-2028
- Table 2.7:Proportion of Operator Expenditure on Telecommunications Cloud That Is Public Cloud (%), Split by 8 Key Regions, 2023-2028
- 2.5. Total Operator Private Telecommunications Cloud Expenditure
- Figure & Table 2.8: Total Operator Private Telecommunications Cloud Expenditure ($m), Split by 8 Key Regions, 2023-2028
- Table 2.9: Proportion of Operator Expenditure on Telecommunications Cloud That Is Private Cloud, Split by 8 Key Regions, 2023-2028
- 2.6. Total Network Data Serviced by The Cloud
- Figure & Table 2.10: Total Network Data Serviced by the Cloud ($m), Split by 8 Key Regions, 2023-2028


