


 |
市場調查報告書
商品編碼
1494936
VLEO衛星的全球市場:2024-2030年Global VLEO Satellites Market: 2024-2030 |
||||||
| 主要統計 | |
|---|---|
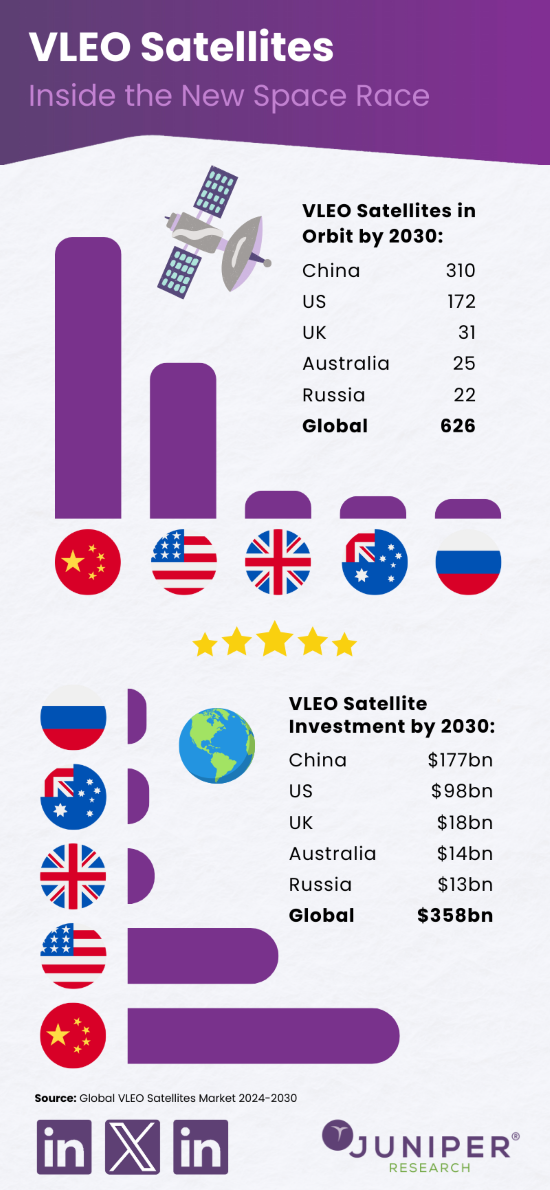
| 2030年的軌道上的VLEO衛星數: | 626 |
| 2024年的VLEO衛星發射的投資額: | 172億美元 |
| 市場成長率 (2024~2030年): | 66% |
| 預測期間: | 2024-2030年 |
本研究包調查了全球 VLEO 衛星市場,並提供了有關主要趨勢、當前用例、未來成長機會、主要挑戰和對策/建議、按應用和地區劃分的衛星總數趨勢和預測以及主要供應商的資訊。競爭力的排行榜等。
市場資料、預測
- 軌道上的LEO衛星的總數
- 軌道上的VLEO衛星的總數:
- 公共
- 商業
- 政府機關
- 軍隊
- 每VLEO衛星發射1次的平均成本
- VLEO衛星發射的投資總額
樣本圖
市場趨勢、預測 (PDF報告)

目前的市場情勢綜合分析,策略性的刊載建議和預測的walk-through
目錄
第1章 重要點、策略性推薦事項
- VLEO衛星:重要點
- VLEO衛星:策略性推薦事項
第2章 今後的市場預測
- 簡介
- VLEO衛星的開發
- VLEO衛星和LEO衛星及MEO衛星
- 今後的市場預測
- VLEO衛星的優點
- 降低軌道上碎片碰撞的風險
- 降低成本
- 低延遲
- 地球影像
- 主動系統
- 被動系統
- VLEO衛星引進的受益者和優點
- 農業
- 環境監測
- 城市計劃、開發
- 災害支援、管理
- 防衛、安全保障
- 資源管理
- 科學研究
- 收益化的機會
- 海上監視/連接
- VLEO衛星的實行
- 收益化的機會
- 機內監視、連接
- VLEO衛星的實行
- 收益化的機會
- 國際保全
- VLEO衛星的實行
- 收益化的機會
- 環境監測
- VLEO衛星的實行
- 收益化的機會
- 月額利用費
- GPS導航
- VLEO衛星的實行
- 收益化的機會
- 天體物理學的應用
- VLEO衛星的實行
- 收益化的機會
- VLEO衛星通訊及連接市場給予的影響
- IoT連接
- 5G對VLEO連接的影響
- 設備直接/電池單元直接
- VLEO衛星相關的課題
- 大氣反抗
- i.環境壓力
- 宇宙環境的永續性
- i.宇宙太陽能
- 衛星存取的倫理
- 大氣反抗
- 法規和市場動態對VLEO衛星服務引進的影響
第3章 各國準備指數
- 各國準備指數:概要
- 重點市場
- CASIC
- CNSA (China National Space Administration)
- DARPA (Defense Advanced Research Projects Agency)
- The UK Space Agency
- LEO2VLEO
- DISCOVERER Project
- 香港
- 成長市場
- 新興國家市場
第4章 Future Leader Index
- 讀本報告的理由
- Albedo
- Blue Canyon Technologies
- Cspace Intelligent Technology
- EOI Space
- LeoLabs
- Space Forge
- Thales Alenia
- Tyvak International
- Juniper Research排行榜評估手法
- 限制與解釋
第5章 市場預測、重要點
- VLEO衛星預測:簡介
- 被發射的VLEO衛星的總數
- 對VLEO衛星發射的整體投資額
- 主要商業用途為目的VLEO衛星的總數
- 主要民間用途所使用的VLEO衛星的總數
- 主要政府用途所使用的VLEO衛星的總數
- 主要軍事用途所使用的VLEO衛星的總數
| KEY STATISTICS | |
|---|---|
| VLEO satellites in orbit by 2030: | 626 |
| Investment into VLEO satellite launches in 2024: | $17.2bn |
| 2024 to 2030 market growth: | 66% |
| Forecast period: | 2024-2030 |
Overview
Our "VLEO (Very Low Earth Orbit) Satellites" research suite provides a detailed and insightful perspective into this upcoming lucrative space industry market; enabling stakeholders from operators, satellite network operators and technology vendors to understand its future growth opportunities in technological space capabilities (both on a country and global level), key trends, and the competitive environment in the commercial space. This space technology research assesses the current use cases providing the most immediate revenue opportunities (such as continuous coverage for telecommunications), as well as the use cases proving long-term investment opportunities, with adjacent markets such as LEO orbits also being considered. Additionally, it provides insight into the major challenges (including space environment, launch costs, atmospheric drag, sustainability and ethics) in the VLEO satellite market with bespoke recommendations on how to mitigate these challenges in the space economy.
From single satellite launches to full satellite constellations, this space economy research suite provides a thorough assessment of the VLEO satellite market and includes both a data deliverable; sizing the market, and providing key forecast data across 60 countries, as well as a Strategy & Trends document which gives a complete assessment of key trends, challenges, and recommendations for stakeholders. Collectively, the primary advantages of this data are in providing a critical tool for understanding this rapidly emerging market; supporting operators, OEMs, technology partners and satellite network operators to shape their future market strategy in space technology.
Key Features
- Market Dynamics: Insights into key trends and market expansion within the VLEO satellites market; addressing challenges posed by the highly technical nature of VLEO satellites, atmospheric conditions, and the potential use cases of increasing VLEO satellite deployment. Additionally, our VLEO satellite market research includes a regional market growth analysis on the current technological development and segment growth of VLEO satellites in 60 countries, as well as providing a future outlook.
- Key Takeaways & Strategic Recommendations: In-depth analysis of key development opportunities and findings within the VLEO satellites market; accompanied by strategic recommendations for stakeholders.
- Benchmark Industry Forecasts: Comprehensive forecast data including total number of VLEO satellite launches, split by four key use cases including commercial, civil, government, and military, as well as total and cumulative investments into VLEO satellite launches.
- Juniper Research Future Leader Index: Key player capability and capacity assessment for nine leading VLEO satellite vendors in the market space, via the Juniper Research Future Leaders Index, featuring corporate capabilities, innovation and future prospects.
- Albedo
- Blue Canyon Technologies
- Cspace Intelligent Technology
- Earth Observant (EOI Space)
- LeoLabs
- Redwire
- Space Forge
- Thales Alenia Space
- Tyvak International
Additionally, it includes a forecast summary of the total investment into VLEO satellite launches in 2030.
Market Data & Forecasts
The market-leading research suite for the VLEO satellites market includes access to the full set of forecast data of 20 tables and over 8,600 datapoints. Key metrics in the research suite include:
- Total Number of LEO (Low Earth Orbit) Satellites in Orbit
- Total Number of VLEO Satellites in Orbit, also split by:
- Civil
- Commercial
- Government Agencies
- Military
- Average Cost per VLEO Satellite Launch
- Total Investment into VLEO Satellite Launches
Juniper Research's Interactive Forecast Excel contains the following functionality:
- Statistics Analysis: Users benefit from the ability to search for specific metrics, displayed for all regions and countries across the data period. Graphs are easily modified and can be exported to the clipboard.
- Country Data Tool: This tool lets users look at metrics for all regions and countries in the forecast period. Users can refine the metrics displayed via a search bar.
- Country Comparison Tool: Users can select and compare specific countries. The ability to export graphs is included in this tool.
- What-if Analysis: Here, users can compare forecast metrics against their own assumptions, via 5 interactive scenarios.
A comprehensive analysis of the current market landscape, alongside strategic recommendations and a walk-through of the forecasts.
Table of Contents
1. Key Takeaways & Strategic Recommendations
- 1.1. VLEO Satellites: Key Takeaways
- 1.2. VLEO Satellites: Strategic Recommendations
2. Future Market Outlook
- 2.1. Introduction
- Figure 2.1: Satellite Orbits (Image not to Scale)
- 2.1.1. Development of VLEO Satellites
- 2.1.2. VLEO vs LEO and MEO Satellites
- i. LEO Satellites
- ii. MEO Satellites
- iii. VLEO Satellites
- 2.1.3. Future Market Prospects
- Figure 2.2: Total VLEO Satellite Launches, Split by 8 Key Regions, 2024-2030
- 2.2. Benefits of VLEO Satellites
- 2.2.1. Reduction in Orbital Debris Collision Risk
- 2.2.2. Lower Costs
- Figure 2.3: Van Allen Belt
- 2.2.3. Lower Latency
- Figure 2.4: M2M Use Cases and their Latency
- 2.3. Earth Imaging
- i. Active Systems
- ii. Passive Systems
- 2.3.2. Beneficiaries and Benefits of VLEO Satellite Implementation
- i. Agriculture
- ii. Environmental Monitoring
- iii. Urban Planning and Development
- iv. Disaster Response and Management
- v. Defence and Security
- vi. Resource Management
- vii. Scientific Research
- 2.3.3. Monetisation Opportunities
- 2.4. Maritime Surveillance/Connectivity
- 2.4.1. VLEO Satellite Implementation
- 2.4.2. Monetisation Opportunities
- 2.5. Inflight Surveillance & Connectivity
- 2.5.1. VLEO Satellite Implementation
- 2.5.2. Monetisation Opportunities
- 2.6. National Security
- 2.6.1. VLEO Satellite Implementation
- 2.6.2. Monetisation Opportunities
- 2.7. Environmental Monitoring
- 2.7.1. VLEO Satellite Implementation
- 2.7.2. Monetisation Opportunities
- i. Monthly Subscription Fee
- 2.8. GPS Navigation
- 2.8.1. VLEO Satellite Implementation
- 2.8.2. Monetisation Opportunities
- 2.9. Astrophysics Applications
- 2.9.1. VLEO Satellite Implementation
- 2.9.2. Monetisation Opportunities
- 2.10. Impact of VLEO Satellites on the Telecommunications and Connectivity Markets
- 2.10.1. IoT Connectivity
- Figure 2.5: Total Number of Cellular IoT Connections (m), Split by 8 Key Regions, 2024-2028
- 2.10.2. Impact of 5G on VLEO Connectivity
- Figure 2.6: Global Mobile 5G Active Connections (m), Split by 8 Key Regions, 2024-2029
- Figure 2.7: Spectrum Bands for Satellite Communications
- 2.10.3. Direct-to-Device/Direct-to-Cell
- 2.10.1. IoT Connectivity
- 2.11. Challenges Associated with VLEO Satellites
- 2.11.1. Atmospheric Drag
- i. Environmental Stress
- 2.11.2. Sustainability of the Space Environment
- i. Space-based Solar Energy
- 2.11.3. Ethics of Satellite Access
- 2.11.1. Atmospheric Drag
- 2.12. The Impact of Regulatory and Market Dynamics on the Adoption of VLEO Satellite Services
3. Country Readiness Index
- 3.1. Introduction to the Country Readiness Index
- Figure 3.1: VLEO Satellites Country Readiness Index Regional Definitions
- Table 3.2: Juniper Research Country Readiness Index Scoring Criteria: VLEO Satellites
- Figure 3.3: Juniper Research Country Readiness Index: VLEO Satellites
- Table 3.4: VLEO Satellites Country Readiness Index: Market Segmentation
- 3.2. Focus Markets
- Figure 3.5: Map Displaying VLEO Satellite Launches in 2030
- i. CASIC
- ii. CNSA (China National Space Administration)
- iii. DARPA (Defense Advanced Research Projects Agency)
- iv. The UK Space Agency
- v. LEO2VLEO
- vi. DISCOVERER Project
- vii. Hong Kong
- 3.3. Growth Markets
- Figure 3.6: Total Number of Cellular IoT Connections in Growth Markets in 2028 (m), Split by 7 Key Countries
- 3.4. Developing Markets
- Table 3.7: VLEO Satellites Country Readiness Index: North America
- Table 3.8: VLEO Satellites Country Readiness Index: Latin America
- Table 3.9: VLEO Satellites Country Readiness Index: West Europe
- Table 3.10: VLEO Satellites Country Readiness Index: Central & Eastern Europe
- Table 3.11: VLEO Satellites Country Readiness Index: Far East & China
- Table 3.12: VLEO Satellites Country Readiness Index: Indian Subcontinent
- Table 3.13: VLEO Satellites Country Readiness Index: Rest of Asia Pacific
- Table 3.14: VLEO Satellites Country Readiness Index: Africa & Middle East
4. Future Leader Index
- 4.1. Why Read this Report
- Table 4.1: Juniper Research Future Leader Index: VLEO Vendor Solutions (Part 1)
- Table 4.2: Juniper Research Future Leader Index: VLEO Vendor Solutions (Part 2)
- Figure 4.3: Juniper Research Future Leader Index: VLEO Satellites Vendors
- Table 4.4: Juniper Research VLEO Satellites Vendors Ranking
- Table 4.5: Juniper Research Future Leader Index Heatmap: VLEO Satellite Vendors
- 4.2. Albedo
- i. Corporate Information
- ii. Geographical Spread
- iii. Key Clients & Strategic Partnerships
- iv. High-level View of Offerings
- v. Juniper Research's View: Key Strengths & Strategic Opportunities
- 4.3. Blue Canyon Technologies
- i. Corporate Information
- ii. Geographical Spread
- iii. Key Clients & Strategic Partnerships
- iv. High-level View of Offerings
- v. Juniper Research's View: Key Strengths & Strategic Opportunities
- 4.4. Cspace Intelligent Technology
- i. Corporate Information
- ii. Geographical Spread
- iii. Key Clients & Strategic Partnerships
- iv. High-level View of Offerings
- v. Juniper Research's View: Key Strengths & Strategic Opportunities
- 4.5. EOI Space
- i. Corporate Information
- ii. Geographical Spread
- iii. Key Clients & Strategic Partnerships
- iv. High-level of Offerings
- v. Juniper Research's View: Key Strengths & Strategic Opportunities
- 4.6. LeoLabs
- i. Corporate Information
- ii. Geographical Spread
- iii. High-level View of Offerings
- iv. Juniper Research's View: Key Strengths & Strategic Opportunities
- 4.7. Space Forge
- i. Corporate Information
- ii. Geographical Spread
- iii. Key Clients & Strategic Partnerships
- iv. High-level View of Offerings
- v. Juniper Research's View: Key Strengths & Strategic Opportunities
- 4.8. Thales Alenia
- i. Corporate Information
- ii. Geographical Spread
- iii. Key Clients & Strategic Partnerships
- iv. High-level View of Offerings
- v. Juniper Research's View: Key Strengths & Strategic Opportunities
- 4.9. Tyvak International
- i. Corporate Information
- ii. Geographical Spread
- iii. Key Clients & Strategic Partnerships
- iv. High-level View of Offerings
- v. Juniper Research's View: Key Strengths & Strategic Opportunities
- 4.10. Redwire
- i. Corporate Information
- ii. Geographical Spread
- iii. Key Clients & Strategic Partnerships
- iv. High-level View of Offerings
- v. Juniper Research's View: Key Strengths & Strategic Opportunities
- 4.1. Juniper Research Leaderboard Assessment Methodology
- 4.2. Limitations & Interpretations
- Table 4.6: Juniper Research Future Leader Index Criteria Table: VLEO Satellites
5. Market Forecasts and Key Takeaways
- 5.1. Introduction to VLEO Satellite Forecasts
- Figure 5.1: VLEO Satellites Forecast Methodology
- 5.2. Total Number of VLEO Satellites Launched
- Figure & Table 5.2: Total Number of VLEO Satellites Launched, Split by 8 Key Regions, 2024-2030
- 5.3. Total Investment into VLEO Satellite Launches
- Figure & Table 5.3: Total Investment into VLEO Satellite Launches ($m), Split by 8 Key Regions, 2024-2030
- Table 5.4: Cumulative Total Investment into VLEO Satellite Launches ($m), Split by 8 Key Regions, 2024-2030
- 5.4. Total VLEO Satellites Primarily for Used Commercial Applications
- Figure & Table 5.5: Total Number of VLEO Satellites Primarily Used for Commercial Applications, Split by 8 Key Regions, 2024-2030
- 5.5. Total VLEO Satellites Primarily Used for Civil Applications
- Figure & Table 5.6: Total Number of VLEO Satellites Primarily Used for Civil Applications, Split by 8 Key Regions, 2024-2030
- 5.6. Total VLEO Satellites Primarily Used for Government Applications
- Figure & Table 5.7: Total Number of VLEO Satellites Primarily Used for Government Applications, Split by 8 Key Regions, 2024-2030
- 5.7. Total VLEO Satellites Primarily Used for Military Applications
- Figure & Table 5.8: Total Number of VLEO Satellites Primarily Used for Military Applications, Split by 8 Key Regions, 2024-2030
 低地球軌道衛星市場:依衛星品質、應用、軌道高度、頻段及最終用途劃分-全球預測至2036年
 2026-2030年全球低地球軌道衛星市場
 低地球軌道衛星市場規模、佔有率和成長分析(按衛星類型、應用、組件、最終用途、部署方式和地區分類)—2026-2033年產業預測
 低地球軌道衛星市場-全球產業規模、佔有率、趨勢、機會與預測:規模、子系統、應用、頻率、最終用途、區域和競爭格局,2021-2031年
 全球低地球軌道衛星市場-按應用、產品和地區分類的分析和預測(2025-2035 年)
 低地球軌道(LEO)衛星市場規模、佔有率和成長分析(按品質、頻段、推進方式、應用、最終用途和地區分類)-2026-2033年產業預測
 低地球軌道衛星市場規模、佔有率、成長及全球產業分析:依類型、應用和地區劃分的洞察與預測(2024-2032 年)
 LEO設備市場按設備類型、應用、最終用戶、頻段和技術類型分類 - 全球預測 2025-2032全球低地球軌道衛星市場(按衛星類型、子系統、衛星尺寸、頻段和最終用戶分類)預測 2025-2030
 2025年低地球軌道(LEO)衛星全球市場報告