


 |
市場調查報告書
商品編碼
1500643
通訊API的全球市場:2024-2029年Global Telecommunications API Market: 2024-2029 |
||||||
| 主要統計 | |
|---|---|
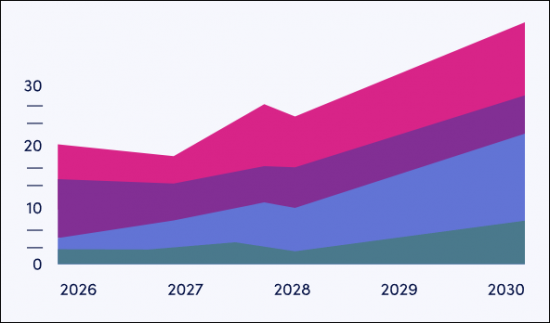
| 2024年的經營者總收益: | 509億美元 |
| 2029年的經營者總收益: | 1,595億美元 |
| 2024~2029年的市場成長率: | 213% |
| 預測期間: | 2024-2029年 |
本調查套件調查了全球電信API 市場,包括主要市場驅動因素和挑戰,API 呼叫量和運營商收入的趨勢和預測,按類別和地區/主要國家/地區進行的詳細分析,整理各大廠商的競爭排行榜等
主要的特徵
- 市場動態:評估了未來市場成長的關鍵驅動因素,包括 GSMA 開放網關和 CAMARA 專案等全球計畫在為應用程式開發人員提供網路功能存取方面的作用。還涵蓋了市場動態,例如市場顯著成長必須克服的關鍵挑戰,例如可擴展性和確保服務品質。也調查了 CAMARA 專案提供的各種 API,研究了用於將這些服務收益化的好處、需求和商業模式。
- 要點/策略建議:深入分析了通訊 API 市場的主要發展機會、行業趨勢和見解,並為利害關係人提供了關鍵策略建議。
- 基準產業預測:通訊API的市場規模和預測包括對通訊API的API呼叫總數和運營商總收入的五年預測。此預測按 API 類別進行分類。
- Juniper Research的競爭排行榜:透過 Juniper Research 競爭排行榜(分為通訊 API 供應商和網路管理 API 供應商)評估領先 API 供應商的實力和能力。
樣本視圖
市場資料&預測報告
Juniper Research,分類通訊API和網路管理API的供應商,報告主要的通訊API供應商趨勢。
市場趨勢、策略報告
目前的市場情勢綜合分析,進行策略性的建議。
市場資料&預測報告
本調查套件中,包括對一整套市場預測資料的存取,其中包含 30 個表格和 13,500 多個資料點。該調查套件包括以下指標:
- 通訊 API 呼叫總數
- 營運商透過通訊 API 呼叫獲得的總收入
API類別:
- 裝置身分和狀態
- 行動詐欺預防
- 行動支付 API
- 網路連接
- 通訊
Juniper Research互動式預測(Excel)具有以下功能:
- 統計分析:可以搜尋資料期間所有地區和國家的特定指標。可以輕鬆修改圖表並將其匯出到剪貼簿。
- 國家/地區資料工具:此工具可查看預測期間內的所有區域和國家指標。可以縮小搜尋列中顯示的指標範圍。
- 國家比較工具:可選擇特定國家進行比較。該工具包括匯出圖表的功能。
- 假設分析:透過五個互動式情境將預測指標與自己的假設進行比較。
目錄
市場趨勢/策略
第1章 要點/策略建議
- 要點
- 策略建議
第2章 未來市場展望
- 簡介
- 未來市場展望
- API 服務收益化
- 未來市場發展面臨的挑戰
第3章 GSMA 開放式閘道與 CAMARA
- GSMA 開放網關
- CAMARA API:簡介
- CAMARA 專案的範圍
- CAMARA API 類型
- 通訊 API
- 連接 API
- 裝置身分和狀態
- 行動詐欺預防
- 行動支付
- 其他 API
- 人口密度資料
- 邊緣雲端
- 區域使用者數量
- 在各地區發布 Open Gateway API
第4章 國家準備指數
- 通訊 API 國家/地區準備指數
- 優先市場
- 不斷成長的市場
- 市場飽和
- 新興市場
競爭排行榜
第1章 Juniper Research競爭排行榜:通訊 API 供應商
第2章 供應商簡介:通訊 API 供應商
- 通訊 API(通訊)供應商簡介
- BICS
- CM.com
- Comviva
- Genesys
- Infobip
- Microsoft
- Mitto
- Orange
- Route Mobile
- Sinch
- Soprano Design
- Syniverse
- Telesign
- Twilio
- Vodafone Business
- Vonage
- Juniper Research排行榜評估方法
第3章 Juniper Research競爭排行榜:網路管理 API 供應商
第4章 供應商簡介:網路管理 API 供應商
- 通訊 API(網路管理)供應商簡介
- Amazon Web Services
- BICS
- Cisco
- Comviva
- Deutsche Telekom Global Carrier
- Ericsson
- Fujitsu
- Comviva
- Deutsche Telekom Global Carrier
- Ericsson
- Fujitsu
- Google Cloud
- Huawei
- Mavenir
- Nokia
- Orange
- Syniverse
- Verizon
- Vodafone Business
- Juniper Research排行榜評估方法
- 限制和解釋
資料/預測
第1章 市場概況及未來展望
- 通訊 API 市場概況與未來展望
- 通訊 API 概述:預測
- 通訊 API 呼叫總數
- 營運商透過通訊 API 呼叫獲得的總收入
第2章 設備身分與狀態 API
- 裝置身分與狀態:簡介
- 裝置身分與狀態預測方法
- 裝置身分和狀態 API 呼叫總數
- 營運商透過設備身分和狀態 API 呼叫獲得的收入
第3章 行動詐欺防制 API
- 行動詐欺防制簡介
- 預防行動詐欺的預測方法
- 行動詐欺防制 API 呼叫總數
- 營運商透過行動防詐騙 API 呼叫獲得的收入
第4章 行動支付API
- 行動支付簡介
- 行動支付預測方法
- 行動支付 API 呼叫總數
- 營運商透過行動支付 API 呼叫獲得的收入
第5章 網路連線API
- 網路連線簡介
- 網路連線 API 呼叫總數
- 網路連線API呼叫預測方法
- 營運商透過網路連接 API 呼叫獲得的收入
第6章 通訊API
- 通訊 API:簡介
- 通訊API預測方法
- 通訊 API 呼叫總數
- 營運商透過通訊 API 呼叫獲得的收入
第7章 其他通訊API
- 其他通訊 API:簡介
- 其他通訊 API 的預測方法
- 其他通訊 API 呼叫總數
- 營運商從其他通訊 API 呼叫中獲得的收入
| KEY STATISTICS | |
|---|---|
| Total operator revenue in 2024: | $50.9bn |
| Total operator revenue in 2029: | $159.5bn |
| 2024-2029 market growth: | 213% |
| Forecast period: | 2024-2029 |
Overview
Our "Telecommunications API" (Application Programming Interfaces) research suite is comprised of comprehensive and insightful impact analysis of key factors of this evolving market; enabling stakeholders from network operators, messaging service providers, enterprise developers and hyperscalers to understand major factors that include future growth, key trends and investment opportunities in the demand for telecom APIs.
The current telecom API market report includes several different options that can be purchased separately, including access to a market forecast of the adoption and future growth of the telco API market; a detailed study highlighting the latest trends and opportunities direct impact within the market, and two leaderboard documents containing an analysis of the major players in communications API provision and leading network management API vendors in the space. The coverage can also be purchased as a full research suite, containing all of these elements, and including a substantial discount.
The custom report in the telecom sector provides a critical tool for stakeholders in the telecoms industry for navigating this rapidly developing market and dynamic landscape; allowing vendors to shape their future strategy with telco API monetisation and capitalise on emerging opportunities as programmable networks become a reality. Its extensive coverage makes this telecom API market analysis research suite an incredibly valuable resource for examining the future of this changing market.
Key Features
- Market Dynamics: Provides detailed insight into the outlook of the telco API market; assessing the key drivers to future market growth, including the role of global initiatives such as the GSMA Open Gateway and CAMARA Project in providing access to network capabilities to app developers. It addresses market dynamics such as the key challenges that must be overcome for this market to experience significant growth, including scalability and ensuring quality of service is met. The research also explores the different APIs under the CAMARA Project; examining the benefits and market demand for these services, and the commercial models which will be used for monetisation.
- Key Takeaways & Strategic Recommendations: In-depth analysis of key development opportunities, industry trends and findings within the telco API market; accompanied by key strategic recommendations for stakeholders.
- Benchmark Industry Forecasts: The market size and forecasts for telco APIs include 5-year forecasts for total number of API calls, and total operator revenue for telecommunications APIs. The forecast breaks this down into different API categories: Device Identity & Status, Mobile Fraud Prevention, Mobile Payments, Network Connectivity and Communications.
- Juniper Research Competitor Leaderboard: Key industry player capability and capacity assessments for leading telecommunications API vendors, via the Juniper Research Competitor Leaderboard; which separates communications API and network management API vendors.
Market Data & Forecasting Report
The market-leading research suite for the "Telecommunications API" market includes access to the full set of market forecast data of 30 tables and over 13,500 datapoints. Metrics in the research suite include:
- Total Number of Telecommunications API Calls
- Total Operator Revenue from Telecommunications API Calls
These metrics are provided for the following API categories:
- Device Identity & Status
- Mobile Fraud Prevention
- Mobile Payments APIs
- Network Connectivity
- Communications
Juniper Research Interactive Forecast Excel contains the following functionality:
- Statistics Analysis: Users benefit from the ability to search for specific metrics, displayed for all regions and countries across the data period. Graphs are easily modified and can be exported to the clipboard.
- Country Data Tool: This tool lets users look at metrics for all key regions and countries in the forecast period. Users can refine the metrics displayed via a search bar.
- Country Comparison Tool: Users can select countries and compare each of them for specific countries. The ability to export graphs is included in this tool.
- What-if Analysis: Here, users can compare forecast metrics against their own assumptions, via 5 interactive scenarios.
Market Trends & Strategies Report
This market study examines the "Telecommunications API" landscape in detail; assessing the trends and factors shaping the evolution of this growing market. The report delivers an in-depth analysis of the strategic opportunities for vendors; addressing key concerns, and the crucial role of how stakeholders should overcome these to capitalise and gain competitive edge on the emerging telco API opportunity. It also evaluates key country-level opportunities for telco API growth.
Competitor Leaderboard Report
This telecom industry market players report includes two Competitor Leaderboard reports, which provide a wide range and detailed evaluation and market positioning of 16 leading Communications API and 15 Network Management API vendors. The vendors are positioned as established leaders, leading challengers or disruptors and challengers based on largest market share capacity and capability assessments.
Juniper Research Competitor Leaderboard for Communications APIs, including key players:
|
|
Juniper Research Competitor Leaderboard for Network Management APIs, including key players:
|
|
These documents are centred around the Juniper Research Competitor Leaderboard; a vendor positioning tool that provides an at-a-glance view of the competitive landscape in a market, backed by a robust methodology.
Table of Contents
Market Trends & Strategies
1. Key Takeaways & Strategic Recommendations
- 1.1. Key Takeaways
- 1.2. Strategic Recommendations
2. Future Market Outlook
- 2.1. Introduction
- Figure 2.1: Enterprise Adoption of APIs without Standardised APIs
- Figure 2.2: Revenue Flow Without Telco APIs vs With
- 2.1.1. Future Market Outlook
- Figure 2.3: Total Operator Revenue from Telecommunications API Calls ($m), Split by 8 Key Regions, 2024-2029
- Figure 2.4: Total Number of Telecommunications API Calls in 2024 (m), Split by Category
- 2.1.2. Monetisation of API Services
- Figure 2.5: Business Models for API Access
- 2.1.3. Challenges for Future Market Development
3. GSMA Open Gateway and CAMARA
- 3.1. GSMA Open Gateway
- Figure 3.1: Global Coverage of Operator Groups Supporting Open Gateway
- Figure 3.2: Mobile Operators Signed Up to Open Gateway
- 3.2. Introduction to CAMARA APIs
- 3.2.1. Scope of the CAMARA Project
- 3.3. CAMARA API Types
- 3.3.1. Communications APIs
- i. Click to Dial
- Figure 3.3: Click to Dial API
- ii. Short Message Service
- iii. WebRTC
- i. Click to Dial
- 3.3.2. Connectivity APIs
- i. Connectivity Insights
- Figure 3.4: Connectivity Insights API Flow
- ii. Home Devices QoD
- iii. Network Slice Booking (Slice on Demand)
- iv. Quality on Demand
- Figure 3.5: Overview of QoD API
- v. Site to Cloud VPN
- Figure 3.6: Site to Cloud VPN API Flow
- i. Connectivity Insights
- 3.3.3. Device Identify & Status
- i. Device Identifier
- Figure 3.7: Device Identifier API
- ii. Device Location
- iii. Device Status
- iv. Device Swap
- i. Device Identifier
- 3.3.4. Mobile Fraud Prevention
- i. Call Forwarding Signal
- ii. KYC (Know Your Customer)
- Figure 3.8: KYC Match API Work Flow
- iii. Number Verification
- Figure 3.9: Without Number Verification API
- Figure 3.10: With Number Verification API
- iv. SIM Swap
- v. OTP Validation API
- 3.3.5. Mobile Payments
- i. Carrier Billing Check Out
- ii. Blockchain Public Address
- 3.3.6. Other APIs
- i. Population Density Data
- ii. Edge Cloud
- iii. Region User Count
- 3.3.1. Communications APIs
- 3.4. Open Gateway APIs Launched in Different Regions
- Table 3.11: Operators in North America That Have Commercially Launched GSMA Open Gateway APIs as of May 2024
- Table 3.12: Operators in Latin America That Have Commercially Launched GSMA Open Gateway APIs as of May 2024
- Table 3.13: Operators in West Europe That Have Commercially Launched GSMA Open Gateway APIs as of May 2024
- Table 3.14: Operators in Far East & China That Have Commercially Launched GSMA Open Gateway APIs as of May 2024
- Table 3.15: Operators in Rest of Asia Pacific That Have Commercially Launched GSMA Open Gateway APIs as of May 2024
- Table 3.16: Operators in Africa & Middle East That Have Commercially Launched GSMA Open Gateway APIs as of May 2024
4. Country Readiness Index
- 4.1. Telco API Country Readiness Index
- Figure 4.1: Countries in Each Region
- Table 4.2: Juniper Research Telco API Country Readiness Index: Scoring Criteria
- Table 4.4: Telco APIs Country Readiness Index: Market Segments
- 4.1.1. Focus Markets
- i. Support for GSMA Open Gateway
- Figure 4.5: Total Number of Telecommunications API Calls ($m), Split by Brazil, Germany, Indonesia, and Spain, 2024-2025
- ii. Demand for Fraud Prevention Services
- Figure 4.6: Total Operator Revenue from Mobile Fraud Prevention API Calls in Select Countries in Far East & China ($m), 2024-2029
- i. Support for GSMA Open Gateway
- 4.1.2. Growth Markets
- i. Operators to Prioritise Investment into 5G Infrastructure
- Figure 4.7: Total Number of 5G Connections (m) vs Operator Revenue from Network Connectivity APIs in West Europe ($m), 2026
- ii. Lower Support for the GSMA Open Gateway
- iii. Cellular IoT Connections Will Create Demand for Connectivity APIs
- Figure 4.8: Total Number of Cellular IoT Connections in Select Countries in West Europe (m), 2024-2026
- iv. High Operator ARPU Will Encourage Investment into Telecommunications APIs
- i. Operators to Prioritise Investment into 5G Infrastructure
- 4.1.3. Saturated Markets
- i. Low Demand for Telecommunications APIs
- Figure 4.9: Proportion of the Population That Are Banked (%), Average for Focus Markets vs Average for Saturated Markets, 2024
- ii. Low Operator ARPU for Future Investment into Telecommunications APIs
- i. Low Demand for Telecommunications APIs
- 4.1.4. Developing Markets
- i. Limited 5G Infrastructure
- ii. Low Demand for the Fraud Prevention Use Case
- Table 4.10: Juniper Research Country Readiness Index Heatmap: North America
- Table 4.11: Juniper Research Country Readiness Index Heatmap: Latin America
- Table 4.12: Juniper Research Country Readiness Index Heatmap: West Europe
- Table 4.13: Juniper Research Country Readiness Index Heatmap: Central & East Europe
- Table 4.14: Juniper Research Country Readiness Index Heatmap: Far East & China
- Table 4.15: Juniper Research Country Readiness Index Heatmap: Indian Subcontinent
- Table 4.16: Juniper Research Country Readiness Index Heatmap: Rest of Asia Pacific
- Table 4.17: Juniper Research Country Readiness Index Heatmap: Africa & Middle East
Competitor Leaderboard
1. Juniper Research Competitor Leaderboard: Communications API Vendors
- Table 1.1: Juniper Research Competitor Leaderboard: Vendors & Product Portfolio
- Figure 1.2: Juniper Research Competitor Leaderboard: Telecommunications API Vendors (Communications)
- Source: Juniper ResearchTable 1.3: Juniper Research Competitor Leaderboard: Vendors & Positioning
- Table 1.4: Juniper Research Competitor Leaderboard Heatmap: Telecommunications API Vendors
2. Vendor Profiles: Communications API Vendors
- 2.1. Telecommunications APIs (Communications) Vendor Profiles
- 2.1.1. BICS
- i. Corporate Information
- Table 2.1: BICS' Select Financial Information (Eurom), 2022 & 2023
- ii. Geographical Spread
- iii. Key Clients & Strategic Partnerships
- iv. High-level View of Offerings
- v. Juniper Research's View: Key Strengths & Strategic Development Opportunities
- i. Corporate Information
- 2.1.2. CM.com
- i. Corporate Information
- Table 2.2: Acquisitions Made by CM.com, 2021-Present
- Table 2.3: CM.com's Select Financial Information (Eurom), 2022-2023
- ii. Geographical Spread
- iii. Key Clients & Strategic Partnerships
- iv. High-level View of Offerings
- v. Juniper Research's View: Key Strengths & Strategic Development Opportunities
- i. Corporate Information
- 2.1.3. Comviva
- i. Corporate Information
- ii. Geographical Spread
- iii. Key Clients & Strategic Partnerships
- iv. High-level View of Offerings
- v. Juniper Research's View: Key Strengths & Strategic Development Opportunities
- 2.1.4. Genesys
- i. Corporate Information
- ii. Geographical Spread
- iii. Key Clients & Strategic Partnerships
- iv. High-level View of Offerings
- v. Juniper Research's View: Key Strengths & Strategic Development Opportunities
- 2.1.5. Infobip
- i. Corporate Information
- Table 2.4: Infobip's Acquisitions - April 2021 to Present
- ii. Geographical Spread
- iii. Key Clients & Strategic Partnerships
- iv. High-level View of Offerings
- v. Juniper Research's View: Key Strengths & Strategic Development Opportunities
- 2.1.6. Microsoft
- i. Corporate Information
- ii. Geographical Spread
- iii. Key Clients & Strategic Partnerships
- iv. High-level View of Offerings
- v. Juniper Research's View: Key Strengths & Strategic Development Opportunities
- 2.1.7. Mitto
- i. Corporate Information
- ii. Geographical Spread
- iii. Key Clients & Strategic Partnerships
- iv. High-level View of Offerings
- v. Juniper Research's View: Key Strengths & Strategic Development Opportunities
- 2.1.8. Orange
- i. Corporate Information
- ii. Geographical Spread
- Figure 2.5: Orange Operations Map
- iii. Key Clients & Strategic Partnerships
- iv. High-level View of Offerings
- Figure 2.6: Orange Business Talk API - Overview
- Figure 2.7: Orange SMS API - Overview
- v. Juniper Research's View: Key Strengths & Strategic Development Opportunities
- 2.1.9. Route Mobile
- i. Corporate Information
- Table 2.8: Route Mobile's Annual Financial Information (Indian Rupee Cr), 2021-2023
- ii. Geographical Spread
- iii. Key Clients & Strategic Partnerships
- iv. High-level View of Offerings
- Figure 2.9: How Route Mobile's OTP Service Works
- v. Juniper Research's View: Key Strengths & Strategic Development Opportunities
- i. Corporate Information
- 2.1.10. Sinch
- i. Corporate Information
- Table 2.10: Sinch's Most Recent Acquisitions, 2020-2021
- Table 2.11: Sinch's Select Financial Information ($m), 2021-2023
- ii. Geographical Spread
- iii. Key Clients & Strategic Partnerships
- iv. High-level View of Offerings
- Figure 2.12: Sinch Conversation API - Overview
- Figure 2.13: Sinch Verification API - Overview
- v. Juniper Research's View: Key Strengths & Strategic Development Opportunities
- i. Corporate Information
- 2.1.11. Soprano Design
- i. Corporate Information
- ii. Geographical Spread
- iii. Key Clients & Strategic Partnerships
- iv. High-evel View of Offerings
- v. Juniper Research's View: Key Strengths & Strategic Development Opportunities
- 2.1.12. Syniverse
- i. Corporate Information
- ii. Geographical Spread
- iii. Key Clients & Strategic Partnerships
- iv. High-level View of Offerings
- v. Juniper Research's View: Key Strengths & Strategic Development Opportunities
- 2.1.13. Telesign
- i. Corporate Information
- ii. Geographical Spread
- iii. Key Clients & Strategic Partnerships
- iv. High-level View of Offerings
- Figure 2.15: Telesign Verify API - Overview
- v. Juniper Research's View: Key Strengths & Strategic Development Opportunities
- 2.1.14. Twilio
- i. Corporate Information
- Table 2.16: Twilio's Acquisitions, Nov 2019-Present
- Table 2.17: Twilio's Revenue Information ($m), 2021-2023
- ii. Geographical Spread
- iii. Key Clients & Strategic Partnerships
- iv. High-level View of Offerings
- v. Juniper Research's View: Key Strengths & Strategic Development Opportunities
- i. Corporate Information
- 2.1.15. Vodafone Business
- i. Corporate Information
- Table 2.18: Vodafone Business' Select Financial Information (Eurom), FY 2022-2023
- ii. Geographical Spread
- iii. Key Clients & Strategic Partnerships
- iv. High-level View of Offerings
- v. Juniper Research's View: Key Strengths & Strategic Development Opportunities
- i. Corporate Information
- 2.1.16. Vonage
- i. Corporate Information
- ii. Geographical Spread
- iii. Key Clients & Strategic Partnerships
- iv. High-level View of Offerings
- v. Juniper Research's View: Key Strengths & Strategic Development Opportunities
- 2.1.1. BICS
- 2.2. Juniper Research Leaderboard Assessment Methodology
3. Juniper Research Competitor Leaderboard: Network Management API Vendors
- Table 3.1: Juniper Research Competitor Leaderboard: Vendors & Product Portfolio
- Figure 3.2: Juniper Research Competitor Leaderboard: Telecommunications API Vendors (Network Management)
- Source: Juniper ResearchTable 3.3: Juniper Research Competitor Leaderboard: Vendors & Positioning
- Table 3.4: Juniper Research Competitor Leaderboard Heatmap: Telco API Vendors (Network Management)
4. Vendor Profiles: Network Management API Vendors
- 4.1. Telecommunications APIs (Network Management) Vendor Profiles
- 4.1.1. Amazon Web Services
- i. Corporate Information
- Table 4.1: AWS' Revenue in 2021 and 2022 ($bn), 2021-2022
- ii. Geographical Spread
- Figure 4.2: Amazon Web Service Infrastructure Deployments Map, 2023
- iii. Key Clients & Strategic Partnerships
- iv. High-level View of Offerings
- v. Juniper Research's View: Key Strengths & Strategic Development Opportunities
- i. Corporate Information
- 4.1.2. BICS
- i. Corporate Information
- Table 4.3: BICS' Select Financial Information (Eurom), 2022-2023
- ii. Geographical Spread
- iii. Key Clients & Strategic Partnerships
- iv. High-level View of Offerings
- v. Juniper Research's View: Key Strengths & Strategic Opportunities
- i. Corporate Information
- 4.1.3. Cisco
- i. Corporate Information
- ii. Geographical Spread
- iii. Key Clients & Strategic Partnerships
- iv. High-level View of Offerings
- v. Juniper Research's View: Key Strengths & Strategic Development Opportunities
- 4.1.4. Comviva
- i. Corporate Information
- ii. Geographical Spread
- iii. Key Clients & Strategic Partnerships
- iv. High-level View of Offerings
- v. Juniper Research's View: Key Strengths & Strategic Development Opportunities
- 4.1.5. Deutsche Telekom Global Carrier
- i. Corporate Information
- Table 4.5: Deutsche Telekom's Select Financial Information (Eurobn), 2021-2023
- ii. Geographical Spread
- iii. Key Clients & Strategic Partnerships
- iv. High-level View of Offerings
- Figure 4.6: Deutsche Telekom Cloud of Things Features and Services
- v. Juniper Research's View: Key Strengths & Strategic Development Opportunities
- i. Corporate Information
- 4.1.6. Ericsson
- i. Corporate Information
- Table 4.7: Ericsson窶- Financial Information ($m), 2019-2023
- ii. Geographical Spread
- iii. Key Clients & Strategic Partnerships
- iv. High-level View of Offerings
- Figure 4.8: Ericsson Cloud Core Exposure Server Including Edge Exposure Server
- v. Juniper Research's View: Key Strengths & Strategic Development Opportunities
- i. Corporate Information
- 4.1.7. Fujitsu
- i. Corporate Information
- ii. Geographical Spread
- v. Juniper Research's View: Key Strengths & Strategic Development Opportunities
- 4.1.4. Comviva
- i. Corporate Information
- ii. Geographical Spread
- iii. Key Clients & Strategic Partnerships
- iv. High-level View of Offerings
- v. Juniper Research's View: Key Strengths & Strategic Development Opportunities
- 4.1.5. Deutsche Telekom Global Carrier
- i. Corporate Information
- Table 4.5: Deutsche Telekom's Select Financial Information (Eurobn), 2021-2023
- ii. Geographical Spread
- iii. Key Clients & Strategic Partnerships
- iv. High-level View of Offerings
- Figure 4.6: Deutsche Telekom Cloud of Things Features and Services
- v. Juniper Research's View: Key Strengths & Strategic Development Opportunities
- i. Corporate Information
- 4.1.6. Ericsson
- i. Corporate Information
- Table 4.7: Ericsson窶- Financial Information ($m), 2019-2023
- ii. Geographical Spread
- iii. Key Clients & Strategic Partnerships
- iv. High-level View of Offerings
- Figure 4.8: Ericsson Cloud Core Exposure Server Including Edge Exposure Server
- v. Juniper Research's View: Key Strengths & Strategic Development Opportunities
- i. Corporate Information
- 4.1.7. Fujitsu
- i. Corporate Information
- ii. Geographical Spread
- iii. Key Clients & Strategic Partnerships
- iv. High Level View of Offerings
- v. Juniper Research's View: Key Strengths & Strategic Development Opportunities
- 4.1.8. Google Cloud
- i. Corporate Information
- ii. Geographical Spread
- Figure 4.9: Google Cloud Platform Regions
- iii. Key Clients & Strategic Partnerships
- iv. High-level View of Offerings
- Figure 4.10: Overview of Google Cloud API Management
- Figure 4.11: Preview Version of Google Cloud's SIM Swap Solution
- v. Juniper Research's View: Key Strengths & Strategic Development Opportunities
- 4.1.9. Huawei
- i. Corporate Information
- Table 4.12: Huawei's Select Financial Information ($m), 2020-2023
- ii. Geographical Spread
- iii. Key Clients & Strategic Partnerships
- iv. High-level View of Offerings
- v. Juniper Research's View: Key Strengths & Strategic Development Opportunities
- i. Corporate Information
- 4.1.10. Mavenir
- i. Corporate Information
- ii. Geographical Spread
- iii. Key Clients & Strategic Partnerships
- iv. High-level View of Offerings
- Figure 4.13: MDE Digital Marketplace Approach and Key Highlights
- v. Juniper Research's View: Key Strengths & Strategic Development Opportunities
- 4.1.11. Nokia
- i. Corporate Information
- Table 4.14: Nokia's Select Financial Information (Eurom), 2021-2023
- ii. Geographical Spread
- iii. Key Clients & Strategic Partnerships
- iv. High-level View of Offerings
- v. Juniper Research's View: Key Strengths & Strategic Development Opportunities
- i. Corporate Information
- 4.1.12. Orange
- i. Corporate Information
- ii. Geographical Spread
- Figure 4.15: Orange Operations Map
- iii. Key Clients & Strategic Partnerships
- iv. High-level View of Offerings
- Figure 4.16: High-level View of Orange's Location Verification API Architecture
- Figure 4.17: High-level View of Orange's Location Retrieval API Architecture
- Figure 4.18: High-level View of Orange's Device Status API Architecture
- v. Juniper Research's View: Key Strengths & Strategic Development Opportunities
- 4.1.13. Syniverse
- i. Corporate Information
- ii. Geographical Spread
- iii. Key Clients & Strategic Partnerships
- iv. High-level View of Offerings
- v. Juniper Research's View: Key Strengths & Strategic Development Opportunities
- 4.1.14. Verizon
- i. Corporate Information
- ii. Geographical Spread
- iii. Key Clients & Strategic Partnerships
- iv. High-level View of Offerings
- v. Juniper Research's View: Key Strengths & Strategic Development Opportunities
- 4.1.15. Vodafone Business
- i. Corporate Information
- Table 4.19: Vodafone Business' Select Financial Information (Eurom), FY 2022-2023
- ii. Geographical Spread
- iii. Key Clients & Strategic Partnerships
- iv. High-level View of Offerings
- v. Juniper Research's View: Key Strengths & Strategic Development Opportunities
- i. Corporate Information
- 4.1.1. Amazon Web Services
- 4.2. Juniper Research Leaderboard Assessment Methodology
- 4.3. Limitations & Interpretations
- Table 4.20: Juniper Research Competitor Leaderboard Scoring Criteria
Data & Forecasting
1. Market Summary & Future Outlook
- 1.1. Telecommunications API Market Summary & Future Outlook
- 1.1.1. Telecommunications APIs Market Summary Forecast Methodology
- Figure 1.1: Telecommunications APIs Market Summary Forecast Methodology
- 1.1.1. Telecommunications APIs Market Summary Forecast Methodology
- 1.2. Telecommunications APIs Summary Forecasts
- 1.2.1. Total Number of Telecommunications API Calls
- Figure & Table 1.2: Total Number of Telecommunications API Calls (m), Split by Key Regions, 2024-2029
- 1.2.2. Total Operator Revenue from Telecommunications API Calls
- Figure & Table 1.3: Total Operator Revenue from Telecommunications API Calls ($m), Split by 8 Key Regions, 2024-2029
- 1.2.1. Total Number of Telecommunications API Calls
2. Device Identity & Status APIs
- 2.1. Device Identity & Status Introduction
- 2.1.1. Device Identity & Status Forecast Methodology
- Figure 2.1: Device Identity & Status APIs Forecast Methodology
- 2.1.2. Total Number of Device Identity & Status API Calls
- Figure & Table 2.2: Total Number of Device Identity & Status API Calls (m), Split by 8 Key Regions, 2024-2029
- 2.1.3. Operator Revenue from Device Identity & Status API Calls
- Figure & Table 2.3: Total Operator Revenue from Device Identity & Status API Calls ($m), Split by 8 Key Regions, 2024-2029
- 2.1.1. Device Identity & Status Forecast Methodology
3. Mobile Fraud Prevention APIs
- 3.1. Mobile Fraud Prevention Introduction
- 3.1.1. Mobile Fraud Prevention Forecast Methodology
- Figure 3.1: Mobile Fraud Prevention APIs Forecast Methodology
- 3.1.2. Total Number of Mobile Fraud Prevention API Calls
- Figure & Table 3.2: Total Number of Mobile Fraud Prevention API Calls (m), Split by 8 Key Regions, 2024-2029
- 3.1.3. Operator Revenue from Mobile Fraud Prevention API Calls
- Figure & Table 3.3: Total Operator Revenue from Mobile Fraud Prevention API Calls ($m), Split by 8 Key Regions, 2024-2029
- 3.1.1. Mobile Fraud Prevention Forecast Methodology
4. Mobile Payments APIs
- 4.1. Mobile Payments Introduction
- 4.1.1. Mobile Payments Forecast Methodology
- Figure 4.1: Mobile Payments APIs Forecast Methodology
- 4.1.2. Total Number of Mobile Payments API Calls
- Figure & Table 4.2: Total Number of Mobile Payments API Calls (m), Split by 8 Key Regions, 2024-2029
- 4.1.3. Operator Revenue from Mobile Payments API Calls
- Figure & Table 4.3: Total Operator Revenue from Mobile Payments API Calls ($m), Split by 8 Key Regions, 2024-2029
- 4.1.1. Mobile Payments Forecast Methodology
5. Network Connectivity APIs
- 5.1. Network Connectivity Introduction
- 5.1.1. Network Connectivity Forecast Methodology
- Figure 5.1: Network Connectivity APIs Forecast Methodology
- Total Number of Network Connectivity API Calls
- Figure & Table 5.2: Total Number of Connectivity API Calls (m), Split by 8 Key Regions, 2024-2029
- Figure 5.1: Network Connectivity APIs Forecast Methodology
- 5.1.2. Operator Revenue from Network Connectivity API Calls
- Figure & Table 5.3: Total Operator Revenue from Connectivity API Calls ($m), Split by 8 Key Regions, 2024-2029
- 5.1.1. Network Connectivity Forecast Methodology
6. Communications APIs
- 6.1. Communications APIs Introduction
- 6.1.1. Communications APIs Forecast Methodology
- Figure 6.1: Communications APIs Forecast Methodology
- 6.1.2. Total Number of Communications API Calls
- Figure & Table 6.2: Total Number of Communications API Calls (m), Split by Key Regions, 2024-2029
- 6.1.3. Operator Revenue from Communications API Calls
- Figure & Table 6.3: Total Operator Revenue from Communications API Calls ($m), Split by 8 Key Regions, 2024-2029
- 6.1.1. Communications APIs Forecast Methodology
7. Other Telecommunications APIs
- 7.1. Other Telecommunications APIs Introduction
- 7.1.1. Other Telecommunications APIs Forecast Methodology
- Figure 7.1: Other API Calls Forecast Methodology
- 7.1.2. Total Number of Other API Calls
- Figure & Table 7.2: Total Number of Other API Calls (m), Split by 8 Key Regions, 2024-2029
- 7.1.3. Operator Revenue from Other API Calls
- Figure & Table 7.3: Total Operator Revenue from Mobile Fraud Prevention API Calls ($m), Split by 8 Key Regions, 2024-2029
- 7.1.1. Other Telecommunications APIs Forecast Methodology
 全球通訊API市場規模、佔有率、趨勢和成長分析報告(2026-2034年)
 電信API市場規模、佔有率和成長分析(按API類型、部署模式、最終用戶、功能和地區分類)-2026-2033年產業預測
 電信API安全市場預測至2032年:按組件、API領域、安全功能、組織規模、網路類型、最終用戶和地區分類的全球分析
 電信API市場機會、成長促進因素、產業趨勢分析及預測(2025-2034年)
 電信API - 全球市場佔有率和排名、總收入和需求預測(2025-2031年)
 2025 年至 2033 年電信 API 市場規模、佔有率、趨勢和預測(按類型、用戶類型、部署、行業垂直和地區)全球通訊API整合市場:預測至2032年-按API類型、部署模式、經營模式、最終用戶和地區分類的分析
 電信 API 市場 - 全球產業規模、佔有率、趨勢、機會和預測,按 API 類型、部署模式、最終用戶、地區和競爭細分,2020-2030 年預測
 電信API市場按類型、服務類型、部署模式和最終用戶分類 - 全球預測,2025-2032年
 電訊領域API:市場佔有率分析、產業趨勢、統計數據和成長預測(2025-2030)