


 |
市場調查報告書
商品編碼
1518931
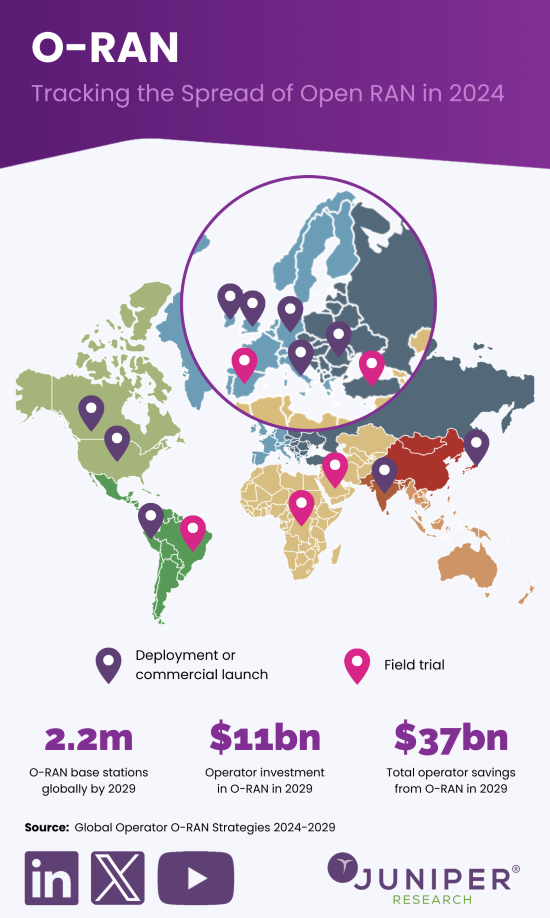
營運商 O-RAN 策略的全球市場:2024-2029Global Operator O-RAN Strategies: 2024-2029 |
||||||
營運商對 Open RAN 的投資預計將在未來五年內激增,達到 390 億美元。電信業者專注於最大限度地提高網路效率。
| 關鍵統計數據 | |
|---|---|
| 2024年營運商O-RAN投資: | 35億美元 |
| 2029年運營商O-RAN投資: | 390億美元 |
| 2029 年符合 O-RAN 標準的基地台百分比: | 19.1% |
| 預測期: | 2024-2029 |
該研究套件提供了對快速增長的競爭市場的見解和可行的見解,以幫助利益相關者(包括運營商和O-RAN 供應商)專注於運營商網絡中O-RAN 硬體和軟體的研發,並利用您的部署。
研究套件探討了全球營運商的O-RAN 策略,並提供分析和建議,以幫助營運商最大限度地發揮O-RAN 對服務品質、網路效能和網路效率的影響,以及有關RIS(可重構)、MOCN (Multi Operator Core Network)、網路切片、流量引導、專用網路的分析和建議,包括用戶設備、數據生成等的趨勢和預測,以及對 13 個 O-RAN 市場領導者和技術提供者的廣泛分析之競爭排行榜等。
主要特點
- 市場動態:涵蓋 O-RAN 市場的主要趨勢和業務見解,包括 RIS 整合、RAN 共享、流量引導、網路切片、單供應商 RAN 和多供應商 RAN。這些用例對於營運商最大限度地提高整體擁有成本並提高服務品質和網路技術效能至關重要。它還包括對 O-RAN 聯盟發佈的最新 O-RAN 標準的分析,包括新的 O-RAN 前傳介面的引入以及營運商和供應商的試驗。我們還推薦 xApp 和 rApp 開發和部署、多供應商 O-RAN 部署和整合以及綠地和棕地 O-RAN 部署的策略。
- 主要要點和策略建議:詳細分析了主要市場份額的發展機會和調查結果,並為營運商和 O-RAN 供應商提供了策略建議。
- 基準產業預測:行動網路營運商和 O-RAN 供應商的市場規模預測和業務概述提供了對行動用戶和蜂窩物聯網設備總數、營運商總收入和蜂窩數據生成總量的預測。它還包括基地台總數、O-RAN基地台總數、營運商O-RAN總投資和商業部署,以及未來五年累積O-RAN投資預測。
- Juniper Research 的競爭排行榜:彙集了 13 家 O-RAN 供應商的能力和能力評級。它詳細分析了 O-RAN 行業主要參與者的市場規模及其提供的服務。
樣本視圖
市場數據/預測報告:
市場趨勢/策略報告:
市場數據及預測報告
該研究套件包括對 40 個表格和 24,000 多個數據點中的一整套預測數據的存取。調查包含以下指標:
- 用戶設備總數:依行動訂閱/蜂窩物聯網設備劃分
- 用戶設備產生的蜂窩數據總量:按行動合約和蜂窩物聯網設備
- 來自用戶設備的營運商總收入:按行動合約和蜂窩物聯網設備分類
- 基地台總數
- 符合 O-RAN 標準的基地台總數
- 業者每年對O-RAN的投資總額
- 營運商對O-RAN的累計投資
Juniper Research 互動式預測 Excel 具有以下功能:
- 統計分析:可以查詢資料期間所有地區、國家的特定指標。可以輕鬆修改圖表並將其匯出到剪貼簿。
- 國家資料工具:此工具可讓您查看預測期內的所有區域和國家指標。您可以縮小搜尋列中顯示的指標範圍。
- 國家比較工具:您可以選擇特定國家進行比較。該工具包括匯出圖表的功能。
- 假設分析:透過五個互動式場景,主動將預測指標與您自己的假設進行比較。
目錄
市場趨勢/策略
第1章 重點與策略建議
- 很重要的一點
- 關鍵策略建議
第2章 市場狀況
- O-RAN:簡介
- O-RAN標準的製定
- O-RAN 測試和開發
- 推動 O-RAN 開發和部署的關鍵因素
第3章 未來戰略與機遇
- O-RAN的關鍵組件
- O-RAN單元
- RIC
- SMO
- O-Cloud
- 營運商部署 O-RAN 的關鍵策略考量
- O-RAN 為營運商帶來的機遇
第4章 國家儲備指數
- 國家儲備指數:簡介
- 優先市場
- 不斷成長的市場
- 新興市場
競爭排行榜
第1章 競爭排行榜
第2章 供應商簡介
- 供應商簡介
- Airspan Networks
- Ericsson
- Fujitsu
- Juniper Networks
- Mavenir
- NEC
- Fujitsu
- Juniper Networks
- Mavenir
- NEC
- Fujitsu
- Juniper Networks
- Mavenir
- NEC
- Nokia
- Parallel Wireless
- Radisys
- Rakuten Symphony
- Samsung
- SynaXG
- VMware
- 評價方法
- 限制和解釋
數據/預測
第1章 引言/研究方法
第2章 預測概述
- 消費者訂閱總數
- 消費者訂閱產生的蜂窩數據總量
- 營運商來自消費者訂閱的總收入
- 蜂窩物聯網設備總數
- 蜂窩物聯網設備產生的蜂窩數據總量
- 來自蜂窩物聯網設備的營運商總收入
- 基地台總數
- 符合 O-RAN 標準的基地台總數
- 營運商對O-RAN的總投資
- O-RAN 為營運商節省了總成本
'Open-RAN Investment by Operators to Surge in Next Five Years Reaching $39 Billion, as Operators Focus on Maximising Network Efficiency'
| KEY STATISTICS | |
|---|---|
| Operator O-RAN investment in 2024: | $3.5bn |
| Operator O-RAN investment in 2029: | $39bn |
| Proportion of total base stations that are O-RAN-compliant in 2029: | 19.1% |
| Forecast period: | 2024-2029 |
Overview
Juniper Research's "O-RAN (Open Radio Access Network)" research suite provides insights and actionable insights into this rapidly growing and competitive market; enabling stakeholders, such as operators and O-RAN vendors to navigate and capitalise on the development and deployment of O-RAN hardware and software in operator networks.
This is achieved through a detailed assessment of the solution flexibility factors driving O-RAN architectures development and deployment in the telecommunications industry, including the growing volume and technical challenges of volatility in cellular data generation, and increasing mobile user equipment and higher RAN capital and operating expenditure. The report also provides an analysis of the different O-RAN components, including the RIC (Radio Access Network Intelligent Controller) split into non-RT RIC (Real-time Radio Access Network Intelligent Controller) and near-RT-RIC, SMO (Service Management and Orchestration), O-Cloud, and radio units, distributed units, and centralised units. It also provides operators with strategies for xApp and rApp development and deployment, O-RAN security innovation, multi-vendor and integration, and brownfield deployments.
The market growth report also includes analysis and recommendations for how operators can maximise the impact of O-RAN on quality of service, network performance, and network efficiency. Analysis and recommendations are provided for RIS (Reconfigurable Intelligent Surface) integration, MOCN (Multi Operator Core Network), network slicing, traffic steering, and private networks.
The market forecast suite includes several different options that can be purchased separately, including access to data mapping and a forecast document; a strategy and trends document detailing critical trends in the market and strategic recommendations for deploying O-RAN and maximising its benefits, such as eliminating vendor lock-in and increased access to intelligence and automation, and a Competitor Leaderboard containing extensive analysis of 13 market leaders and technology providers in O-RAN.
The connectivity technology coverage can also be purchased as a Full Research Suite, which contains all these elements and offers a substantial discount.
Collectively, they provide a critical tool for understanding these rapidly emerging market segments, and for operators and O-RAN vendors shaping their future strategy for monetisation and network transformation. Its unparalleled coverage makes this research suite an incredibly useful resource for charting the future of a crucial and rapidly growing market.
Key Features
- Market Dynamics: Insights into key trends and opportunities within the O-RAN market; such as RIS integration, RAN sharing, traffic steering, network slicing, as well as single-0vednor and multi-vendor RAN. These use cases will be critical to operators maximising total cost of ownership saving and benefits to quality of service and network technologies performance. Included is analysis of the latest O-RAN standards released by the O-RAN Alliance such as the introduction of a new O-RAN fronthaul interface, and trials by operators and vendors. Also provided are recommendations for the development and deployment of xApps and rApps, the deployment and integration of multi-vendor O-RAN, and strategies for greenfield and brownfield O-RAN deployments.
- Key Takeaways & Strategic Recommendations: In-depth analysis of key development opportunities and findings within the O-RAN market shares, accompanied by strategic recommendations for operators and O-RAN vendors.
- Benchmark Industry Forecasts: The forecast market size business overview into mobile network operators and O-RAN vendors provides forecasts for the total number of mobile subscribers and cellular IoT devices, total operator revenue, and total cellular data generated. Also included are forecasts for the total number of base stations, total number of O-RAN base stations, total operator investment and commercial deployment in O-RAN, and cumulative investment in O-RAN over the next five years.
- Juniper Research Competitor Leaderboard: Key player capability and capacity assessment of 13 O-RAN vendors via the Juniper Research Competitor Leaderboard. This features market sizing for major players in the O-RAN industry and detailed analysis of their offerings.
Market Data & Forecasting Report
The research suite for the "O-RAN" market includes access to the full set of forecast data of 40 tables and over 24,000 datapoints. Metrics in the research suite include:
- Total User Equipment, Split by Mobile Subscriptions and Cellular IoT Devices
- Total Cellular Data Generated by User Equipment, Split by Mobile Subscriptions and Cellular IoT Devices
- Total Operator Revenue from User Equipment, Split by Mobile Subscriptions and Cellular IoT Devices
- Total Number of Base Stations
- Total Number of O-RAN Compliant Base Stations
- Total Operator Investment in O-RAN Per Year
- Cumulative Operator Investment in O-RAN
Juniper Research Interactive Forecast Excel contains the following functionality:
- Statistics Analysis: Users benefit from the ability to search for specific metrics, displayed for all regions and countries across the data period. Graphs are easily modified and can be exported to the clipboard.
- Country Data Tool: This tool lets users look at metrics for all regions and countries in the forecast period. Users can refine the metrics displayed via a search bar.
- Country Comparison Tool: Users can select and compare specific countries. The ability to export graphs is included in this tool.
- What-if Analysis: Here, users can compare forecast metrics using a proactive approach, against their own assumptions, via 5 interactive scenarios.
Market Trends & Strategies Report
This growth of demand report thoroughly examines the "O-RAN" market landscape; assessing market trends and factors shaping the evolution of this rapidly developing and growing market. The future market trends report delivers a comprehensive analysis of the strategic business opportunities for operators and O-RAN vendors.
The innovative ecosystem report addresses how stakeholders should maximise the impact of O-RAN through use cases such as RIS integration, MOCN, network slicing, traffic steering, and private networks. Analysis, market breakdown and strategic recommendations are provided for xApp and rApp development and deployment, network security innovation, such as zero trust architectures, brownfield O-RAN deployments, and multi-vendor operator deployments.
It also includes evaluation of specific operators' cloudification strategies and the wider O-RAN market in key countries. This includes analysis of the progress in O-RAN deployments and development, the development of O-RAN standards by the O-RAN Alliance, and country-level O-RAN trends.
Competitor Leaderboard Report
The Competitor Leaderboard report provides a detailed evaluation and market positioning for 13 O-RAN vendors. The key companies are positioned as established leaders, leading challengers, or disruptors and challengers based on capacity and capability assessment. This includes analysis of the key advantages in the market, O-RAN technology and ecosystem, and O-RAN partnerships and integration, with key vendors including:
|
|
This O-RAN solutions document is centred around the Juniper Research Competitor Leaderboard; a vendor positioning tool that provides an at-a-glance view of the competitive landscape in a market, backed by a robust methodology.
Table of Contents
Market Trends & Strategies
1. Key Takeaways & Strategic Recommendations
- 1.1. Key Takeaways
- 1.2. Key Strategic Recommendations
2. Market Landscape
- 2.1. O-RAN Introduction
- Figure 2.1: Map of O-RAN Commercial Deployments
- 2.2. O-RAN Standard Developments
- 2.3. O-RAN Trials and Developments
- 2.4 Key Factors Driving O-RAN Development and Deployment
- 2.4.1. 5G and 6G Networks Necessitate Expanded RAN Deployments
- Figure 2.2: Total Number of Base Stations, Split by Eight Key Regions, 2024-2029
- i. Base Station Site Availability Issues Promote RAN Sharing
- 2.4.2. Cellular Data Generation Growth Requires RAN Intelligence
- Figure 2.3: Total Cellular Data Consumed (PB), Split by Mobile Subscribers and Cellular IoT, 2024-2029
- i. Increasingly Volatility in Cellular Data Consumption
- 2.4.1. 5G and 6G Networks Necessitate Expanded RAN Deployments
3. Future Strategies & Opportunities
- 3.1 Key Components of O-RAN
- Figure 3.1: O-RAN Architecture
- 3.1.1. O-RAN Units
- 3.1.2. RIC
- Figure 3.2:RIC Use Cases
- Figure 3.3: RIC Architecture
- i. xApp and rApp Strategies
- 3.1.3. SMO
- 3.1.4. O-Cloud
- 3.2 Key Strategic Considerations for Operators Implementing O-RAN
- 3.2.1. Multi-Vendor Transitions and System Integration
- 3.2.2. Greenfield and Brownfield O-RAN Deployments
- 3.2.3. Security in O-RAN Deployments
- Figure 3.4: 2024 O-RAN Security Specifications Roadmap
- i. Zero-Trust Architectures in O-RAN
- 3.3. Operator Opportunities in O-RAN
- 3.3.1. Intelligent Electromagnetic Environments With RIS
- Figure 3.5: RIS In Operation
- 3.3.2. MOCN (Multi-Operator Core Networks) Strategies in O-RAN
- 3.3.3. MIMO
- 3.3.4. Network Slicing Optimisation
- 3.3.5. Traffic Steering
- 3.3.6. Private Networks
- Figure 3.6: Key Market Verticals for Private Networks
- 3.3.1. Intelligent Electromagnetic Environments With RIS
4. Country Readiness Index
- 4.1. Introduction to Country Readiness Index
- Figure 4.1: O-RAN Country Readiness Index Regional Definitions
- Table 4.2: Juniper Research Country Readiness Index Scoring Criteria: O-RAN
- Figure 4.3: Juniper Research Country Readiness Index: O-RAN
- Table 4.4: O-RAN Country Readiness Index: Market Segments
- 4.2. Focus Markets
- i. vRAN and Telecommunications Cloud Development Paves the Way for O-RAN Deployments
- ii. Huawei Ban Promotes O-RAN to Increase Competition
- 4.2.2. The US
- Figure 4.5: Total Operator Revenue from User Equipment in the US ($m), 2024-2029
- Figure 4.6: Cumulative Operator Investment in O-RAN in the US ($m), 2024-2029
- 4.3. Growth Markets
- i. China
- Figure 4.7:Total Operator Revenue From User Equipment in China ($m), 2024-2029
- Figure 4.8:Total Operator Investment in O-RAN in China ($m), 2024-2029
- i. China
- 4.4. Developing Markets
- Table 4.9: Juniper Research's Country Readiness Index Heatmap: North America
- Table 4.10: Juniper Research's Country Readiness Index Heatmap: Latin America
- Table 4.11: Juniper Research's Country Readiness Index Heatmap: West Europe
- Table 4.12: Juniper Research's Country Readiness Index Heatmap: Central & East Europe
- Table 4.13: Juniper Research's Country Readiness Index Heatmap: Far East & China
- Table 4.14: Juniper Research's Country Readiness Index Heatmap: Indian Subcontinent
- Table 4.15: Juniper Research's Country Readiness Index Heatmap: Rest of Asia Pacific
- Table 4.16: Juniper Research's Country Readiness Index Heatmap: Africa & Middle East
Competitor Leaderboard
1. Competitor Leaderboard
- 1.1. Why Read This Report
- Figure 1.1: Juniper Research Competitor Leaderboard Vendors and Product Portfolios
- Figure 1.2: Juniper Research Competitor Leaderboard: O-RAN Vendors
- Source: Juniper ResearchTable 1.3:Juniper Research Competitor Leaderboard: RAN Vendors & Positioning
- Table 1.4: Juniper Research Competitor Leaderboard Heatmap: O-RAN Vendors
2. Vendor Profiles
- 2.1. Vendor Profiles
- 2.1.1. Airspan Networks
- i. Corporate Information
- ii. Geographical Spread
- iii. Key Clients & Strategic Partnerships
- iv. High-level View of Offerings
- Figure 2.1: Airspan OpenRANGE Deployment
- v. Juniper Research's View: Key Strengths & Strategic Development Opportunities
- 2.1.2. Ericsson
- i. Corporate Information
- Table 2.2: Ericsson's Financial Information ($m), 2020-2023
- ii. Geographical Spread
- iii. Key Clients & Strategic Partnerships
- iv. High-level View of Offerings
- Figure 2.3: Ericsson's Intelligent Automation Platform Components and Interfaces
- v. Juniper Research's View: Key Strengths & Strategic Development Opportunities
- i. Corporate Information
- 2.1.3. Fujitsu
- i. Corporate Information
- ii. Geographical Spread
- iii. Key Clients & Strategic Partnerships
- iv. High-level View of Offerings
- v. Juniper Research's View: Key Strengths & Strategic Development Opportunities
- 2.1.4. Juniper Networks
- i. Corporate Information
- ii. Geographical Spread
- iii. Key Clients & Strategic Partnerships
- iv. High-level View of Offerings
- Figure 2.4: Juniper Networks' RIC
- v. Juniper Research's View: Key Strengths & Strategic Development Opportunities
- 2.1.5. Mavenir
- i. Corporate Information
- ii. Geographical Spread
- iii. Key Clients & Strategic Partnerships
- iv. High-level View of Offerings
- v. Juniper Research's View: Key Strengths & Strategic Development Opportunities
- 2.1.6. NEC
- i. Corporate Information
- ii. Geographical Spread
- iii. Key Clients & Strategic Partnerships
- v. Juniper Research's View: Key Strengths & Strategic Development Opportunities
- 2.1.3. Fujitsu
- i. Corporate Information
- ii. Geographical Spread
- iii. Key Clients & Strategic Partnerships
- iv. High-level View of Offerings
- v. Juniper Research's View: Key Strengths & Strategic Development Opportunities
- 2.1.4. Juniper Networks
- i. Corporate Information
- ii. Geographical Spread
- iii. Key Clients & Strategic Partnerships
- iv. High-level View of Offerings
- Figure 2.4: Juniper Networks' RIC
- v. Juniper Research's View: Key Strengths & Strategic Development Opportunities
- 2.1.5. Mavenir
- i. Corporate Information
- ii. Geographical Spread
- iii. Key Clients & Strategic Partnerships
- iv. High-level View of Offerings
- v. Juniper Research's View: Key Strengths & Strategic Development Opportunities
- 2.1.6. NEC
- i. Corporate Information
- ii. Geographical Spread
- iii. Key Clients & Strategic Partnerships
- iv. High-level View of Offerings
- Figure 2.5: NEC Open vRAN
- v. Juniper Research's View: Key Strengths & Strategic Development Opportunities
- 2.1.7. Nokia
- i. Corporate Information
- Table 2.6: Nokia Select Financial Information ($m), 2020-2023
- ii. Geographical Spread
- iii. Key Clients & Strategic Partnerships
- iv. High-level View of Offerings
- Figure 2.7: Nokia 5G AirScale Radio Product Offerings
- Figure 2.8: Nokia anyRAN
- v. Juniper Research's View: Key Strengths & Strategic Development Opportunities
- i. Corporate Information
- 2.1.8. Parallel Wireless
- i. Corporate Information
- ii. Geographical Spread
- iii. Key Clients & Strategic Partnerships
- iv. High-level View of Offerings
- Figure 2.9: Parallel Wireless O-RAN Solution
- Figure 2.10: Parallel Wireless Service Orchestration and Management
- v. Juniper Research's View: Key Strengths & Strategic Development Opportunities
- 2.1.9. Radisys
- i. Corporate Information
- ii. Geographical Spread
- iii. Key Clients & Strategic Partnerships
- iv. High-level View of Offerings
- v. Juniper Research's View: Key Strengths & Strategic Development Opportunities
- 2.1.10. Rakuten Symphony
- i. Corporate Information
- ii. Geographical Spread
- iii. Key Clients & Strategic Partnerships
- iv. High-level View of Offerings
- v. Juniper Research's View: Key Strengths & Strategic Development Opportunities
- 2.1.11. Samsung
- i. Corporate Information
- Table 2.11: Samsung's Financial Information ($b), 2019-2022
- ii. Geographical Spread
- iii. Key Clients & Strategic Partnerships
- iv. High-level View of Offerings
- Figure 2.12: Samsung vRAN Roadmap
- Figure 2.13: Samsung Network Radios
- v. Juniper Research's View: Key Strengths & Strategic Development Opportunities
- i. Corporate Information
- 2.1.12. SynaXG
- i. Corporate Information
- ii. Geographical Spread
- iii. Key Clients & Strategic Partnerships
- iv. High-Level View of Offerings
- Figure 2.14: SynaXG O-RAN Software
- Figure 2.15: SynaXG's RAN Offerings
- v. Juniper Research's View: Key Strengths & Strategic Development Opportunities
- 2.1.13. VMware
- i. Corporate Information
- ii. Geographical Spread
- iii. Key Clients & Strategic Partnerships
- iv. High-level View of Offerings
- Figure 2.16: VMware Telco Cloud Platform
- Figure 2.17: VMware Centralised RIC and Decentralised RIC
- v. Juniper Research's View: Key Strengths & Strategic Development Opportunities
- 2.1.1. Airspan Networks
- 2.2. Juniper Research Leaderboard Assessment Methodology
- 2.3. Limitations & Interpretations
- Table 2.18: Juniper Research Competitor Leaderboard: O-RAN
Data & Forecasting
1. Introduction and Methodology
- 1.1. Introduction to O-RAN
- Figure 1.1: Total Investment in O-RAN by Operators per year ($m), 2024-2029
- 1.2. Methodology
- Figure 1.2:O-RAN Market Methodology
2. Forecast Summary
- 2.1. Total Number of Consumer Subscriptions
- Figure & Table 2.1: Total Number of Consumer Subscriptions (), Split By 8 Key Regions, 2024-2029
- 2.2. Total Cellular Data Generated by Consumer Subscriptions
- Figure & Table 2.2: Total Cellular Data Generated by Consumer Subscriptions, Split By 8 Key Regions, 2024-2029
- 2.3. Total Operator Revenue From Consumer Subscriptions
- Figure & Table 2.3: Total Operator Revenue From Consumer Subscriptions ($m), Split by 8 Key Regions, 2024-2029
- 2.4. Total Number of Cellular IoT Devices
- Figure & Table 2.4:Total Number of Cellular IoT Devices (m), Split By 8 Key Regions, 2024-2029
- 2.5. Total Cellular Data Generated by Cellular IoT Devices
- Figure & Table 2.5: Total Cellular Data Generated by Cellular IoT Devices (PB), Split by 8 Key Regions, 2024-2029
- 2.6. Total Operator Revenue from Cellular IoT Devices
- Figure & Table 2.6: Total Operator Revenue from Cellular IoT Devices ($m), Split by 8 Key Regions, 2024-2029
- 2.7. Total Number of Base Stations
- Figure & Table 2.7: Total Number of Base Stations, Split by 8 Key Regions, 2024-2029
- 2.8. Total Number of O-RAN Compliant Base Stations
- Figure & Table 2.8: Total Number of O-RAN Compliant Base Stations, Split By 8 Key Regions, 2024-2029
- 2.9. Total Operator Investment in O-RAN
- Figure & Table 2.9: Total Operator Investment in O-RAN ($m), Split By 8 Key Regions, 2024-2029
- 2.10. Total Operator Savings From O-RAN
- Figure & Table 2.10: Total Operator Savings From O-RAN ($m), Split By 8 Key Regions, 2024-2029
 歐洲電信業者在「最環保電信業者」排名中佔主導地位:從全球前十的七家歐洲公司汲取經驗——如何應對川普政府的親化石燃料戰略
 開放式無線接取網路(O-RAN) 市場分析及至 2035 年預測:按類型、產品類型、服務、技術、組件、應用、部署類型、最終用戶和功能分類
 2025-2029年全球人工智慧與無線接取網路流量最佳化市場
 開放式無線存取網市場規模、佔有率和趨勢分析報告:按組件、單元、部署類型、網路、頻率、地區和細分市場預測(2026-2033 年)
 O-RAN 近即時無線存取網智慧控制器市場 - 全球產業規模、佔有率、趨勢、機會和預測,按組件、部署方式、地區和競爭格局分類,2020-2030 年預測開放式無線存取網市場-全球產業規模、佔有率、趨勢、機會和預測,依部署方式、網路類型、元件、頻率、最終用途、地區和競爭格局分類,2020-2030年預測
 開放式無線接取網路市場:依組件、網路功能、網路世代、頻率、部署模式、最終用途及部署階段分類-2025-2032年全球預測虛擬化無線接取網路市場規模、佔有率和趨勢分析報告:按組件、部署類型、網路類型、最終用途、地區和細分市場預測,2025 年至 2033 年
 O-RAN近即時RAN智慧控制器的全球市場全球Open RAN市場