


 |
市場調查報告書
商品編碼
1537092
再生能源技術的全球市場:2024-2029Global Renewable Energy Technology Market: 2024-2029 |
||||||
| 主要統計 | |
|---|---|
| 2024年再生能源發電總量: | 9,603.3TWh |
| 2029年再生能源發電總量: | 11,980.6TWh |
| 2029年再生能源在電力容量中所佔的比例: | 7% |
| 預測週期: | 2024-2029 |
本報告對再生能源技術市場進行了深入分析,以幫助再生能源技術製造商和供應商了解主要趨勢、潛在的快速成長驅動因素和機會以及使其成為可能的競爭格局。
取得再生能源技術部署和再生能源技術市場未來成長率的資料,深入研究揭示市場、再生能源供應商的最新機會和趨勢,並提供對供應商、市場佔有率的廣泛分析細節等等。
提供了解再生能源市場的有效工具,使再生能源技術製造商和提供者能夠制定未來策略。
主要功能
- 市場動態:深入了解再生能源市場(包括離岸風電專案)的主要趨勢和市場擴張挑戰。除了分析再生能源技術的演變、技術進步以及採用再生能源技術的商業和消費者障礙所帶來的挑戰外,還分析了多種再生能源技術用例。再生能源技術市場佔有率分析還包括國家就緒指數,該指數分析了 60 個市場的現狀和成長前景,並提供了未來前景。
- 主要要點和策略建議:詳細分析再生能源技術市場的主要發展機會和發現,並為再生能源技術供應商提供了重要的策略建議。
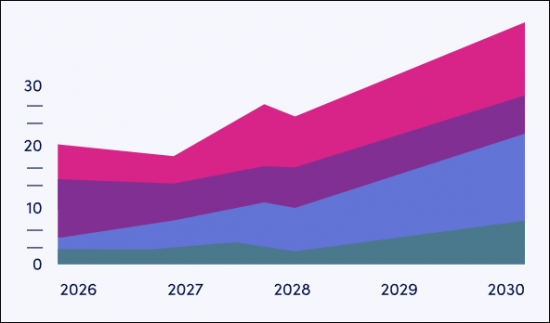
- 基準產業預測:預測包括顯示再生能源硬體支出、營運成本、再生能源裝置容量和發電量的預測,依再生能源劃分,如風能、太陽能、水力發電、生物能源等。還包括化石燃料和年度排放預測,包括煤炭、天然氣和石油發電廠。
- Juniper Research競爭排行榜:評估 15 家再生能源公司的能力。
範例視圖
市場資料與預測報告
市場趨勢與策略報告
Juniper Research 互動式預測 Excel 有以下功能:
- 統計分析:優點是可以搜尋資料期間所有地區和國家顯示的特定指標。可以輕鬆修改圖表並將其匯出到剪貼簿。
- 國家/地區資料工具:此工具可查看預測期間內的所有區域和國家指標。使用者可以縮小搜尋欄中顯示的指標範圍。
- 國家比較工具:此國家報告可選擇和比較特定國家。該工具包括匯出圖表的功能。
- 假設分析:五個互動式場景讓使用者比較預測假設。
目錄
市場趨勢/策略
第1章 要點/策略建議
- 要點
- 策略建議
第2章 市場狀況
- 定義
- 再生能源市場
- 再生能源的類型
- 風能
- 太陽能
- 水力發電
- 生物能源
- 氫氣
- 地熱能
- 核能
- 再生能源和電網
- 再生能源的類型
- 再生能源中使用的方法和技術
- 風能技術與方法
- 陸域風力渦輪機
- 離岸風力渦輪機
- 太陽能發電技術與方法
- 太陽能板
- 太陽能熱板
- 水力發電技術與方法
- 水力發電廠
- 水輪機
- 生物能源技術與方法
- 生物質燃燒
- 細菌分解
- 轉換為氣體燃料
- 轉換為液體燃料
- 氫技術與方法
- 蒸氣甲烷重整
- 電解
- 部分氧化
- 生物質氣化
- 熱化學的水分解
- 光解作用的分解水
- 地熱技術與方法
- 核子技術與方法
- 風能技術與方法
- 潛在的能量儲存
- 抽水蓄能儲能
- 熱和相變儲能
- 機械儲能
- 儲氫
- 電化學/電儲存
- 鋰離子電池儲存
- 液流電池儲存
- 主要趨勢、市場驅動因素與限制因素
- 政府政策與獎勵措施
- 國際貿易
- 太陽能發電供過於求
- 離岸專案面臨威脅
- 未來展望
第3章 細分分析
- 個案研究
- 創新
第4章 國家儲備指數
- 國家儲備指數簡介
- 優先市場
- 不斷成長的市場
競爭排行榜
第1章 Juniper Research 再生能源技術競爭排行榜
第2章 再生能源技術供應商簡介
- 再生能源技術供應商
- Brookfield Renewable
- Canadian Solar Incorporated
- China Three Gorges Corporation
- Eletrobras
- Envision
- First Solar
- General Electric Vernova
- Goldwind
- Iberdrola
- JinkoSolar Holding Company
- NextEra Energy
- Orsted
- Siemens Gamesa
- Sonnedix
- Vestas Wind Systems A/S
資料/預測
第1章 預測再生和不再生能源技術:調查方法
第2章 風能預測
- 陸域風能
- 發電裝置容量
- 陸上風力渦輪機的年度總支出
- 總營運成本
- 陸域風能的總批發成本
- 海上風能
- 發電裝置容量
- 離岸風力渦輪機的總支出
- 總營運成本
- 離岸風能的總批發成本
- 風能
- 風力發電佔發電量的百分比
- 風力發電帶來的二氧化碳排放總量減少
第3章 太陽能預測
- 太陽能
- 發電裝置容量
- 太陽能模組總支出
- 太陽能模組的總營運成本
- 太陽能批發總成本
- 太陽能發電所佔發電量的百分比
- 太陽能發電帶來的二氧化碳排放總量減少
第4章 水力發電能源預測
- 水力發電
- 發電裝置容量
- 安裝水力發電廠的總支出
- 總營運成本
- 水力發電的總批發成本
- 水力發電佔發電量的百分比
- 水力發電帶來的二氧化碳排放總量減少
第5章 生物能源預測
- 生物能源
- 發電裝置容量
- 生物能源工廠安裝總支出
- 總營運成本
- 總批發成本
- 生物能源發電量的百分比
- 透過生物能源減少二氧化碳排放總量
第6章 煤炭能源預測
- 煤炭能源
- 發電裝置容量
- 總營運成本
- 總批發成本
- 燃煤發電量佔比
- 燃煤發電的二氧化碳排放總量
第7章 天然氣能源預測
- 氣體能源
- 發電裝置容量
- 總營運成本
- 總批發成本
- 天然氣發電佔發電量的百分比
- 瓦斯發電CO2排放總量
第8章 石油能源預測
- 石油能源
- 發電裝置容量
- 每年的總營運成本
- 總批發成本
- 石油發電佔發電量的百分比
- 石油能源發電CO2排放總量
第9章 核能預測
- 核能
- 發電裝置容量
- 總營運成本
- 核能總批發成本
- 核電發電量佔發電量的百分比
'Renewable Energy Technology to Save Over 2.4 Gigatonnes of CO2 Globally by 2029.'
| KEY STATISTICS | |
|---|---|
| Total renewable energy generated in 2024: | 9,603.3 TWh |
| Total renewable energy generated in 2029: | 11,980.6 TWh |
| Proportion of electricity capacity attributable to renewable energy in 2029: | 7% |
| Forecast period: | 2024-2029 |
Overview
Our "Renewable Energy Technology" research suite provides detailed analysis of the renewable energy technology market; allowing renewable energy technology manufacturers and renewable energy suppliers to gain an understanding of key trends, potential rapid growth factors and opportunities, and the competitive environment.
Providing multiple options that can be purchased separately, major factors of the research suite include access to data mapping the deployment of renewable energy technologies and the future growth rate of the renewable energy technologies market, a detailed study revealing the latest opportunities and trends within the market, and an insightful document containing an extensive analysis of 15 renewable energy vendors and providers within the space; detailing largest market share. The coverage can also be purchased as a Full Research Suite, containing all of these elements, at a substantial discount.
Collectively, these elements provide an effective tool for understanding this constantly evolving sources of energy market, enabling renewable energy technology manufacturers and providers to set out their future strategies. The renewable energy market report's unparalleled coverage makes this research suite an incredibly useful resource for gauging the future of the demand of electricity in this complex renewable energy sector.
Key Features
- Market Dynamics: Insights into key trends and market expansion challenges within the renewable energy market such as offshore wind projects; addressing the challenges posed by the evolving nature of renewable energy technologies, technological advancements, commercial and consumer barriers to renewable energy technology adoption, in addition to analysis of multiple renewable energy technology use cases. The renewable energy technology market share research also includes a Country Readiness Index; analysing the current development and growth of the renewable energy technology market in 60 countries, as well as providing a future outlook.
- Key Takeaways & Strategic Recommendations: In-depth analysis of key development opportunities and key findings within the renewable energy technology market, accompanied by key strategic recommendations for renewable energy technology vendors.
- Benchmark Industry Forecasts: This clean electricity overview into renewable energy technology includes forecasts presenting renewable energy hardware spend, operational costs, and installed renewable energy capacity and generation; split by different renewable energy sources including wind energy, solar energy, hydro, and bioenergy. The forecast also includes accompanying forecasts for fossil fuels and annual emissions, including coal, gas, and oil power plants.
- Juniper Research Competitor Leaderboard: Key player capability and capacity assessment for 15 renewable energy companies, via the Juniper Research Competitor Leaderboard, featuring renewable energy market size for major players in the renewable energy technology industry.
SAMPLE VIEW
Market Data & Forecasting Report
The numbers tell you what's happening, but our written report details why, alongside the methodologies.
Market Trends & Strategies Report
A comprehensive analysis of the current market landscape, alongside strategic recommendations.
The market-leading research suite for the "Renewable Energy Technology" market includes access to the full set of forecast data, consisting of 127 tables and over 57,900 datapoints. Metrics in the research suite include:
- Total Installed Energy Capacity
- Total Operational Costs of Energy Technology
- Total Wholesale Cost of Energy
- Proportion Attributable to Total Electricity Generation
- Amount of Carbon Emissions Avoided/Produced
These metrics are provided for the following key market verticals:
- Renewable Energy Sources & Technology
- Wind Turbines Power
- Onshore Wind Power
- Offshore Wind Power
- Solar Power
- Hydroelectric Power
- Bioenergy Power
- Non-renewable Energy Sources & Technology
- Coal Power
- Gas Power
- Oil Power
- Nuclear Power
The Juniper Research Interactive Forecast Excel contains the following functionality:
- Statistics Analysis: Users benefit from the ability to search for specific metrics, displayed for all regions and countries across the data period. Graphs are easily modified and can be exported to the clipboard.
- Country Data Tool: This tool lets the user look at metrics for all regions and countries in the forecast period. Users can refine the metrics displayed via the search bar.
- Country Comparison Tool: Users can select and compare specific countries in this country-level report. The ability to export graphs is included in this tool.
- What-if Analysis: Here, users can compare forecast metrics against their own assumptions, via five interactive scenarios.
Market Trends & Strategies Report
This energy efficiency report examines the "Renewable Energy Technology" market landscape in detail; assessing market trends and factors shaping the evolution of this growing market, such as offshore wind technology and pyramidal solar lenses. The report delivers comprehensive analysis of the strategic opportunities for renewable energy technology providers and market participants; addressing key verticals and developing challenges, and how vendors should navigate these. As well as looking into renewable technology use cases, it also includes evaluation of key country-level opportunities for renewable energy growth.
Competitor Leaderboard Report
The renewable sources Competitor Leaderboard report provides a detailed evaluation and market positioning for 15 leading vendors in the renewable energy space. These renewable electricity vendors are positioned as an established leader, leading challenger, or disruptor and challenger, based on capacity and capability assessments.
The 15 renewable energy technology vendors consist of:
|
|
This document is centred around the Juniper Research Competitor Leaderboard, a vendor positioning tool that provides an at a glance view of the competitive landscape in a market, backed by a robust methodology.
Table of Contents
Market Trends & Strategies
1. Key Takeaways & Strategic Recommendations
- 1.1. Key Takeaways
- 1.2. Strategic Recommendations
2. Market Landscape
- 2.1. Introduction
- 2.2. Definitions
- 2.3. Renewable Energy Market
- Figure 2.1: Renewable Energy Market Landscape
- 2.3.1. Types of Renewable Energy
- i. Wind Energy
- Figure 2.2: Onshore & Offshore Wind Turbines
- ii. Solar Energy
- Figure 2.3: Solar PV Farm
- iii. Hydroelectric Energy
- Figure 2.4: Hydroelectric Power Plant with a Reservoir
- iv. Bioenergy
- v. Hydrogen
- vi. Geothermal Energy
- Figure 2.5: Geothermal Energy Generated from the Earth's Core
- vii. Nuclear Energy
- i. Wind Energy
- 2.3.2. Renewable Energy and the Grid
- Figure 2.6: Renewable Energy Generation & Distribution to the Grid
- 2.4. Methods & Technologies Used in Renewable Energy
- 2.4.1. Wind Technologies & Methods
- i. Onshore Wind Turbine
- ii. Offshore Wind Turbine
- 2.4.2. Solar Technologies & Methods
- i. Solar PV Panel
- ii. Solar Thermal Panel
- Figure 2.7: Evacuated Tube Collector Solar Thermal Panel
- 2.4.3. Hydroelectric Technologies & Methods
- i. Hydroelectric Power Plants
- ii. Hydroelectric Turbines
- Figure 2.8: Francis Hydroelectric Turbine
- 2.4.4. Bioenergy Technologies & Methods
- i. Biomass Combustion
- ii. Bacterial Decomposition
- iii. Conversion to a Gas Fuel
- iv. Conversion to a Liquid Fuel
- 2.4.5. Hydrogen Technologies & Methods
- i. Steam-methane Reforming
- ii. Electrolysis
- iii. Partial Oxidation
- iv. Biomass Gasification
- v. Thermochemical Water Splitting
- vi. Photolytic Water Splitting
- 2.4.6. Geothermal Technologies & Methods
- 2.4.7. Nuclear Technologies & Methods
- 2.4.1. Wind Technologies & Methods
- 2.5. Potential Energy Storage
- 2.5.1. Pumped Hydroelectricity Energy Storage
- Figure 2.9: Closed-loop Pumped Hydroelectric Energy Storage Diagram
- 2.5.2. Thermal & Phase Transition Energy Storage
- i. Liquid-to-air Transition Energy Storage
- ii. Thermal Sand Batteries
- 2.5.3. Mechanical Energy Storage
- i. Compressed Air Energy Storage
- ii. Gravitational Energy Storage
- iii. Flywheel Energy Storage
- iv. Pumped Heat Electrical Storage
- 2.5.4. Hydrogen Storage
- 2.5.5. Electrochemical/Electricity Storage
- i. Lithium-ion Battery Storage
- ii. Flow Battery Storage
- 2.5.1. Pumped Hydroelectricity Energy Storage
- 2.6. Key Trends, Market Drivers, and Constraints
- 2.6.1. Government Policies & Incentives
- i. Solar PV Policies
- ii. Wind Energy Policies
- iii. Hydroelectric Energy Policies
- 2.6.2. International Trading
- 2.6.3. Solar PV Oversupply
- 2.6.4. Offshore Projects Under Threat
- 2.6.1. Government Policies & Incentives
- 2.7. Future Outlook
3. Segment Analysis
- 3.1. Case Studies
- 3.1.1. Solar AquaGrid Solar Canal Project
- 3.1.2. Whitelee Windfarm
- 3.1.3. Red Rock Hydroelectric Project
- 3.1.4. Attero & Peka Kroef
- 3.2. Innovations
- 3.2.1. Solar Innovations
- i. Floatovoltaics
- ii. Pyramidal Lenses
- Figure 3.1: Pyramidal Lens in Three Stages of Development
- iii. Solar Cells
- 3.2.2. Wind Innovations
- i. Bladeless Wind Turbines
- ii. Floating Wind Turbines
- iii. Flying Wind Power
- 3.2.3. Hydroelectric Innovations
- i. Helicoid Penstocks
- ii. VIVACE (Vortex Induced Vibration for Aquatic Clean Energy)
- 3.2.1. Solar Innovations
4. Country Readiness Index
- 4.1. Introduction to Country Readiness Index
- Figure 4.1: Renewable Energy Technology Country Readiness Index Regional Definitions
- Table 4.2: Juniper Research Country Readiness Index Scoring Criteria: Renewable Energy Technology
- Figure 4.3: Juniper Research Country Readiness Index: Renewable Energy Technology
- Figure 4.4: Renewable Energy Technology Country Readiness Index: Market Segments
- 4.1.1. Focus Markets
- i. Offshore Wind Investment
- ii. Easing International Trading
- iii. Renewable Energy Is Not Yet the Primary Energy Source
- 4.1.2. Growth Markets
- i. Large Potential for Increased Renewable Energy Generation
- ii. Markets with Great Investment Opportunities
- 4.1.3. Saturated Markets
- 4.1.4. Developing Markets
- Table 4.11: Juniper Research's Country Readiness Index Heatmap: North America
- Table 4.12: Juniper Research's Country Readiness Index Heatmap: Latin America
- Table 4.13: Juniper Research's Country Readiness Index Heatmap: West Europe
- Table 4.14: Juniper Research's Country Readiness Index Heatmap: Central & East Europe
- Table 4.15: Juniper Research's Country Readiness Index Heatmap: Far East & China
- Table 4.16: Juniper Research's Country Readiness Index Heatmap: Indian Subcontinent
- Table 4.17: Juniper Research's Country Readiness Index Heatmap: Rest of Asia Pacific
- Table 4.18: Juniper Research's Country Readiness Index Heatmap: Africa & Middle East
Competitor Leaderboard
1. Juniper Research Renewable Energy Technologies Competitor Leaderboard
- 1.1. Why Read this Report
- Table 1.1: Juniper Research Competitor Leaderboard: Renewable Energy Technology Vendors Included & Product Profiles
- Figure 1.2: Juniper Research Competitor Leaderboard: Renewable Energy Technology Vendors
- Table 1.3: Juniper Research Competitor Leaderboard Vendors & Positioning: Renewable Energy Technologies
- Table 1.4: Juniper Research Competitor Leaderboard Heatmap: Renewable Energy Technology Vendors
2. Renewable Energy Technology Vendor Profiles
- 2.1. Renewable Energy Technology Vendors
- 2.1.1. Brookfield Renewable
- i. Corporate
- Table 2.1: Brookfield Renewable Revenue for 2022 & 2023
- ii. Geographical Spread
- iii. Key Clients & Strategic Partnerships
- iv. High-level View of Offerings
- Figure 2.2: Brookfield Renewable's Holtwood Hydroelectric Facility
- v. Juniper Research Strategic Recommendations & Key Opportunities
- i. Corporate
- 2.1.2. Canadian Solar Incorporated
- i. Corporate
- Table 2.3: Canadian Solar Revenue for 2022 & 2023
- ii. Geographical Spread
- iii. Key Clients & Strategic Partnerships
- iv. High-level View of Offerings
- v. Juniper Research Strategic Recommendations & Key Opportunities
- i. Corporate
- 2.1.3. China Three Gorges Corporation
- i. Corporate
- Table 2.4: CTG Revenue for 2022 & 2023
- ii. Geographical Spread
- iii. Key Clients & Strategic Partnerships
- iv. High-level View of Offerings
- v. Juniper Research Strategic Recommendations & Key Opportunities
- i. Corporate
- 2.1.4. Eletrobras
- i. Corporate
- Table 2.5: Eletrobras Revenue for 2022-2023
- ii. Geographical Spread
- iii. Key Clients & Strategic Partnerships
- iv. High-level View of Offerings
- v. Juniper Research Strategic Recommendations & Key Opportunities
- i. Corporate
- 2.1.5. Envision
- i. Corporate
- ii. Geographical Spread
- iii. Key Clients & Strategic Partnerships
- iv. High-level View of Offerings
- v. Juniper Research Strategic Recommendations & Key Opportunities
- 2.1.6. First Solar
- i. Corporate
- Table 2.6: First Solar Revenue for 2022 & 2023 ($m)
- ii. Geographical Spread
- iii. Key Clients & Strategic Partnerships
- iv. High-level View of Offerings
- v. Juniper Research Strategic Recommendations & Key Opportunities
- i. Corporate
- 2.1.7. General Electric Vernova
- i. Corporate
- Table 2.7: GE Vernova Revenue for 2022 & 2023 ($m)
- ii. Geographical Spread
- iii. Key Clients & Strategic Partnerships
- iv. High-level View of Offerings
- v. Juniper Research Strategic Recommendations & Key Opportunities
- i. Corporate
- 2.1.8. Goldwind
- i. Corporate
- Table 2.8: Goldwind Revenue for 2022 & 2023 ($m)
- ii. Geographical Spread
- iii. Key Clients & Strategic Partnerships
- iv. High-level View of Offerings
- v. Juniper Research Strategic Recommendations & Key Opportunities
- i. Corporate
- 2.1.9. Iberdrola
- i. Corporate
- Table 2.9: Iberdrola Revenue for 2022 & 2023 ($m)
- ii. Geographical Spread
- iii. Key Clients & Strategic Partnerships
- iv. High-level View of Offerings
- v. Juniper Research Strategic Recommendations & Key Opportunities
- i. Corporate
- 2.1.10. JinkoSolar Holding Company
- i. Corporate
- Table 2.10: JinkoSolar Revenue for 2022 & 2023 ($m)
- ii. Geographical Spread
- iii. Key Clients & Strategic Partnerships
- iv. High-level View of Offerings
- v. Juniper Research Strategic Recommendations & Key Opportunities
- i. Corporate
- 2.1.11. NextEra Energy
- i. Corporate
- Table 2.11: NextEra Energy Revenue for 2022 & 2023 ($m)
- ii. Geographical Spread
- iii. Key Clients & Strategic Partnerships
- iv. High-level View of Offerings
- v. Juniper Research Strategic Recommendations & Key Opportunities
- i. Corporate
- 2.1.12 Orsted
- i. Corporate
- Table 2.12: Orsted Revenue for 2022 & 2023 ($m)
- ii. Geographical Spread
- iii. Key Clients & Strategic Partnerships
- iv. High-level View of Offerings
- v. Juniper Research Strategic Recommendations & Key Opportunities
- i. Corporate
- 2.1.13. Siemens Gamesa
- i. Corporate
- Table 2.13: Siemens Gamesa Revenue for 2022 & 2023 ($m)
- ii. Geographical Spread
- iii. Key Clients & Strategic Partnerships
- iv. High-level View of Offerings
- v. Juniper Research Strategic Recommendations & Key Opportunities
- i. Corporate
- 2.1.14. Sonnedix
- i. Corporate
- ii. Geographical Spread
- iii. Key Clients & Strategic Partnerships
- iv. High-level View of Offerings
- v. Juniper Research Strategic Recommendations & Key Opportunities
- 2.1.15. Vestas Wind Systems A/S
- i. Corporate
- Table 2.14: Vestas Wind Systems A/S Revenue for 2022 & 2023 ($m)
- ii. Geographical Spread
- iii. Key Clients & Strategic Partnerships
- iv. High-level View of Offerings
- v. Juniper Research Strategic Recommendations & Key Opportunities
- Table 2.15: Juniper Research Competitor Leaderboard Scoring Criteria: Renewable Energy Technology Vendors
- i. Corporate
- 2.1.1. Brookfield Renewable
Data & Forecasting
1. Renewable and Non-renewable Energy Technology Forecast Methodology
- 1.1. Methodology & Assumptions
- Figure 1.1: Onshore Wind Energy Forecast Methodology
- Figure 1.2: Offshore Wind Energy Forecast Methodology
- Figure 1.3: Solar Energy Forecast Methodology
- Figure 1.4: Hydroelectric Energy Forecast Methodology
- Figure 1.5: Bioenergy Energy Forecast Methodology
- Figure 1.6: Coal Energy Forecast Methodology
- Figure 1.7: Gas Energy Forecast Methodology
- Figure 1.8: Oil Energy Forecast Methodology
- Figure 1.9: Nuclear Energy Forecast Methodology
2. Wind Energy Forecasts
- 2.1. Onshore Wind Energy
- 2.1.1. Total Installed Onshore Wind Capacity
- Figure & Table 2.1: Total Global Installed Onshore Wind Capacity (GW), Split by 8 Key Regions, 2024-2029
- 2.1.2. Total Spend on Onshore Wind Turbines per annum
- Figure & Table 2.2: Total Spend on Onshore Wind Turbines ($m), Split by 8 Key Regions, 2024-2029
- 2.1.3. Total Onshore Wind Operating Costs
- Figure & Table 2.3: Total Global Onshore Wind Operating Costs ($m), Split by 8 Key Regions, 2024-2029
- 2.1.4. Total Wholesale Cost of Onshore Wind Energy
- Figure & Table 2.4: Total Global Price of Wholesale Onshore Wind Energy ($m), Split by 8 Key Regions, 2024-2029
- 2.1.1. Total Installed Onshore Wind Capacity
- 2.2. Offshore Wind Energy
- 2.2.1. Total Installed Offshore Wind Capacity
- Figure & Table 2.5: Total Installed Offshore Wind Capacity Globally (GW), Split by 8 Key Regions, 2024-2029
- 2.2.2. Total Spend on Offshore Wind Turbines
- Figure & Table 2.6: Total Spend on Offshore Wind Turbines Globally ($m), Split by 8 Key Regions, 2024-2029
- 2.2.3. Total Offshore Wind Turbine Operating Costs
- Figure & Table 2.7: Total Offshore Wind Turbine Operating Costs Globally per annum ($m), Split by 8 Key Regions, 2024-2029
- 2.2.4. Total Wholesale Cost of Offshore Wind Energy
- Figure & Table 2.8: Total Wholesale Cost of Offshore Wind Energy Globally ($m), Split by 8 Key Regions, 2024-2029
- 2.2.1. Total Installed Offshore Wind Capacity
- 2.3. Wind Energy
- 2.3.1. Proportion of Electricity Capacity Attributable to Wind
- Figure & Table 2.9: Proportion of Global Electricity Capacity Attributable to Wind Energy (%), Split by 8 Key Regions, 2024-2029
- 2.3.2. Total CO2 Equivalent Avoided Through Wind
- Figure & Table 2.10: Total CO2e Avoided by Wind Energy Globally (Gt), Split by Key Regions, 2024-2029
- 2.3.1. Proportion of Electricity Capacity Attributable to Wind
3. Solar Energy Forecasts
- 3.1. Solar Energy
- 3.1.1. Total Installed Solar Capacity
- Figure & Table 3.1: Total Installed Solar Capacity Globally (GW), Split by 8 Key Regions, 2024-2029
- 3.1.2. Total Spend on Solar Modules
- Figure & Table 3.2: Total Spend on Solar Modules Globally ($m), Split by 8 Key Regions, 2024-2029
- 3.1.3. Total Solar Module Operating Costs
- Figure & Table 3.3: Total Solar Module Operating Costs Globally per annum ($m), Split by 8 Key Regions, 2024-2029
- 3.1.4. Total Wholesale Cost of Solar Energy
- Figure & Table 3.4: Total Wholesale Cost of Solar Energy ($m), Split by 8 Key Regions, 2024-2029
- 3.1.5. Proportion of Electricity Capacity Attributable to Solar
- Figure & Table 3.5: Proportion of Electricity Capacity Attributable to Solar Globally (%), Split by 8 Key Regions, 2024-2029
- 3.1.6. Total CO2 Equivalent Avoided Through Solar
- Figure & Table 3.6: Total CO2e Avoided Through Solar Globally (Gt), Split by 8 Key Regions, 2024-2029
- 3.1.1. Total Installed Solar Capacity
4. Hydroelectric Energy Forecasts
- 4.1. Hydroelectric Energy
- 4.1.1. Total Installed Hydroelectric Energy Capacity
- Figure & Table 4.1: Total Installed Hydroelectric Capacity Globally (GW), Split by 8 Key Regions, 2024-2029
- 4.1.2. Total Spend on Hydroelectric Plant Installation
- Figure & Table 4.2: Total Spend on Hydroelectric Power Plant Installation Globally ($m), Split by 8 Key Regions, 2024-2029
- 4.1.3. Total Hydroelectric Plant Operating Costs
- Figure & Table 4.3: Total Hydroelectric Plant Operating Costs Globally per annum ($m), Split by 8 Key Regions, 2024-2029
- 4.1.4. Total Wholesale Cost of Hydroelectric Energy
- Figure & Table 4.4: Total Wholesale Cost of Hydroelectric Energy Globally ($m), Split by 8 Key Regions, 2024-2029
- 4.1.5. Proportion of Electricity Generated Attributable to Hydro
- Figure & Table 4.5: Proportion of Electricity Generated Attributable to Hydro Globally (%), Split by 8 Key Regions, 2024-2029
- 4.1.6. Total CO2 Equivalent Avoided Through Hydro
- Figure & Table 4.6: Total CO2e Avoided Through Hydro Globally (Gt), Split by 8 Key Regions, 2024-2029
- 4.1.1. Total Installed Hydroelectric Energy Capacity
5. Bioenergy Forecasts
- 5.1. Bioenergy
- 5.1.1. Total Installed Bioenergy Capacity
- Figure & Table 5.1: Total Installed Bioenergy Capacity Globally (GW), Split by 8 Key Regions, 2024-2029
- 5.1.2. Total Spend on Bioenergy Plant Installation
- Figure & Table 5.2: Total Spend on Bioenergy Plant Installation Globally ($m), Split by 8 Key Regions, 2024-2029
- 5.1.3. Total Bioenergy Plant Operating Costs
- Figure & Table 5.3: Total Bioenergy Plant Operating Costs Globally per annum ($m), Split by 8 Key Regions, 2024-2029
- 5.1.4. Total Wholesale Cost of Bioenergy
- Figure & Table 5.4: Total Wholesale Cost of Bioenergy Globally ($m), Split by 8 Key Regions, 2024-2029
- 5.1.5. Proportion of Electricity Capacity Attributable to Bioenergy
- Figure & Table 5.5: Proportion of Electricity Capacity Attributable to Bioenergy Globally (%), Split by 8 Key Regions, 2024-2029
- 5.1.6. Total CO2 Equivalent Avoided Through Bioenergy
- Figure & Table 5.6: Total CO2e Avoided Through Bioenergy Globally (Gt), Split by 8 Key Regions, 2024-2029
- 5.1.1. Total Installed Bioenergy Capacity
6. Coal Energy Forecasts
- 6.1. Coal Energy
- 6.1.1. Total Installed Coal Capacity
- Figure & Table 6.1: Total Installed Coal Capacity Globally (GW), Split by 8 Key Regions, 2024-2029
- 6.1.2. Total Coal Plant Operating Costs
- Figure & Table 6.2: Total Coal Plant Operating Costs Globally per annum ($m), Split by 8 Key Regions, 2024-2029
- 6.1.3. Total Wholesale Cost of Coal Energy
- Figure & Table 6.3: Total Wholesale Cost of Coal Energy Globally ($m), Split by 8 Key Regions, 2024-2029
- 6.1.4. Proportion of Electricity Capacity Attributable to Coal Power
- Figure & Table 6.4: Proportion of Electricity Capacity Attributable to Coal Power Globally (%), Split by 8 Key Regions, 2024-2029
- 6.1.5. Total CO2 Produced by Coal Energy Generation
- Figure & Table 6.5: Total Amount of CO2 Produced From Coal Energy Generation Globally (Gt), Split by 8 Key Regions, 2024-2029
- 6.1.1. Total Installed Coal Capacity
7. Gas Energy Forecasts
- 7.1. Gas Energy
- 7.1.1. Total Installed Gas Power Capacity
- Figure & Table 7.1: Total Installed Gas Power Capacity Globally (GW), Split by 8 Key Regions, 2024-2029
- 7.1.2. Total Gas Plant Operating Costs
- Figure & Table 7.2: Total Gas Plant Operating Costs Globally per annum ($m), Split by 8 Key Regions, 2024-2029
- 7.1.3. Total Wholesale Cost of Gas Energy
- Figure & Table 7.3: Total Wholesale Cost of Gas Energy Globally ($m), Split by 8 Key Regions, 2024-2029
- 7.1.4. Proportion of Electricity Capacity Attributable to Gas Power
- Figure & Table 7.4: 7.1.4. Proportion of Electricity Capacity Attributable to Gas Power Globally (%), Split by 8 Key Regions, 2024-2029
- 7.1.5. Total CO2 Produced From Gas Energy Generation
- Figure & Table 7.5: 7.1.5. Total CO2 Produced From Gas Energy Generation Globally (Gt), Split by 8 Key Regions, 2024-2029
- 7.1.1. Total Installed Gas Power Capacity
8. Oil Energy Forecasts
- 8.1. Oil Energy
- 8.1.1. Total Installed Oil Power Capacity
- Figure & Table 8.1: Total Installed Oil Power Capacity Globally (GW), Split by 8 Key Regions, 2024-2029
- 8.1.2. Total Oil Plant Operating Costs per annum
- Figure & Table 8.2: Total Oil Plant Operating Costs Globally per annum ($m), Split by 8 Key Regions, 2024-2029
- 8.1.3. Total Wholesale Cost of Oil Energy
- Figure & Table 8.3: Total Wholesale Cost of Oil Energy Globally ($m), Split by 8 Key Regions, 2024-2029
- 8.1.4. Proportion of Electricity Capacity Attributable to Oil Power
- Figure & Table 8.4: Proportion of Electricity Capacity Attributable to Oil Power (%), Split by 8 Key Regions, 2024-2029
- 8.1.5. Total CO2 Produced From Oil Energy Generation
- Figure & Table 8.5: Total CO2 Produced From Oil Energy Generation Globally (Gt), Split by 8 Key Regions, 2024-2029
- 8.1.1. Total Installed Oil Power Capacity
9. Nuclear Energy Forecasts
- 9.1. Nuclear Energy
- 9.1.1. Total Installed Nuclear Power Capacity
- Figure & Table 9.1: Total Installed Nuclear Power Capacity Globally (GW), Split by 8 Key Regions, 2024-2029
- 9.1.2. Total Nuclear Plant Operating Costs
- Figure & Table 9.2: Total Nuclear Power Plant Operating Costs Globally ($m), Split by 8 Key Regions, 2024-2029
- 9.1.3. Total Wholesale Cost of Nuclear Energy
- Figure & Table 9.3: Total Wholesale Cost of Nuclear Energy Globally ($m), Split by 8 Key Regions, 2024-2029
- 9.1.4. Proportion of Electricity Capacity Attributable to Nuclear Power
- Figure & Table 9.4: Proportion of Electricity Capacity Attributable to Nuclear Power Globally (%), Split by 8 Key Regions, 2024-2029
- 9.1.1. Total Installed Nuclear Power Capacity
 2032 年可再生能源創新市場預測:按組件、技術、應用、最終用戶和地區進行的全球分析綠色/可再生能源市場預測至2032年:按能源來源、技術、應用、最終用戶和地區分類的全球分析
 全球綠色電力市場(按技術、產量、安裝類型和最終用戶分類)預測 2025-2032
 2025年全球節能設備市場報告2032年替代能源市場預測:按能源來源、最終用戶和地區分類的全球分析2025年全球能源諮詢市場報告2025年全球可再生能源保險市場報告再生能源市場:產業趨勢·全球預測 (~2035年):再生能源類型·用途·投資類型·企業類型·各地區2025年全球可再生能源綜合系統市場報告2025年全球可再生能源證書市場報告