


 |
市場調查報告書
商品編碼
1558623
IoT漫遊的全球市場:2024-2029年Global IoT Roaming Market: 2024-2029 |
||||||
| 主要統計 | |
|---|---|
| 通訊業者的IoT漫遊收益 (2024年): | 11億美元 |
| 通訊業者的IoT漫遊收益 (2029年): | 23億美元 |
| 5G IoT漫遊連線數 (2029年): | 39m |
| 預測期間: | 2024-2029年 |
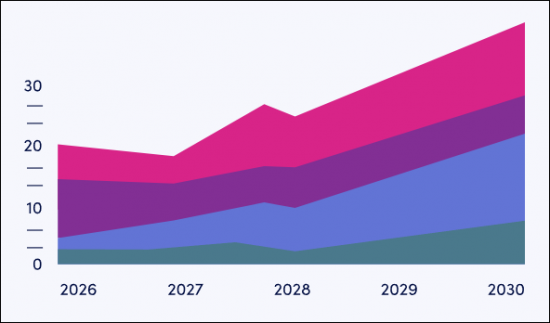
營運商的物聯網漫遊收入預計到 2029 年將超過 20 億美元
該研究套件提供了關於物聯網漫遊在快速增長的蜂窩物聯網市場中的作用的分析和可行的見解,幫助移動運營商、物聯網設備製造商和物聯網虛擬網絡運營商等利益相關者改善物聯網漫遊連線。
研究還包括對物聯網漫遊市場主要趨勢的詳細評估,例如對 5G 和 LPWA/LPWAN 漫遊連接不斷增長的需求以及 eSIM 技術在物聯網漫遊中日益重要的作用。
調查對象的5G的擴張連接性中,包含下列。
|
|
本報告還提供了有關運營商和物聯網連接提供商如何透過GSMA 的BCE(計費和計費演進)提高物聯網漫遊連接的貨幣化以及改進漫遊引導解決方案和漫遊分析的使用的訊息,並提出策略建議。
這項研究提供了有關營運商和物聯網連接供應商如何改善物聯網漫遊服務和企業物聯網解決方案的建議,包括整合衛星物聯網連接以提供無縫連接。此外,開發eSIM技術服務作為永久漫遊限制的解決方案,包括SGP.32的分析、改進的AI整合和企業漫遊分析,以及物聯網安全解決方案的開發,包括IoT SAFE。以及企業管理2G 和3G 網路退役影響的支援分析。
主要功能
- 市場趨勢:將衛星物聯網連接整合到全球連接服務、開發影響流量轉向的企業工具、eSIM 技術和企業在地化服務、物聯網安全和物聯網。漫遊市場的機遇,包括物聯網安全解決方案的開發,例如用於行動裝置的抗量子加密技術。它還包括對營運商和物聯網連接供應商應投資以改善物聯網漫遊服務的領域的分析和建議。這包括開發新的計費模型,例如 5G 增強連接漫遊、引導網間切片漫遊、向 BCE 過渡以及物聯網漫遊的網路存取。
- 主要要點和策略建議:詳細分析物聯網漫遊市場的主要發展機會和發現,以及為營運商和物聯網連接提供者提供的策略建議。
- 基準行業預測:有關漫遊 IoT 連接總數、漫遊 IoT 連接的運營商總收入、漫遊 IoT 連接生成的蜂窩數據總數、2G 和 3G、4G、5G、提供LPWA等網絡技術。
- Juniper Research 的競爭排行榜:詳細介紹各行業12 家物聯網漫遊加值服務供應商和20 家全球物聯網連接供應商的能力、容量、市場規模和服務產品,提供分析。
樣品
市場資料·預測報告:
市場趨勢。策略報告:
目前的市場情勢綜合分析,進行策略性的建議。
目錄
市場趨勢·策略
第1章 重要點和策略性推薦事項
- 重要點
- 主要的策略性推薦事項
第2章 市場形勢
- 牽引IoT漫遊市場的主要趨勢
- 儘管 5G 和 LPWA 已經到來,但 4G 對於物聯網漫遊仍然很重要
- LPWA 在物聯網漫遊中的重要性與日俱增
- 5G 物聯網漫遊的成長
第3章 未來的機會及市場策略
- 主要的機會及市場策略
- 2G及3G的Saint set策略
- TAP和BCE
- 漫遊分析
- 漫遊轉向器
- eSIM和iSIM
- IoT安全進壘
第4章 各國準備指數
- 各國準備指數:簡介
- 焦點市場
- 成長市場
- 新興市場
競爭排行榜
第1章 IoT漫遊VAS服務:競爭排行榜
第2章 IoT漫遊VAS供應商:簡介
- 業者簡介
- A1 International Business
- BICS
- Cellusys
- Comfone
- MACH
- Mobileum
- Syniverse
- Tata Communications
- Telna
- Tele2
- Telefonica Global Solutions
- TNS
- Juniper Research排行榜評估手法
- 限制與解釋
第3章 全球IoT連接:競爭排行榜
第4章 全球IoT連接:競爭排行榜
- AT&T
- A1 Digital
- BICS
- Deutsche Telekom
- emnify
- Eseye
- iBASIS
- Kore Wireless
- Onomondo
- Orange Business Services
- Soracom
- Tata Communications
- Tele2 IoT
- Telefonica Tech
- Telenor Connexion
- Telit Cinterion
- Velos IoT
- Verizon
- Vodafone Business
- Wireless Logic
- Juniper Research排行榜評估手法
- 限制與解釋
資料·預測
第1章 簡介·調查手法
第2章 市場概要·今後的市場預測
- 漫遊 IoT 連線總數
- 營運商透過漫遊物聯網連線獲得的收入
- 漫遊 IoT 連線產生的總數據
- 漫遊 4G IoT 連線總數
- 營運商透過漫遊 4G IoT 連線獲得的收入
- 漫遊 4G IoT 連線產生的總數據
- 漫遊 5G IoT 連線總數
- 營運商透過漫遊 5G IoT 連線獲得的收入
- 漫遊 5G IoT 連線產生的總數據
- 漫遊 LPWA IoT 連線總數
- 營運商從漫遊 LPWA IoT 連線中獲得的收入
- 漫遊 LPWA IoT 連線產生的總數據
| KEY STATISTICS | |
|---|---|
| Operator IoT roaming revenue in 2024: | $1.1bn |
| Operator IoT roaming revenue in 2029: | $2.3bn |
| 5G IoT roaming connections in 2029: | 39m |
| Forecast period: | 2024-2029 |
'Operator IoT Roaming Revenue to Break $2 Billion by 2029'
Overview
Our "IoT Roaming" research suite provides insights and actionable insights into the role of IoT roaming in the rapidly growing cellular IoT market; enabling stakeholders, such as mobile operators, IoT device manufacturers, and IoT MVNOs (Mobile Virtual Network Operators) to navigate the growing demand for IoT roaming connectivity.
Included is a detailed assessment of the key trends in the IoT roaming market, including the growing demand for 5G and LPWA (Low Power Wide Area)/LPWAN (Low Power Wide Area Network) roaming connectivity, as well as the growing role of eSIM technology in IoT roaming. Our 5G analysis assesses the role of 5G enhanced connectivity solutions, which provide improved quality of service; optimised for specific use cases.
The forms of 5G enhanced connectivity discussed include:
|
|
The report also provides strategic recommendations for how operators and IoT connectivity providers can improve their monetisation of IoT roaming connectivity via the GSMA's (Global System for Mobile Communications Association) BCE (Billing and Charging Evolution), and improve their use of roaming steering solutions, as well as roaming analytics.
The research delivers recommendations for how operators and IoT connectivity providers can improve their IoT roaming services and IoT solutions to enterprises, with strategic recommendations for the integration of satellite IoT connectivity to provide seamless connectivity. Plus development of eSIM technology services as a solution to roaming restrictions such as those on permanent roaming, including analysis of SGP.32, and the integration of AI and improvement of roaming analytics for enterprises. It includes further strategic recommendations for the development of IoT security solutions, including IoT SAFE, and analysis of how enterprises can be supported in managing the impact of 2G and 3G network sunsetting.
The market forecast suite includes several different options that can be purchased separately, including access to data mapping and a forecast document, a strategy and trends document detailing critical trends in the market, and strategic recommendations for developing and monetising IoT roaming services, such as the development of new charging models using BCE and the continued expansion of eSIM localisation services.
The report includes two Competitor Leaderboards. The first Competitor Leaderboard contains extensive analysis of the IoT roaming value-added services; assessing 12 market leaders providing a range of value-added services such as roaming analytics, roaming steering, and data and financial clearing. The second Competitor Leaderboard contains in-depth analysis of 20 leading vendors providing global IoT connectivity services to enterprises. It can also be purchased as a Full Research Suite, which contains all these elements and offers a substantial discount.
Collectively, they provide a critical tool for understanding the IoT roaming market, which will allow operators and IoT connectivity providers to shape their future strategies for service development and monetisation. Its unparalleled coverage makes this research suite an incredibly useful resource for charting the future of a crucial connectivity market.
Key Features
- Market Dynamics: Insights into key trends and opportunities within the IoT roaming market, such as the integration of satellite IoT connectivity into global connectivity offerings, the development of tools for enterprises to influence traffic steering, eSIM technology and localisation services for enterprises, and the development of IoT security solutions, including IoT SAFE and quantum-resistant cryptography for IoT. It also includes analysis and recommendations for where operators and IoT connectivity vendors must look to invest to improve their IoT roaming services. This includes the development of 5G-enhanced connectivity roaming, inter-network slice roaming steering, the transition to BCE, and the development of new charging models, such as network access for IoT roaming.
- Key Takeaways & Strategic Recommendations: In-depth analysis of key development opportunities and findings within the IoT roaming market, accompanied by strategic recommendations for operators and IoT connectivity providers.
- Benchmark Industry Forecasts: Data for the total number of roaming IoT connections, total operator revenue from roaming IoT connections, and total cellular data generated by roaming IoT connections. This data is provided for the market as a whole, as well as being split by the following network technologies: 2G and 3G, 4G, 5G, and LPWA.
- Juniper Research Competitor Leaderboards: Key player capability and capacity assessment of 12 IoT roaming value-added services vendors, and 20 global IoT connectivity provider. This features market sizing of vendors in each sector and detailed analysis of their offerings.
SAMPLE VIEW
Market Data & Forecasting Report:
The numbers tell you what's happening, but our written report details why, alongside the methodologies.
Market Trends & Strategies Report:
A comprehensive analysis of the current market landscape, alongside strategic recommendations.
Table of Contents
Market Trends & Strategies
1. Key Takeaways & Strategic Recommendations
- 1.1. Key Takeaways
- 1.2. Key Strategic Recommendations
2. Market Landscape
- 2.1. Introduction
- 2.2. Key Trends Driving the IoT Roaming Market
- Figure 2.1: Total Number of IoT Roaming Connections (m), Split By 8 Key Regions, 2024-2029
- 2.2.1. 4G to Remain Critical to IoT Roaming, Despite Emergence of 5G and LPWA
- Figure 2.2: Total Number of 4G IoT Roaming Connections (m), Split By 8 Key Regions, 2024-2029
- Table 2.3: 4G IoT Roaming Connections Compound Annual Growth Rate 2024-2029
- 2.2.2. LPWA to Become Increasingly Important in IoT Roaming
- Figure 2.4: Total Number of LPWA Roaming Connections, Split By 8 Key Regions, 2024-2029
- Table 2.5: NB-IoT and LTE-M Comparison
- Table 2.6: NB-IoT Evolution Comparison in 3GPP Standards
- Table 2.7: LTE Cat-M1 and LTE Cat-M2 Connectivity Comparison in 3GPP Standards
- Figure 2.8: Key LTE-M Use Cases
- 2.2.3. 5G IoT Roaming Growth
- Figure 2.9: Total Number of 5G IoT Roaming Connections, Split By 8 Key Regions, 2024-2029
- i. Enhanced Connectivity Roaming
3. Future Opportunities and Market Strategies
- 3.1. Key Opportunities and Market Strategies
- 3.1.1. 2G and 3G Sunsetting Strategies
- Figure 3.1: Total Number of 2G and 3G IoT Roaming Devices (m), Split By 8 Key Regions, 2024-2029
- Table 3.2: Upcoming 2G and 3G Network Sunsets (August 2024)
- 3.1.2. TAP and BCE
- Figure 3.3: BCE Reporting Exchange Flow
- 3.1.3. Roaming Analytics
- i. Provider Roaming Analytics
- ii. Enterprise Roaming Analytics
- Figure 3.4: Key Examples of Enterprise Roaming Analytics
- 3.1.4. Roaming Steering
- Table 3.5: OTA Roaming Steering Benefits and Costs
- Table 3.6: Signalling Roaming Steering Benefits and Costs
- 3.1.5. eSIM and iSIM
- ii. iSIM
- Table 3.7: SIM Form Factors and Dimensions
- ii. iSIM
- 3.1.6. IoT SAFE
- Figure 3.8: IoT SAFE Architecture
- Table 3.9: IoT SAFE Applet 1 and 2 Comparison
- Figure 3.10: IoT SAFE Service Operations
- Satellite IoT Roaming
- Figure 3.11: Total Satellite IoT Services Revenue ($m), Split by Market Vertical, 2024-2029
- Table 3.12: Select Recent Satellite IoT Announcements
- 3.1.1. 2G and 3G Sunsetting Strategies
4. Country Readiness Index
- 4.1. Introduction to Country Readiness Index
- Figure 4.1: IoT Roaming Country Readiness Index Regional Definitions
- Table 4.2: Juniper Research Country Readiness Index Scoring Criteria
- Figure 4.3: Juniper Research Country Readiness Index
- Table 4.4: Report Country Readiness Index: Market Segments
- 4.1.1. Focus Market
- Figure 4.5: Total Number of LPWA Roaming Connections in Select Focus Markets (m), Split By 8 Key Regions, 2024-2029
- ii. The US
- Figure 4.6: Total Number of IoT Roaming Connections in the US (m), 2024-2029
- Figure 4.7: Total Operator Revenue from IoT Roaming in the US ($m), 2024-2029
- iii. China
- Figure 4.8: Total Number of IoT Roaming Connections in China (m), 2024-2029
- 4.2. Growth Markets
- Figure 4.9: Total Number of IoT Roaming Connections in Select Key Growth Markets (m), 2024-2029
- Figure 4.10: Total Number of IoT Roaming Connections in India (m), Regions, 2024-2029
- Table 4.11: TRAI IoT eSIM recommendations
- 4.3. Developing Markets
- Table 4.12: Juniper Research's Country Readiness Index Heatmap: North America
- Table 4.13: Juniper Research's Country Readiness Index Heatmap: Latin America
- Table 4.14: Juniper Research's Country Readiness Index Heatmap: West Europe
- Table 4.15: Juniper Research's Country Readiness Index Heatmap: Central & East Europe
- Table 4.16: Juniper Research's Country Readiness Index Heatmap: Far East & China
- Table 4.17: Juniper Research's Country Readiness Index Heatmap: Indian Subcontinent
- Table 4.18: Juniper Research's Country Readiness Index Heatmap: Rest of Asia Pacific
- Table 4.19: Juniper Research's Country Readiness Index Heatmap: Africa & Middle East
Competitor Leaderboard
1. IoT Roaming VAS Services Competitor Leaderboard
- 1.1. Why Read this Report
- Table 1.1: Juniper Research Competitor Leaderboard Vendors and Product Portfolios: IoT Roaming
- Figure 1.2: Juniper Research Competitor Leaderboard: 12 Vendors
- Source: Juniper ResearchTable 1.3: Juniper Research Competitor Leaderboard: IoT Roaming Value-added Services Vendors & Positioning
- Table 1.4: Juniper Research Competitor Leaderboard Heatmap: 12 Vendors
- Source: Juniper ResearchTable 1.3: Juniper Research Competitor Leaderboard: IoT Roaming Value-added Services Vendors & Positioning
2. IoT Roaming VAS Vendor Profiles
- 2.1. Vendor Profiles
- 2.1.1. A1 International Business
- i. Corporate Information
- Table 2.1: A1 Group Select Financial Information
- ii. Geographical Spread
- iii. Key Clients & Strategic Partnerships
- iv. High-level View of Offerings
- v. Juniper Research's View: Key Strengths & Strategic Development Opportunities
- i. Corporate Information
- 2.1.2. BICS
- i. Corporate Information
- Table 2.2: BICS' Revenue, 2022-2023
- ii. Geographical Spread
- Figure 2.3. BICS' Global Presence Map
- iii. Key Clients & Strategic Partnerships
- iv. High-level View of Offerings
- Table 2.4: BICS Roaming Services
- v. Juniper Research's View: Key Strengths & Strategic Development Opportunities
- i. Corporate Information
- 2.1.3. Cellusys
- i. Corporate Information
- ii. Geographical Spread
- iii. Key Clients & Strategic Partnerships
- iv. High-level View of Offerings
- Figure 2.5: Cellusys' Offerings
- v. Juniper Research's View: Key Strengths & Strategic Development Opportunities
- 2.1.4. Comfone
- i. Corporate Information
- ii. Geographical Spread
- iii. Key Clients & Strategic Partnerships
- iv. High-level View of Offerings
- Figure 2.6: Comfone's Key2roam Hub Coverage Map
- v. Juniper Research's View: Key Strengths & Strategic Development Opportunities
- 2.1.5. MACH
- i. Corporate Information
- ii. Geographical Spread
- iii. Key Clients & Strategic Partnerships
- iv. High-level View of Offerings
- v. Juniper Research's View: Key Strengths & Strategic Development Opportunities
- 2.1.6. Mobileum
- i. Corporate Information
- ii. Geographical Spread
- iii. Key Clients & Strategic Partnerships
- iv. High-level View of Offerings
- Figure 2.7: Mobileum Wholesale Business Advisor
- Figure 2.8: Mobileum IoT Steering of Roaming
- v. Juniper Research's View: Key Strengths & Strategic Development Opportunities
- 2.1.7. Syniverse
- i. Corporate Information
- ii. Geographical Spread
- iii. Key Clients & Strategic Partnerships
- iv. High-level View of Offerings
- v. Juniper Research's View: Key Strengths & Strategic Development Opportunities
- 2.1.8. Tata Communications
- i. Corporate Information
- Table 2.10: Tata Communications' Select Financial Information (Indian Rupee in crore), FY24
- ii. Geographical Spread
- iii. Key Clients & Strategic Partnerships
- iv. High-level View of Offerings
- Figure 2.11: Tata Communications' Roaming Offerings
- v. Juniper Research's View: Key Strengths & Strategic Development Opportunities
- i. Corporate Information
- 2.1.9. Telna
- iv. High-level View of Offerings
- v. Juniper Research's View: Key Strengths & Strategic Development Opportunities
- 2.1.10. Tele2
- i. Corporate Information
- ii. Geographical Spread
- iii. Key Clients & Strategic Partnerships
- iv. High-level View of Offerings
- v. Juniper Research's View: Key Strengths & Strategic Development Opportunities
- 2.1.11. Telefonica Global Solutions
- i. Corporate Information
- Table 2.12: Telefonica's Select Financial Information (Euro-m), 2020-2022
- ii. Geographical Spread
- iii. Key Clients & Strategic Partnerships
- iv. High-level View of Offerings
- Figure 2.13: TGS 5G Roaming Suite
- v. Juniper Research's View: Key Strengths & Strategic Development Opportunities
- i. Corporate Information
- 2.1.12. TNS
- i. Corporate Information
- ii. Geographical Spread
- iii. Key Clients & Strategic Partnerships
- iv. High-level View of Offerings
- v. Juniper Research's View: Key Strengths & Strategic Development Opportunities
- 2.1.1. A1 International Business
- 2.2. Juniper Research Leaderboard Assessment Methodology
- 2.3. Limitations & Interpretations
- Table 2.14: Juniper Research Competitor Leaderboard: IoT Roaming Value-added Services
3. Global IoT Connectivity Competitor Leaderboard
- 3.1. Introduction
- Figure 3.3.1: Juniper Research Competitor Leaderboard Vendors and Product Portfolios (Part One)
- Table 3.3.2: Juniper Research Competitor Leaderboard Vendors and Product Portfolios (Part Two)
- Figure 3.3.3: Juniper Research Competitor Leaderboard: Global IoT Connectivity
- Source: Juniper ResearchTable 3.4: Juniper Research Competitor Leaderboard: Vendors & Positioning
- Table 3.3.5: Juniper Research Competitor Leaderboard Heatmap: 20 Vendors (Part One)
- Figure 3.6: Juniper Research Competitor Leaderboard Heatmap: 20 Vendors (Part Two)
4. Global IoT Connectivity Competitor Leaderboard
- 4.1. Vendor Profiles
- 4.1.1. AT&T
- i. Corporate Information
- ii. Geographical Spread
- iii. Key clients & Strategic Partnerships
- iv. High-level View of Offerings
- Figure 4.1: IoT Console
- Figure 4.2: AT&T Control Center Features
- v. Juniper Research's View: Key Strengths & Strategic Development Opportunities
- 4.1.2. A1 Digital
- i. Corporate Information
- Table 4.3: A1 Group Select Financial Information, 2020-2023
- ii. Geographical Spread
- Figure 4.4: A1 Telekom Austria Group Operations Map
- iii. Key Clients & Strategic Partnerships
- iv. High-level View of Offerings
- v. Juniper Research's View: Key Strengths & Strategic Development Opportunities
- i. Corporate Information
- 4.1.3. BICS
- i. Corporate Information
- Table 4.5: BICS Revenue ($), 2022-2023
- ii. Geographical Spread
- iii. Key Clients & Strategic Partnerships
- iv. High-level View of Offerings
- v. Juniper Research's View: Key Strengths & Strategic Development Opportunities
- i. Corporate Information
- 4.1.4. Deutsche Telekom
- i. Corporate Information
- ii. Geographical Spread
- iii. Key Clients & Strategic Partnerships
- iv. High-level View of Offerings
- Figure 4.6: Deutsche Telekom IoT Connectivity Coverage
- Figure 4.7: Deutsche Telekom Platform Integrations
- v. Juniper Research's View: Key Strengths & Strategic Development Opportunities
- 4.1.5. emnify
- i. Corporate Information
- ii. Geographical Spread
- iii. Key Clients & Strategic Partnerships
- iv. High-level View of Offerings
- Figure 4.8: emnify 5G Coverage
- v. Juniper Research's View: Key Strengths & Strategic Development Opportunities
- 4.1.6. Eseye
- i. Corporate Information
- ii. Geographical Spread
- iii. Key Clients & Strategic Partnerships
- iv. High-level View of Offerings
- Figure 4.10: Eseye's AnyNet Federation and Direct Operator Interconnects (August 2024)
- v. Juniper Research's View: Key Strengths & Strategic Development Opportunities
- 4.1.7. iBASIS
- i. Corporate Information
- ii. Geographical Spread
- Figure 4.11: iBASIS' Global Customer Connections
- iii. Key Clients & Strategic Partnerships
- iv. High-level View of Offerings
- Figure 4.12: iBASIS' NB-IoT and LTE-M Coverage
- v. Juniper Research's View: Key Strengths & Strategic Development Opportunities
- 4.1.8. Kore Wireless
- i. Corporate Information
- ii. Geographical Spread
- iii. Key Clients & Strategic Partnerships
- iv. High-level View of Offerings
- Figure 4.13: Kore One Platform
- v. Juniper Research's View: Key Strengths & Strategic Development Opportunities
- 4.1.9. Onomondo
- i. Corporate Information
- ii. Geographical Spread
- iii. Key Clients & Strategic Partnerships
- iv. High-level View of Offerings
- v. Juniper Research's View: Key Strengths & Strategic Development Opportunities
- 4.1.10. Orange Business Services
- i. Corporate Information
- ii. Geographical Spread
- Figure 4.14: Orange Operations Map
- ii. Key Clients & Strategic Partnerships
- iv. High-level View of Offerings
- v. Juniper Research's View: Key Strengths & Strategic Development Opportunities
- 4.1.11. Soracom
- i. Corporate Information
- ii. Geographical Spread
- iii. Key Clients & Strategic Partnerships
- iv. High-level View of Offerings
- Figure 4.15: Soracom Endorse Authentication Process
- Figure 4.16: Soracom Lagoon
- Figure 4.17: Soracom Unified Endpoint
- v. Juniper Research's View: Key Strengths & Strategic Development Opportunities
- 4.1.12. Tata Communications
- i. Corporate Information
- Table 4.18: Tata Communications' Select Financial Information (Indian Rupee in crore), FY24
- ii. Geographical Spread
- iii. Key Clients & Strategic Partnerships
- iv. High-level View of Offerings
- v. Juniper Research's View: Key Strengths & Strategic Development Opportunities
- i. Corporate Information
- 4.1.13. Tele2 IoT
- i. Corporate Information
- ii. Geographical Spread
- iii. Key Clients & Strategic Partnerships
- iv. High-level View of Offerings
- Figure 4.19: Tele2 IoT Network Support 2024
- Figure 4.20: Tele2 2ACESS Data Transfer Management
- v. Juniper Research's View: Key Strengths & Strategic Development Opportunities
- 4.1.14. Telefonica Tech
- i. Corporate Information
- Table 4.21: Telefonica's Select Financial Information (Euro-m), 2020-2022
- ii. Geographical Spread
- iii. Key Clients & Strategic Partnerships
- iv. High-level View of Offerings
- v. Juniper Research's View: Key Strengths & Strategic Development Opportunities
- i. Corporate Information
- 4.1.15. Telenor Connexion
- i. Corporate Information
- ii. Geographical Spread
- iii. Key Clients & Strategic Partnerships
- iv. High-level View of Offerings
- Figure 4.22: Telenor Connexion's IoT Cloud Solution
- v. Juniper Research's View: Key Strengths & Strategic Development Opportunities
- 4.1.16. Telit Cinterion
- i. Corporate Information
- Table 4.23: Telit Cinterion's Select Financial Information ($m), 2020-2021
- ii. Geographical Spread
- iii. Key Clients & Strategic Partnerships
- iv. High-level View of Offerings
- Figure 4.24: Telit eSIM Provisioning Platform
- v. Juniper Research's View: Key Strengths & Strategic Development Opportunities
- i. Corporate Information
- 4.1.17. Velos IoT
- i. Corporate Information
- ii. Geographical Spread
- iii. Key Clients & Strategic Partnerships
- iv. High-level View of Offerings
- Figure 4.25: Velos NB-IoT and LTE-M Coverage
- Figure 4.26: Velos IoT eSIM Connectivity Hub Features
- v. Juniper Research's View: Key Strengths & Strategic Development Opportunities
- 4.1.18. Verizon
- i. Corporate Information
- ii. Geographical Spread
- iii. Key Clients & Strategic Partnerships
- iv. High-level View of Offerings
- v. Juniper Research's View: Key Strengths & Strategic Development Opportunities
- 4.1.19. Vodafone Business
- i. Corporate Information
- Table 4.27: Vodafone Business Select Financial Information (Million), 2022-2023
- ii. Geographical Spread
- iii. Key Clients & Strategic Partnerships
- iv. High-level View of Offerings
- Figure 4.28: Vodafone Business' LPWA Services Availability
- v. Juniper Research's View: Key Strengths & Strategic Development Opportunities
- i. Corporate Information
- 4.1.20. Wireless Logic
- i. Corporate Information
- ii. Geographical Spread
- iii. Key Clients & Strategic Partnerships
- iv. High-level View of Offerings
- v. Juniper Research's View: Key Strengths & Strategic Development Opportunities
- 4.1.1. AT&T
- 4.2. Juniper Research Leaderboard Assessment Methodology
- 4.3. Limitations & Interpretations
- Table 4.29: Juniper Research Competitor Leaderboard: Global IoT Connectivity
Data & Forecasting
1. Introduction and Methodology
- 1.1. Introduction
- 1.2. Forecast Methodology
- Figure 1.1: IoT Roaming Forecast Methodology
2. Market Summary and Future Market Outlook
- 2.1. Total Number of IoT Connections that Are Roaming
- Figure & Table 2.1: Total Number of IoT Connections that Are Roaming (m), Split By 8 Key Regions, 2024-2029
- Table 2.2: Total Number of IoT Roaming Connections Split by Network Type (m), 2024-2029
- 2.2. Total Operator Revenue from Roaming IoT Connectivity
- Figure & Table 2.3: Total Operator Revenue from Roaming IoT Connectivity
- 2.3. Total Data Generated by Roaming IoT Connections
- Figure & Table 2.4: Total Data Generated by Roaming IoT Connections
- 2.4. Total Number of Roaming 4G IoT Connections
- Figure & Table 2.5: Tota Number of Roaming 4G IoT Connections, Split By 8 Key Regions, 2024-2029
- 2.5. Total Operator Revenue from Roaming 4G IoT Connections
- Figure & Table 2.6: Total Operator Revenue from Roaming 4G IoT Connections ($m), Split By 8 Key Regions, 2024-2029
- 2.6. Total Data Generated by Roaming 4G IoT Connections
- Figure & Table 2.7: Total Data Generated by 4G IoT Connections (PB), Split By 8 Key Regions, 2024-2029
- 2.7. Total Number of Roaming 5G IoT Connections
- Figure & Table 2.8: Total Number of Roaming 5G IoT Connections (m), Split By 8 Key Regions, 2024-2029
- 2.8. Total Operator Revenue from Roaming 5G IoT Connections
- Figure 2.9: Total Operator Revenue from Roaming 5G IoT Connections ($m), Split By 8 Key Regions, 2024-2029
- 2.9. Total Data Generated by Roaming 5G IoT Connections
- Figure & Table 2.10: Total Data Generated by Roaming 5G IoT Connections (PB), Split By 8 Key Regions, 2024-2029
- 2.10. Total Number of Roaming LPWA IoT Connections
- Figure & Table 2.11: Total Number of Roaming LPWA IoT Connections (m), Split By 8 Key Regions, 2024-2029
- 2.11. Total Operator Revenue from Roaming LPWA IoT Connections
- Figure & Table 2.12: Total Operator Revenue from Roaming LPWA IoT Connections ($m), Split By 8 Key Regions, 2024-2029
- Table 2.13: Average Operator Revenue Per Month ($), Split By 8 Key Regions, 2024-2029
- 2.12. Total Data Generated by Roaming LPWA IoT Connections
- Figure & Table 2.14: Total Data Generated by Roaming LPWA IoT Connections (PB), Split By 8 Key Regions, 2024-2029
 2026年全球物聯網(IoT)連結策略控制市場報告2026年全球開放原始碼硬體市場報告2026年飯店物聯網(IoT)全球市場報告
 物聯網市場分析及產品開發預測(至2035年):類型、產品、服務、技術、組件、應用、部署模式、最終用戶、功能、解決方案2026年全球快速用戶資料報通訊協定網際網路連線(QUIC)最佳化平台市場報告LoRa 和 LoRaWAN 物聯網全球市場報告 2026
 物聯網 (IoT)通訊協定市場:按設備類型、短距離無線通訊、通訊範圍和應用分類-2026-2032 年全球市場預測物聯網虛擬網路營運商 (MVNO) 市場:2026-2032 年全球市場預測(按設備類型、連接類型、行業和應用分類)2026年全球物聯網服務市場報告2026年全球物聯網解決方案與服務市場報告