


 |
市場調查報告書
商品編碼
1627227
行動漫遊:2025-2029 年全球市場展望Global Mobile Roaming Market: 2025-2029 |
||||||
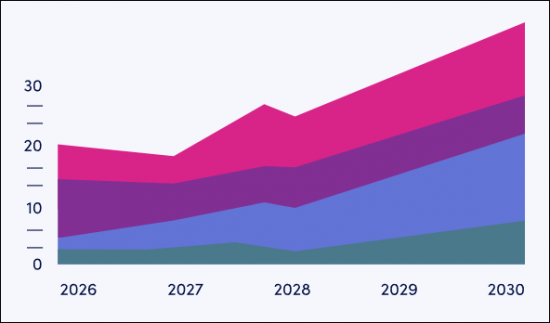
預計到 2028 年全球批發漫遊收入將翻倍
| 關鍵統計 | |
|---|---|
| 2025 年零售漫遊總收入: | 134億美元 |
| 2029 年零售漫遊總收入: | 209億美元 |
| 2025 年至 2029 年零售漫遊收入成長: | 56% |
| 預測期間: | 2024-2029 |
我們的研究套件對未來五年將發生重大變化的市場進行了深入而有見地的分析。行動漫遊供應商和行動營運商等利害關係人將能夠更好地瞭解批發和零售漫遊市場將如何發展,並可以評估旅行 eSIM、5G 漫遊和物聯網設備漫遊對市場的影響程度。
行動漫遊市場套件包含多個可單獨購買的選項,其中包括行動漫遊流量的資料映射和未來收入潛力。此外,該報告還包括重點介紹主要市場趨勢和未來機會的深入研究,以及對行動漫遊領域 23 家領先供應商的廣泛分析。
總的來說,這些為瞭解不斷變化的市場提供了重要工具,使行動漫遊供應商和營運商能夠掌握趨勢並規劃未來策略。該套件的範圍是無與倫比的,使其成為預測不可預測的市場未來的極其有用的資源。
主要特點
- 市場動態:深入瞭解行動漫遊市場變化帶來的主要趨勢和市場機會。該研究重點介紹了行動漫遊供應商和行動營運商的關鍵成長機會,包括 5G 漫遊、物聯網漫遊和旅行 eSIM 的採用。它也探討了遺留網路退役和詐欺活動所帶來的課題,並提出如何應對這些課題的建議。此外,該報告還對60個主要國家的行動漫遊市場現狀和未來成長進行了區域成長率分析,並指出了值得關注的重點市場。
- 關鍵要點和策略建議:本報告深入分析了行動漫遊市場的關鍵機會和研究成果,並為行動漫遊供應商和行動營運商提供了關鍵策略建議。
- 基準產業預測:我們提供批發漫遊和零售漫遊的 5 年預測資料庫,提供每個部門的使用者、流量和收入預測。這些領域包括消費者批發漫遊、物聯網批發漫遊、4G智慧型手機漫遊、5G智慧型手機漫遊、漫遊設備和郵輪漫遊。
- Juniper Research 競賽排行榜:評估 23 家行動漫遊供應商的能力,並根據市場表現、收入和未來業務前景等標準對其進行評分。
範例視圖
市場數據及預測報告
市場趨勢與策略報告
市場數據及預測報告
研究套件包括一份全面的五年預測資料集,其中包含 106 個表格和超過 48,300 個資料點。該研究套件包括以下指標:
- 批發漫遊流量總量
- 批發漫遊收入總額
- 零售漫遊流量總量
- 零售漫遊總收入
這些指數針對以下主要市場提供:
- 消費者批發漫遊
- 物聯網批發漫遊
- 4G 零售漫遊
- 5G 零售漫遊
- 零售消費性設備漫遊
- 巡遊漫遊
目錄
市場趨勢與策略
第 1 章 關鍵要點與策略建議
第 2 章 未來市場展望:批發漫遊
- 批發漫遊:簡介
- 2G 與 3G 的終結
- 5G漫遊
- 網路切片
- 基礎設施共享
- 捆綁服務
- VoLTE 作為 5G SA 的後備方案
- 5G漫遊安全
- 6G漫遊
- 基於雲端的漫遊服務
- 適合旅行的 eSIM
- BCE(計費和收費演進)
- 關於 API
- 物聯網漫遊設備
- 未經授權的漫遊活動
第三章 未來市場展望:零售漫遊
- 零售漫遊:簡介
- 旅行 SIM 卡和旅行 eSIM 卡
- 法規
- 基於雲端的漫遊服務
- 5G 和 6G 漫遊
- 消費者設備漫遊
- 遊輪與客艙漫遊
第 4 章:國家準備指數
- 國家準備指數:簡介
- 主要市場
- 不斷成長的市場
- 市場飽和
- 新興市場
競賽排行榜
第 1 章 Juniper Research 競爭排行榜
第 2 章 供應商簡介
- 行動漫遊供應商資料
-
奧地利電信集團
- 放大
- 比克
- 廣泛前進
- Cellusys
- 康豐
- 南部電網 德國電信全球營運商
- 阿聯酋電信
- iBASIS
- 移動
- Nextgen 清算
- 橙色批發
- 漫遊能力
- Syniverse 塔塔通訊
- Tele2 國際批發 西班牙電信全球解決方案
- Telenor Linx
- 特爾納
- TNS
- 托米亞
- 沃達豐漫遊服務
- 研究方法
- 限制和解釋
數據和預測
第一章市場預測及要點
- 行動漫遊預測:簡介
- 入站漫遊連接
- 入境漫遊收入
- 出境漫遊用戶
- 出境零售漫遊收入
- 批發漫遊消費者語音、簡訊、數據使用
- 資料漫遊預測方法
- 語音漫遊預測法
- 簡訊漫遊預測方法
- 入境行動用戶
- 入境漫遊用戶:簡訊收入
- 入境漫遊用戶:語音收入
- 入境漫遊用戶:數據收入
第三章 物聯網批發漫遊
- 批發漫遊:物聯網設備與感測器
- 預測方法與假設
- 入站漫遊物聯網連線數
- 物聯網批發漫遊總收入
- 語音、簡訊與數據零售漫遊預測:簡介
- 預測方法
- 出站簡訊漫遊收入
- 出站語音漫遊收入
- 出境數據漫遊收入
第五章 4G零售漫遊
- 預測與研究方法
- 預測方法與假設
- 出境 4G 漫遊用戶總數
- 出站 4G 語音、簡訊和數據漫遊總收入
第六章 5G零售漫遊
- 預測與研究方法
- 預測方法與假設
- 出境 5G 漫遊用戶總數
- 出站 5G 語音、簡訊和數據漫遊總收入
第 7 章:消費性設備
- 預測與研究方法
- 預測動作法律和先決條件
- 總漫遊收入
第八章 郵輪漫遊
- 預測與研究方法
- 預測方法與假設
- 郵輪漫遊總收入
'Global Wholesale Roaming Revenue to Double by 2028'
| KEY STATISTICS | |
|---|---|
| Total retail roaming revenue in 2025: | 13.4bn |
| Total retail roaming revenue in 2029: | 20.9bn |
| 2025 to 2029 retail roaming revenue increase: | 56% |
| Forecast period: | 2024-2029 |
Overview
Our "Mobile Roaming" research suite provides a detailed and insightful analysis of a market set for significant change over the next five years. It enables stakeholders, from mobile roaming vendors and mobile operators, to better understand how both the wholesale and retail roaming markets will evolve, assessing the extent to which travel eSIMs, 5G roaming and Internet of Things (IoT) device roaming will impact the market.
The mobile roaming market suite includes several different options that can be purchased separately, including data mapping of the traffic and future revenue potential of mobile roaming. Additionally, it includes an insightful study uncovering key trends and future opportunities within the market, as well as an extensive analysis of 23 leading vendors in the mobile roaming space. The coverage can also be purchased as a full research suite, which contains all these elements and includes a substantial discount.
Collectively, they provide a critical tool for understanding this ever-changing market, allowing mobile roaming vendors and operators to capitalise on trends and shape their future strategy. This research suite's unparalleled coverage makes it an incredibly useful resource for projecting the future of such an unpredictable market.
Key Features
- Market Dynamics: Insights into key trends and market opportunities resulting from changes within the mobile roaming market. This research addresses key growth opportunities for mobile roaming vendors and mobile operators, including 5G roaming, IoT roaming and travel eSIM adoption. This research then considers challenges posed by legacy network sunsetting and fraudulent activity, providing recommendations for how these must be navigated. Moreover, it includes a regional market growth rate analysis on the current development and future growth of mobile roaming across 60 key countries, identifying key focus markets.
- Key Takeaways & Strategic Recommendations: In-depth analysis of key development opportunities and findings within the mobile roaming market, accompanied by key strategic recommendations for mobile roaming vendors and mobile operators.
- Benchmark Industry Forecasts: Five-year forecast databases are provided for wholesale and retail roaming, providing user, traffic and revenue splits for each sector. These sector splits include consumer wholesale roaming, IoT wholesale roaming, 4G smartphone roaming, 5G smartphone roaming, roaming devices and cruise roaming.
- Juniper Research Competitor Leaderboard: Key player capability and capacity assessment for 23 mobile roaming vendors via the Juniper Research Competitor Leaderboard; scoring these vendors on criteria such as market performance, revenue and future business prospects.
SAMPLE VIEW
Market Data & Forecasting Report
The numbers tell you what's happening, but our written report details why, alongside the methodologies.
Market Trends & Strategies Report
A comprehensive analysis of the current market landscape, alongside strategic recommendations.
Market Data & Forecasting Report
The market-leading research suite for the Mobile Roaming market includes access to a comprehensive five-year forecast dataset comprising 106 tables and over 48,300 datapoints. Metrics in the research suite include:
- Total Wholesale Roaming Traffic
- Total Wholesale Roaming Revenue
- Total Retail Roaming Traffic
- Total Retail Roaming Revenue
These metrics are provided for the following key market verticals:
- Consumer Wholesale Roaming
- IoT Wholesale Roaming
- 4G Retail Roaming
- 5G Retail Roaming
- Retail Consumer Device Roaming
- Cruise Roaming
Juniper Research Interactive Forecast Excel contains the following functionality:
- Statistics Analysis: Users benefit from the ability to search for specific metrics, displayed for all regions and countries across the data period. Graphs are easily modified and can be exported to the clipboard.
- Country Data Tool: This tool lets users look at metrics for all regions and countries in the forecast period. Users can refine the metrics displayed via a search bar.
- Country Comparison Tool: Users can select and compare specific countries. The ability to export graphs is included in this tool.
- What-if Analysis: Here, users can compare forecast metrics against their own assumptions via five interactive scenarios.
Market Trends & Strategies Report
This trends analysis report examines the mobile roaming market landscape in detail; assessing market trends and factors shaping the evolution of this rapidly changing market. The essential strategy report delivers a comprehensive analysis of the strategic opportunities for mobile roaming providers; addressing key verticals, developing market challenges, and how stakeholders must navigate these. It also includes an evaluation of the key country-level opportunities for mobile roaming growth, with the Country Readiness Index.
Competitor Leaderboard Report
The Competitor Leaderboard report provides a detailed evaluation and market positioning for 23 leading vendors in the mobile roaming space. The vendors are positioned as established leaders, leading challengers, or disruptors and challengers, based on capacity and capability assessments:
|
|
This competitive analysis document is centred around the Juniper Research Competitor Leaderboard, a vendor positioning tool that provides an at-a-glance view of the competitive landscape in a market; backed by a robust methodology.
Table of Contents
Market Trends & Strategies
1. Key Takeaways & Strategic Recommendations
- 1.1. Key Takeaways and Strategic Recommendations
2. Future Market Outlook - Wholesale Roaming
- 2.1. Introduction to Wholesale Roaming
- Figure 2.1: Mobile Roaming Structure
- Figure 2.2: Total Wholesale Roaming Revenue ($m), Split by 8 Key Regions, 2024-2029
- 2.2. 2G and 3G Sunsetting
- i. VoLTE Roaming
- 2.3. 5G Roaming
- i. Network Slicing
- ii. Infrastructure Sharing
- iii. Bundled Services
- iv. VoLTE as 5G SA Fallback
- v. 5G Roaming Security
- 2.4. 6G Roaming
- 2.5. Cloud-based Roaming Services
- 2.6. Travel eSIMs
- 2.7. Evolution of Billing and Charging Evolution (BCE)
- Figure 2.3: Data Flow in BCE Process
- Figure 2.4: High-level Reporting Exchange Flow
- 2.8. APIs
- 2.9. IoT Roaming Devices
- Figure 2.5: Total Number of IoT Connections that are Roaming (m), Split by 8 Key Regions, 2024-2029
- Figure 2.6: Total IoT Wholesale Roaming Revenue
- Figure 2.7: IoT Use Cases
- 2.10. Fraudulent Roaming Activity
3. Future Market Outlook - Retail Roaming
- 3.1. Introduction to Retail Roaming
- Figure 3.1: Total Retail Roaming Revenue Split by 8 Key Regions, 2024
- 3.2. Travel SIMs and Travel eSIMs
- Figure 3.2: Total Roaming Spend Lost to Travel SIMs/eSIMs ($m), Split by 8 Key Regions, 2023-2028
- 3.2.1. Travel SIMs
- 3.2.2. Travel eSIMs
- Figure 3.3: Total Number of Smartphones that have eSIMs (m), Split by 8 Key Regions, 2024-2026
- 3.3. Regulatory
- 3.4. Cloud-based Roaming Services
- 3.5. 5G and 6G Roaming
- 3.6. Consumer Device Roaming
- 3.7. Cruise and In-flight Roaming
- 3.7.1. Cruise Roaming
- Figure 3.4: Infographic Showing the Process of Cruise Roaming
- Figure 3.5: Total Cruise Roaming Revenue ($m), Split by 8 Key Regions, 2024-2029
- 3.7.2. In-flight Roaming
- 3.7.1. Cruise Roaming
4. Country Readiness Index
- 4.1. Introduction to Country Readiness Index
- Figure 4.1: Mobile Roaming Country Readiness Index Regional Definitions
- Table 4.2: Juniper Research Country Readiness Index Scoring Criteria: Mobile Roaming
- Figure 4.3: Juniper Research Country Readiness Index: Mobile Roaming
- Table 4.4: Mobile Roaming Country Readiness Index: Market Segments
- 4.2. Focus Markets
- Figure 4.5: Total Retail Roaming Revenue ($m), Split by 20 Focus Markets, 2024
- 4.2.1. RLAH
- Figure 4.6: Total Active Outbound Mobile Roaming Subscribers (m), Split by Focus Markets in West Europe, 2024
- 4.2.2. The GCC
- Figure 4.7: Total Retail Roaming Revenue ($m), Split by Saudi Arabia and United Arab Emirates, 2024-2029
- 4.2.3. The Nordic Roaming Initiative
- Figure 4.8: Total Retail Roaming Revenue ($m), Split by Sweden, Denmark and Norway, 2024-2029
- 4.2.4. North America
- Figure 4.9: Total Outbound Travellers (m), Split by US and Canada, 2024-2029
- 4.2.5. Far East & Asia
- 4.3. Growth Markets
- 4.3.1. India
- Figure 4.10: GDP per Capita ($), 2024-2029, India
- 4.3.2. Belgium
- 4.3.1. India
- 4.4. Saturated Markets
- 4.5. Developing Markets
- Figure 4.11: Total Retail Roaming Revenue ($m), Split by Developing Markets, 2024
- 4.5.1. Roaming Initiatives in Africa
- 4.5.2. Roaming Initiatives in Latin America
- Table 4.12: Juniper Research's Country Readiness Index Heatmap: North America
- Table 4.13: Juniper Research's Country Readiness Index Heatmap: Latin America
- Table 4.14: Juniper Research's Country Readiness Index Heatmap: West Europe
- Table 4.15: Juniper Research's Country Readiness Index Heatmap: Central & East Europe
- Table 4.16: Juniper Research's Country Readiness Index Heatmap: Far East & China
- Table 4.17: Juniper Research's Country Readiness Index Heatmap: Indian Subcontinent
- Table 4.18: Juniper Research's Country Readiness Index Heatmap: Rest of Asia Pacific
- Table 4.19: Juniper Research's Country Readiness Index Heatmap: Africa & Middle East
Competitor Leaderboard
1. Juniper Research Competitor Leaderboard
- 1.1. Why Read This Report
- Mobile Operators Must Embrace Travel eSIMs as a New Revenue Opportunity, Rather Than View as a Threat
- 5G and VoLTE Roaming to Accelerate 2G and 3G Roaming Network Sunsetting
- Table 1.1: Juniper Research Competitor Leaderboard: Vendors & Product Portfolio (1 of 2)
- Table 1.2: Juniper Research Competitor Leaderboard: Vendors & Product Portfolio (2 of 2)
- Figure 1.3: Juniper Research Competitor Leaderboard: Mobile Roaming
- Table 1.4: Juniper Research Competitor Leaderboard: Vendors
- Table 1.5: Juniper Research Competitor Leaderboard Heatmap: Mobile Roaming Vendors (1 of 2)
- Table 1.6: Juniper Research Competitor Leaderboard Heatmap: Mobile Roaming Vendors (2 of 2)
2. Vendor Profiles
- 2.1. Mobile Roaming Vendor Profiles
- 2.1.1. A1 Telekom Austria Group
- i. Corporate Information
- Figure 2.1: A1 Group Select Financial Information, 2021-2023
- ii. Geographical Spread
- iii. Key Clients & Strategic Partnerships
- iv. High-level View of Offerings
- v. Juniper Research's View: Key Strengths & Strategic Opportunities
- i. Corporate Information
- 2.1.2. Amplitiv
- i. Corporate Information
- ii. Geographical Spread
- iii. Key Clients & Strategic Partnerships
- iv. High-level View of Offerings
- v. Juniper Research's View: Key Strengths & Strategic Opportunities
- 2.1.3. BICS
- i. Corporate Information
- Table 2.2: BICS' Select Financial Information (Euro-m), 2022 & 2023
- ii. Geographical Spread
- iii. Key Clients & Strategic Partnerships
- iv. High-level View of Offerings
- v. Juniper Research's View: Key Strengths & Strategic Opportunities
- i. Corporate Information
- 2.1.4. BroadForward
- i. Corporate Information
- ii. Geographical Spread
- iii. Key Clients & Strategic Partnerships
- iv. High-level View of Offerings
- Figure 2.3: BroadForward's SEPP
- v. Juniper Research's View: Key Strengths & Strategic Opportunities
- 2.1.5. Cellusys
- i. Corporate Information
- Figure 2.4: Cellusys Portfolio
- ii. Geographical Spread
- iii. Key Clients & Strategic Partnerships
- iv. High-level View of Offerings
- Figure 2.5: Cellusys Roaming Platform
- v. Juniper Research's View: Key Strengths & Strategic Opportunities
- i. Corporate Information
- 2.1.6. Comfone
- i. Corporate Information
- ii. Geographical Spread
- iii. Key Clients & Strategic Partnerships
- iv. High-level View of Offerings
- Figure 2.6: Comfone's Portfolio
- v. Juniper Research's View: Key Strengths & Strategic Opportunities
- 2.1.7. CSG
- i. Corporate Information
- Table 2.7: CSG's Select Financial Information ($m), 2021-2023
- Table 2.8: CSG's Acquisitions
- ii. Geographical Spread
- iii. Key Clients & Strategic Partnerships
- iv. High-level View of Offerings
- v. Juniper Research's View: Key Strengths & Strategic Opportunities
- i. Corporate Information
- 2.1.8. Deutsche Telekom Global Carrier
- i. Corporate Information
- ii. Geographical Spread
- iii. Key Clients & Strategic Partnerships
- iv. High-level View of Offerings
- v. Juniper Research's View: Key Strengths & Strategic Opportunities
- 2.1.9. Etisalat
- i. Corporate Information
- ii. Geographical Spread
- iii. Key Clients & Strategic Partnerships
- iv. High-level View of Offerings
- v. Juniper Research's View: Key Strengths & Strategic Opportunities
- 2.1.10. iBASIS
- i. Corporate Information
- ii. Geographical Spread
- Figure 2.9: iBASIS' Global Customer Connections
- iii. Key Clients & Strategic Partnerships
- iv. High-level View of Offerings
- v. Juniper Research's View: Key Strengths & Strategic Opportunities
- 2.1.11. Mobileum
- i. Corporate Information
- ii. Geographical Spread
- iii. Key Clients & Strategic Partnerships
- iv. High-level View of Offerings
- Figure 2.10: Mobileum's Roaming Management Suite
- v. Juniper Research's View: Key Strengths & Strategic Opportunities
- 2.1.12. Nextgen Clearing
- i. Corporate Information
- ii. Geographical Spread
- iii. Key Clients & Strategic Partnerships
- iv. High-level View of Offerings
- v. Juniper Research's View: Key Strengths & Strategic Opportunities
- 2.1.13. Orange Wholesale
- i. Corporate Information
- ii. Geographical Spread
- Figure 2.11: Orange Operations Map
- iii. Key Clients & Strategic Partnerships
- iv. High-level View of Offerings
- v. Juniper Research's View: Key Strengths & Strategic Opportunities
- 2.1.14. Roamability
- i. Corporate Information
- ii. Geographical Spread
- iii. Key Clients & Strategic Partnerships
- iv. High-level View of Offerings
- Figure 2.12: Roamability's DMI Solution Snapshot
- v. Juniper Research's View: Key Strengths & Strategic Opportunities
- 2.1.15. Syniverse
- i. Corporate Information
- ii. Geographical Spread
- iii. Key Clients & Strategic Partnerships
- iv. High-level View of Offering
- Figure 2.13: Syniverse's Clearing and Settlement Services
- v. Juniper Research's View: Key Strengths & Strategic Opportunities
- 2.1.16. Tata Communications
- i. Corporate Information
- ii. Geographical Spread
- iii. Key Clients & Strategic Partnerships
- iv. High-level View of Offerings
- v. Juniper Research's View: Key Strengths & Strategic Opportunities
- 2.1.17. Tele2 International Wholesale
- i. Corporate Information
- ii. Geographical Spread
- iii. Key Clients & Strategic Partnerships
- iv. High-level View of Offerings
- v. Juniper Research's View: Key Strengths & Strategic Opportunities
- 2.1.18. Telefonica Global Solutions
- i. Corporate Information
- Figure 2.14: Telefonica's Select Financial Information (Euro-m), 2020-2022
- ii. Geographical Spread
- iii. Key Clients & Strategic Partnerships
- iv. High-level View of Offerings
- Figure 2.15: Telefonica's 5G Roaming Suite
- v. Juniper Research's View: Key Strengths & Strategic Opportunities
- i. Corporate Information
- 2.1.19. Telenor Linx
- i. Corporate Information
- ii. Geographical Spread
- iii. Key Clients & Strategic Partnerships
- iv. High-level View of Offerings
- v. Juniper Research's View: Key Strengths & Strategic Opportunities
- 2.1.20. Telna
- i. Corporate Information
- ii. Geographical Spread
- iii. Key Clients & Strategic Partnerships
- iv. High-level View of Offerings
- v. Juniper Research's View: Key Strengths & Strategic Opportunities
- 2.1.21. TNS
- i. Corporate Information
- ii. Geographical Spread
- iii. Key Clients & Strategic Partnerships
- iv. High-level View of Offerings
- v. Juniper Research's View: Key Strengths & Strategic Opportunities
- 2.1.22. TOMIA
- i. Corporate Information
- ii. Geographical Spread
- iii. Key Clients & Strategic Partnerships
- iv. High-level View of Offerings
- v. Juniper Research's View: Key Strengths & Strategic Opportunities
- 2.1.23. Vodafone Roaming Services
- i. Corporate Information
- ii. Geographical Spread
- iii. Key Clients & Strategic Partnerships
- iv. High-level View of Offerings
- Table 2.16: Vodafone's Global Signalling & IPX Connectivity
- v. Juniper Research's View: Key Strengths & Strategic Opportunities
- 2.1.1. A1 Telekom Austria Group
- 2.2. Juniper Research Leaderboard Methodology
- 2.3. Limitations & Interpretations
- Table 2.17: Juniper Research Competitor Leaderboard Scoring Criteria: Mobile Roaming Vendors
Data & Forecasting
1. Market Forecast & Key Takeaways
- 1.1. Introduction to Mobile Roaming Forecasts
- Figure 1.1: Total Outbound Travellers (m), Split by 8 Key Regions, 2024-2029
- 1.1.1. Total Inbound Roaming Connections
- Figure & Table 1.2: Total Inbound Roaming Connections (m), Split by 8 Key Regions, 2024-2029
- 1.1.2. Total Inbound Roaming Revenue
- Figure & Table 1.3: Total Inbound Roaming Revenue ($m), Split by 8 Key Regions, 2024-2029
- Table 1.4: Total Inbound Roaming Revenue ($m), Split by Consumer and IoT, 2024-2029
- 1.1.3. Total Outbound Roaming Subscribers
- Figure & Table 1.5: Total Outbound Roaming Subscribers (m), Split by 8 Key Regions, 2024-2029
- 1.1.4. Total Outbound Retail Roaming Revenue
- Figure & Table 1.6: Total Outbound Retail Roaming Revenue ($m), Split by 8 Key Regions, 2024-2029
2. Wholesale Roaming Consumer Voice, SMS and Data Forecasts
- 2.1. Wholesale Roaming Consumer Voice, SMS and Data Usage
- Figure 2.1: Total Wholesale Roaming Revenue ($m), Split by SMS, Voice and Data Roaming, 2024
- 2.1.1. Data Roaming Forecast Methodology
- 2.1.2. Voice Roaming Forecast Methodology
- 2.1.3. SMS Roaming Forecast Methodology
- Figure 2.2: Consumer Wholesale Roaming Forecast Methodology
- 2.1.4. Total Inbound Mobile Subscribers
- Figure & Table 2.3: Total Inbound Mobile Subscribers (m), Split by 8 Key Regions, 2024-2029
- 2.1.5. Inbound Roaming Subscribers: SMS Revenue
- Figure & Table 2.4: Total Inbound SMS Roaming Revenue ($m), Split by 8 Key Regions, 2024-2029
- 2.1.6. Inbound Roaming Subscribers: Voice Revenue
- Figure & Table 2.5: Total Inbound Voice Roaming Revenue ($m), Split by 8 Key Regions, 2024-2029
- 2.1.7. Inbound Roaming Subscribers: Data Revenue
- Figure & Table 2.6: Total Inbound Data Roaming Revenue ($m), Split by 8 Key Regions, 2024-2029
3. IoT Wholesale Roaming
- 3.1. Wholesale Roaming - IoT Devices and Sensors
- Figure 3.1: Total Cellular IoT Connections (m), Split by 8 Key Regions, 2024-2029
- 3.1.1. Forecast Methodology & Assumptions
- Figure 3.2: IoT Wholesale Roaming Forecast Methodology
- 3.1.2. Total Inbound Roaming IoT Connections
- Figure & Table 3.3: Total Inbound Roaming Cellular IoT Connections (m), Split 8 Key Regions, 2024-2029
- 3.1.3. Total IoT Wholesale Roaming Revenue
- Figure & Table 3.4: Total Inbound Data Roaming Revenue from Cellular IoT Connections ($m), Split by 8 Key Regions, 2024-2029
4. Retail Voice, SMS and Data Roaming Forecasts
- 4.1. Introduction to Voice, SMS and Data Retail Roaming Forecasts
- Figure 4.1: Total Retail Roaming Revenue ($m), Split by Data, Voice, and SMS, 2024
- 4.1.1. Data Roaming Forecast Methodology
- 4.1.2. Voice Roaming Forecast Methodology
- 4.1.3. SMS Roaming Forecast Methodology
- Figure 4.2: Retail Roaming (Data, SMS, and Voice) Forecast Methodology
- 4.1.4. Outbound SMS Roaming Revenue
- Figure & Table 4.3: Total Outbound SMS Roaming Revenue ($m), Split by 8 Key Regions, 2024-2029
- 4.1.5. Outbound Voice Roaming Revenue
- Figure & Table 4.4: Total Outbound Voice Roaming Revenue ($m), Split by 8 Key Regions, 2024-2029
- 4.1.6. Outbound Data Roaming Revenue
- Figure & Table 4.5: Total Outbound Data Roaming Revenue ($m), Split by 8 Key Regions, 2024-2029
5. 4G Retail Roaming
- 5.1. 4G Roaming Forecast Methodology
- 5.1.1. Forecast Methodology & Assumptions
- Figure 5.1: 4G Retail Roaming Forecast Methodology
- 5.1.2. Total Outbound 4G Roaming Subscribers
- Figure & Table 5.2: Total Outbound 4G Roaming Subscribers (m), Split by 8 Key Regions, 2024-2029
- 5.1.3. Total Outbound 4G Voice, SMS & Data Roaming Revenue
- Figure & Table 5.3: Total Outbound 4G Voice, SMS & Data Roaming Revenue ($m), Split by 8 Key Regions, 2024-2029
- 5.1.1. Forecast Methodology & Assumptions
6. 5G Retail Roaming
- 6.1. 5G Roaming Forecast Methodology
- 6.1.1. Forecast Methodology & Assumptions
- Figure 6.1: 5G Retail Roaming Forecast Methodology
- 6.1.2. Total Outbound 5G Roaming Subscribers
- Figure & Table 6.2: Total Outbound 5G Roaming Subscribers (m), Split by 8 Key Regions, 2024-2029
- 6.1.3. Total Outbound 5G Voice, SMS & Data Roaming Revenue
- Figure & Table 6.3: Total Outbound 5G Voice, SMS & Data Roaming Revenue ($m), Split by 8 Key Regions, 2024-2029
- 6.1.1. Forecast Methodology & Assumptions
7. Consumer Devices
- 7.1. Consumer Device Forecast Methodology
- 7.1.1. Forecast Methodology & Assumptions
- Figure 7.1: Consumer Device Forecast Methodology
- 7.1.2. Total Roaming Revenue from Roaming Devices
- Figure & Table 7.2: Total Roaming Revenue from Roaming Devices ($m), Split by 8 Key Regions, 2024-2029
- 7.1.1. Forecast Methodology & Assumptions
8. Cruise Roaming
- 8.1. Cruise Roaming Forecast & Methodology
- 8.1.1. Forecast Methodology & Assumptions
- Figure 8.1: Cruise Roaming Forecast Methodology
- 8.1.2. Total Cruise Roaming Revenue
- Figure & Table 8.2: Total Cruise Roaming Revenue ($m), Split by 8 Key Regions, 2024-2029
- 8.1.1. Forecast Methodology & Assumptions
 漫遊收費市場:按服務、漫遊類型、分銷管道分類 - 全球預測 2025-2030 年
 2024 年漫遊費全球市場報告2024 年資料漫遊世界市場報告
 全球零售漫遊市場:2024-2028
 全球未經授權漫遊市場:2023-2028