


 |
市場調查報告書
商品編碼
1680889
國際romingukorido市場:2020-2029年International Roaming Corridors Market: 2020-2029 |
||||||
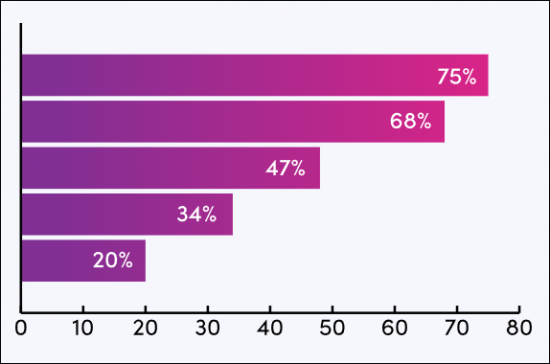
Juniper Research 確定了 2025 年出境漫遊用戶最多的 5 個國家
| 主要統計 | |
|---|---|
| 調查對象romingukorido | 312 |
| 數據點 | 80,000以上 |
| 調查期間 | 2020-2024年 |
| 預測期間 | 2025-2029年 |
概要
研究套件為營運商和漫遊供應商提供了對全球 12 個最大國家的出站和入站漫遊市場的無與倫比的洞察。它提供了 2020 年 1 月至 2029 年 12 月 300 多個漫遊走廊的逐月細分,以幫助您改善業務策略和決策。
本報告及資料集中包含的國家以下的大街:
|
|
|
該報告包含 12 個國家的入境和出境漫遊用戶的月度數據,包括每個國家的整體數據以及從這 12 個國家到其他國家的具體流動數據。例如,對於從墨西哥到美國的入境漫遊者,除了每月入境漫遊者的總數外,還提供每月的歷史數據和預測。
此外,還提供了市場分析,為資料集中 12 個國家的入境和出境漫遊市場提供分析和建議。這包括對影響新冠疫情復甦的因素(例如旅行限制)以及貨幣升值和經濟成長等其他社會經濟因素的分析。它還包括對未來因素的影響的評估,例如舉辦世界盃等重大賽事,並就營運商如何利用這些市場變化提供建議。
主要特點
- 存取入境流量功能:我們提供了 12 個國家/地區每月入境漫遊的詳細情況,讓您可以識別主要的漫遊走廊,並了解這些入境走廊未來的發展趨勢。
- 取得出站流量:我們將提供您 12 個國家每月出站漫遊的明細數據,讓您識別主要的漫遊走廊,並了解這些走廊未來的發展趨勢。
- 每月數據:允許營運商和漫遊供應商有效地評估和分析每個市場中入站和出站漫遊的歷史和當前變化。
- 歷史數據和預測:豐富的歷史和預測數據可以進行過去的分析和預測決策,幫助營運商和漫遊供應商做出最佳決策。
市場數據與預測
研究套件包括存取全套歷史和預測數據,包含超過 80,000 個數據點。每個國家包含的指標有:
- 來自 12 個國家的每月入境漫遊用戶的百分比
- 來自 12 個國家的每月入境漫遊用戶總數
- 12 個國家每月外出漫遊用戶的百分比
- 每月來自 12 個國家的漫遊用戶總數
樣品view
市場趨勢 (PDF報告)
全面分析當前市場格局,並提供詳細的策略建議和預測
目錄
第1章 romingukorido分析
- 調查手法與前提
- 美國
- 加拿大
- 墨西哥
- 法國
- 德國
- 義大利
- 西班牙
- 英國
- 土耳其
- 中國
- 日本
- 印度
- 入境(進線)漫遊
- 出境(外撥)漫遊
'Juniper Research Reveals Top 5 Countries for Outbound Roamers in 2025'
| KEY STATISTICS | |
|---|---|
| Roaming corridors assessed: | 312 |
| Datapoints: | Over 80,000 |
| Historical data period: | 2020-2024 |
| Forecast period: | 2025-2029 |
Overview
Our "Roaming Corridors 2020-2029" research suite provides operators and roaming vendors with unequalled insight into 12 of the largest outbound and inbound roaming markets in the world. The data included allows for improved business strategies and decision-making, with month-by-month breakdowns for more than 300 roaming corridors from January 2020 to December 2029.
The countries included in the report and dataset are:
|
|
|
The report includes month-by-month data for both inbound and outbound roamers for each of the 12 countries; with this data provided for each country as a whole, as well as for specific travel from one of the 12 countries to another. For example, month-by-month historical data and forecasts are provided for inbound roamers to the US from Mexico, in addition to the total number of inbound roamers to the US each month.
Also provided is a market trend and analysis document, which provides analysis and recommendations for inbound and outbound roaming markets for each of the 12 countries listed in the dataset. This includes analysis of the factors which have affected each market's recovery from the COVID-19 pandemic, such as travel restrictions, as well as other socio-economic factors, such as currency strengths and economic growth. Assessments of the impact of future factors, such as the hosting of major events such as the World Cup, are also included, as well as recommendations for how operators can capitalise on the changes to these markets.
Key Features
- Ability to Access Inbound Traffic - Month-by-month breakdowns are provided for inbound roaming for each of the 12 countries; allowing for the identification of key roaming corridors and how these inbound corridors will evolve in the future.
- Ability to Assess Outbound Traffic - Month-by-month breakdowns are provided for outbound roaming from each of the 12 countries; allowing for the identification of key roaming corridors and how these corridors will evolve in the future.
- Monthly Data - Month-by-month data enables operators and roaming vendors to effectively evaluate and analyse past and present changes to inbound and outbound roaming for each market.
- Historical Data and Forecast - The extensive historical and forecasted data allows for historical analysis and predictive decision making; enabling operators and roaming vendors to make the best possible decisions, moving forward.
Market Data & Forecasts
The market-leading Roaming Corridors research suite includes access to a full set of historical and forecast data; comprising over 80,0000 data points. The metrics included for each country are:
- Proportion of Monthly Inbound Roamers, with Splits for 12 Countries
- Total Number of Monthly Inbound Roamers, with Splits for 12 Countries
- Proportion of Monthly Outbound Roamers, with Splits for 12 Countries
- Total Number of Monthly Outbound Roamers, with Splits for 12 Countries
SAMPLE VIEW
Market Trends & Forecasts PDF Report
A comprehensive analysis of the current market landscape, alongside strategic recommendations and a walk-through of the forecasts.
Table of Contents
1. Roaming Corridor Analysis
- 1.1. Introduction
- Figure 1.1: Total Number of Inbound Mobile Roamers Year End (m), Split by 8 Key Regions, 2020-2029
- 1.2. Methodology and Assumptions
- 1.3. The US
- 1.3.1. Inbound Roaming to the US
- Figure 1.2: Total Number of Inbound Roamers to the US in 2029 (m), Split by Month
- 1.3.2. Outbound Roaming from the US
- Figure 1.3: Total Number of Outbound Roamers from the US (m), 2020-2028
- 1.3.1. Inbound Roaming to the US
- 1.4. Canada
- 1.4.1. Inbound Roaming to Canada
- Figure 1.4: Total Number of Inbound Roamers to Canada in 2025 (m), Split by Month
- 1.4.2. Outbound Roaming from Canada
- Figure 1.5: Proportion of Monthly Outbound Roamers from Canada in 2025 (%), Split by Select Countries
- 1.4.1. Inbound Roaming to Canada
- 1.5. Mexico
- 1.5.1. Inbound Roaming to Mexico
- Figure 1.6: Proportion of Monthly Inbound Roamers to Mexico in 2025 (%), Split by Select Countries
- 1.5.2. Outbound Roaming from Mexico
- Figure 1.7: Total Number of Outbound Roamers from Mexico in 2025 (m), Split by Month
- 1.5.1. Inbound Roaming to Mexico
- 1.6. France
- 1.6.1. Inbound Roaming to France
- Figure 1.8: Total Number of Inbound Roamers to France in 2025 (m), Split by Month
- 1.6.2. Outbound Roaming from France
- Figure 1.9: Proportion of Outbound Roamers From France in 2029 (%), Split by Select Countries
- 1.6.1. Inbound Roaming to France
- 1.7. Germany
- 1.7.1. Inbound Roaming to Germany
- Figure 1.10: Total Number of Inbound Roamers to Germany in 2025 (m), Split by Month
- 1.7.2. Outbound Roaming from Germany
- Figure 1.11: Proportion of Outbound Roamers from Germany in 2029 (%), Split by Select Destinations
- 1.7.1. Inbound Roaming to Germany
- 1.8. Italy
- 1.8.1. Inbound Roaming to Italy
- Figure 1.12: Proportion of Monthly Inbound Roamers to Italy in 2025 (%), Split by Select Countries
- 1.8.2. Outbound Roaming from Italy
- Figure 1.13: Total Number of Outbound Roamers From Italy in 2025 (m), Split by Month
- 1.8.1. Inbound Roaming to Italy
- 1.9. Spain
- 1.9.1. Inbound Roaming to Spain
- Figure 1.14: Total Number of Inbound Roamers to Spain in 2029 (m), Split by Month
- 1.9.2. Outbound Roaming from Spain
- Figure 1.15: Total Number of Outbound Roamers from Spain in 2025 (m), Split by Month
- 1.9.1. Inbound Roaming to Spain
- 1.10. The UK
- 1.10.1. Inbound Roaming to the UK
- Figure 1.16: Total Number of Inbound Roamers to the UK in 2025 (m), Split by Month
- 1.10.2. Outbound Roaming from the UK
- Figure 1.17: Proportion of Outbound Roamers From the UK in 2025 (%), Split by Select Countries
- 1.10.1. Inbound Roaming to the UK
- 1.11. Turkey
- 1.11.1. Inbound Roaming to Turkey
- Figure 1.18: Total Number of Inbound Roamers to Turkey in 2029 (m), Split by Month
- 1.11.2. Outbound Roaming from Turkey
- Figure 1.19: Total Number of Outbound Roamers From Turkey in 2025 (m), Split by Month
- 1.11.1. Inbound Roaming to Turkey
- 1.12. China
- 1.12.1. Inbound Roaming to China
- Figure 1.20: Total Number of Inbound Roamers to China in 2025 (m), Split by Month
- 1.12.2. Outbound Roaming from China
- Figure 1.21: Total Number of Outbound Roamers from China in 2029 (m), Split by Month
- 1.12.1. Inbound Roaming to China
- 1.13. Japan
- 1.13.1. Inbound Roaming to Japan
- Figure 1.22: Total Number of Inbound Roamers to Japan in 2025 (m), Split by Month
- 1.13.2. Outbound Roaming from Japan
- Figure 1.23: Total Number of Outbound Roamers from Japan in 2025 (m), Split by Month
- 1.13.1. Inbound Roaming to Japan
- 1.14. India
- 1.14.1. Inbound Roaming to India
- Figure 1.24: Total Number of Inbound Roamers to India in 2025 (m), Split by Month
- 1.14.2. Outbound Roaming from India
- Figure 1.25: Proportion of Outbound Roamers from India in 2029 (%), Split by Select Countries
- 1.14.1. Inbound Roaming to India
 日本物聯網市場預測:2024-2032
 Geo IoT的技術·解決方案·用途·服務:2025~2030年
 物聯網市場預測:連結數、收入和技術趨勢(2024-2032)
 物聯網現況:2025年春季
 2025 年全球物聯網解決方案與服務市場報告
 不斷發展的物聯網格局:穩定性、轉變和多樣化路徑
 SPS Fair 2024:工業自動化最新趨勢
 物聯網市場:2033 年市場分析與預測 - 按類型、產品、服務、技術、組件、應用、最終用戶、設備、部署、解決方案
 產品開發中的物聯網 - 全球市場分析和預測(至 2033 年):類型、產品、服務、技術、組件、應用、部署、最終用戶和流程
 企業物聯網市場規模、佔有率和成長分析(按產品供應、性別、企業類型、應用、最終用途和地區)—2025-2032 年產業預測