


 |
市場調查報告書
商品編碼
1686672
交易監測系統的全球市場:2025-2029年Global Trade Surveillance Systems Market: 2025-2029 |
||||||
"法規強化中,交易監測系統的支出額2029年預計達到49億美元"
| 主要統計 | |
|---|---|
| 2025年的總支出額 | 27億美元 |
| 2029年的總支出額 | 49億美元 |
| 2025~2029年的市場成長率 | 85% |
| 預測期間 | 2025-2029年 |
本研究報告對當前不斷變化的市場格局進行了深入分析。該研究評估了金融市場和合規領域的主要趨勢,並總結了影響合規團隊的主要推動因素和課題,包括合規成本上升、市場波動性和複雜性加劇,以及供應商對人工智慧和其他下一代技術的採用。該報告還將 16 家供應商列入 Juniper Research 交易監控系統競爭排行榜,評估他們的產品並根據能力進行定位。本報告將成為了解貿易監控市場的重要工具,並將有助於貿易監控領域的供應商制定未來策略。
研究也為以下細分市場、八個主要地區和 61 個國家的市場提供了行業基準預測:
- 大金融機關 (世界規模的銀行及大證券會社)
- 中堅金融機關 (地區規模的銀行及資產運用公司)
- 小規模金融機關 (螺釘豬肉交易公司及個人仲介)
- 其他 (交易所,法規機關)
主要的特徵
- 市場動態:深入了解貿易監控系統市場的主要趨勢和市場課題,包括應對新法規帶來的課題、增加跨市場和跨平台監控的需求,以及減輕合規團隊的負擔。它還評估了當前的金融犯罪形勢,強調了貿易監控系統應重點檢測的市場濫用的關鍵領域。此外,該報告還包括細分分析,將市場分為大型、中型和小型金融機構,以及使用交易監控系統的其他企業,如交易所和監管機構。
- 關鍵要點和策略建議:深入分析交易監控系統市場中的關鍵發展機會和見解,並向包括交易監控技術領導者在內的利害關係人提供策略建議。
- 基準產業預測:按產業垂直和業務規模劃分的使用第三方交易監控系統的公司總數以及第三方交易監控系統總支出的綜合數據和預測。
- Juniper Research 競爭排行榜:評估 16 家貿易監控供應商的能力,並為貿易監控領域的主要參與者提供市場規模資訊。
市場資料·預測
研究套件包括一整套預測數據,其中包含 37 個表格和超過 13,500 個數據點。該調查套件包括以下指標:
- 使用第三方交易監控系統的公司總數
- 第三方交易監控系統的總支出
為以下公司提供指標:
- 大型金融機構(全球銀行及大型證券公司)
- 中型金融機構(區域銀行與資產管理公司)
- 小型金融機構(客製化交易公司和私人經紀商)
- 其他(交易所、交易所、監管機構)
Juniper Research Interactive Forecast (Excel) 包含以下功能:
- 統計分析:顯示資料期間內所有地區和國家的數據,並允許您搜尋特定指標。可以輕鬆修改圖表並將其匯出到剪貼簿。
- 國家資料工具:您可以查看預測期間內所有地區和國家的指標。您可以使用搜尋欄縮小顯示的指標範圍。
- 國家比較工具:您可以選擇國家進行比較。該工具包括圖形導出功能。
樣品view
市場趨勢PDF報告
全面分析當前市場格局,並提供詳細的策略建議和預測
目錄
第1章 重要點和策略性推薦事項
- 重要點
- 策略性推薦事項
第2章 交易監測系統市場:摘要
- 簡介
- 交易監測系統的過程
- 目前形勢
- 法規情形
- The Markets in Financial Instruments Directive II (MiFID II)
- The European Union Market Abuse Regulation (EU MAR)
- The UK Market Abuse Regulation (UK MAR)
- Dodd-Frank Wall Street Reform and Consumer Protection Act (Dodd-Frank Act)
- Rule 15c3-5
- New Algorithm Trading Rules
- The Financial Instruments and Exchange Act (FIEA)
- The Monetary Authority of Singapore (MAS)
- 金融犯罪的potoreito
- 市場濫用的類型
- 價格操作
- 循環交易
- 內部資訊的濫用
- 交易為基礎的洗錢 (TBML)
- 價格的影響
- 不合適的定購處理
- 導致誤解的行為
- 市場濫用的類型
- 促進因素
- 法規壓力
- 技術創新
- 市場複雜
- 資料管治
- 課題
- 誤偵測
- 對遵守隊的壓力
- 十字產品監視
第3章 市場區隔分析
- 市場區隔分析
- 大金融機關
- 中規模金融機關
- 中小規模金融機關
- 其他的事業
第4章 競爭排行榜
- 讀該報告的理由
- 業者簡介
- ACA Group
- Aquis Exchange
- b-next
- eflow Global
- Eventus Systems
- FIS
- Nasdaq
- Nexi Group
- NICE Actimize
- Scila
- Software AG
- SteelEye
- SymphonyAI Sensa
- Trading Technologies
- TradingHub
- Trapets
第5章 資料&預測
- 調查手法與前提
- 交易監測系統市場
- 交易監控系統總支出
- 大型金融機構在第三方交易監控系統上的總支出
- 中型金融機構第三方監控總支出
- 中小型金融機構在第三方交易監控系統上的總支出
- 其他公司在第三方交易監控系統上的總支出
'Trade Surveillance Systems Spend to Reach $4.9 Billion by 2029, Amid Escalating Regulatory Scrutiny'
| KEY STATISTICS | |
|---|---|
| Total spend in 2025: | $2.7bn |
| Total spend in 2029: | $4.9bn |
| Market growth 2025-2029: | 85% |
| Forecast period: | 2025-2029 |
Overview
Our "Trade Surveillance Systems" research report provides in-depth analysis of the state of this evolving market. The research evaluates key trends in the financial markets and compliance sectors, alongside the main drivers and challenges affecting compliance teams; such as the rising cost of compliance, increasing market volatility and complexity, and how vendors are adopting AI and other next-generation technologies. The report also positions 16 vendors across the Juniper Research Competitor Leaderboard for trade surveillance systems; assessed on their products and positioning against their capability and capacity. Collectively, the report provides a critical tool for understanding the trade surveillance systems market; enabling vendors in the trade surveillance systems space to shape their future strategy.
The research also provides industry benchmark forecasts for the market, split by the following segments, as well as by our 8 key regions and 61 countries:
- Large Financial Institutions (Global Banks and Major Brokerages)
- Medium Financial Institutions (Regional Banks and Asset Management Firms)
- Small Financial Institutions (Bespoke Trading Firms and Individual Brokers)
- Other Businesses (Trading & Exchange Venues and Regulatory Bodies)
Key Features
- Market Dynamics: Insights into key trends and market challenges within the trade surveillance systems market; addressing challenges posed by emerging regulations, increased demand for cross-market and cross-platform monitoring, and the reduction of workload on compliance teams. It also evaluates the state of the financial crime landscape; highlighting key areas of market abuse that trade surveillance systems should focus on detecting. The report includes a segment analysis, which has market splits for large, medium, and small financial institutions, and other businesses that use trade surveillance systems; such as trading and exchange venues, and regulatory bodies.
- Key Takeaways & Strategic Recommendations: In-depth analysis of key development opportunities and findings within the trade surveillance systems market, accompanied by strategic recommendations for stakeholders, such as leaders in trade surveillance technology.
- Benchmark Industry Forecasts: A suite of comprehensive data and forecasts highlighting the total number of businesses using third-party trade surveillance systems, and total spend on third-party trade surveillance systems, split by business sector and business size; covering large, medium, and small financial institutions, and other businesses, such as trading venues and regulators.
- Juniper Research Competitor Leaderboard: Key player capability and capacity assessment for 16 trade surveillance systems vendors, via the Juniper Research Competitor Leaderboard, featuring market size for major players in the trade surveillance systems sector.
- ACA Group
- Aquis
- b-next
- eflow
- Eventus Systems
- FIS
- Nasdaq
- Nexi Group
- NICE Actimize
- Scila
- Software AG
- SteelEye
- SymphonyAI
- Trading Technologies
- TradingHub
- Trapets
Market Data & Forecasts
The market-leading research suite for the "Trade Surveillance Systems" market includes access to the full set of forecast data, with 37 tables and over 13,500 datapoints. Metrics in the research suite include:
- Total Number of Businesses Using Third-party Trade Surveillance Systems
- Total Spend on Third-party Trade Surveillance Systems
Metrics are provided for the following businesses:
- Large Financial Institutions (Global Banks and Major Brokerages)
- Medium Financial Institutions (Regional Banks and Asset Management Firms)
- Small Financial Institutions (Bespoke Trading Firms and Individual Brokers)
- Other Businesses (Trading and Exchange Venues, and Regulatory Bodies)
Juniper Research Interactive Forecast Excel contains the following functionality:
- Statistics Analysis: Users benefit from the ability to search for specific metrics; displayed for all regions and countries across the data period. Graphs are easily modified and can be exported to the clipboard.
- Country Data Tool: This tool lets users look at metrics for all regions and countries in the forecast period. Users can refine the metrics displayed via a search bar.
- Country Comparison Tool: Users can select and compare countries. The ability to export graphs is included in this tool.
SAMPLE VIEW
Market Trends & Forecasts PDF Report
A comprehensive analysis of the current market landscape, alongside strategic recommendations and a walk-through of the forecasts.
Table of Contents
1. Key Takeaways & Strategic Recommendations
- 1.1. Key Takeaways
- 1.2. Strategic Recommendations
2. Trade Surveillance Systems Market Summary
- 2.1. Introduction
- 2.1.1. The History of Trade Surveillance Systems
- 2.1.2. The Current Landscape
- Figure 2.1: Global Spend on Third-party Trade Surveillance Systems ($m), 2024-2029, Split by 8 Key Regions: ($4.9 billion by 2029)
- Figure 2.2: How Do Trade Surveillance Systems Work?
- Figure 2.3: Trade Surveillance Systems - Solution Categories
- 2.1.3. Regulatory Landscape
- Figure 2.4: Key Global Market Abuse Regulations/Regulatory Bodies
- i. The Markets in Financial Instruments Directive II (MiFID II)
- ii. The European Union Market Abuse Regulation (EU MAR)
- iii. The UK Market Abuse Regulation (UK MAR)
- iv. Dodd-Frank Wall Street Reform and Consumer Protection Act (Dodd-Frank Act)
- v. Rule 15c3-5
- vi. New Algorithm Trading Rules
- vii. The Financial Instruments and Exchange Act (FIEA)
- viii. The Monetary Authority of Singapore (MAS)
- 2.2. Portrait of Financial Crime
- 2.2.1. Types of Market Abuse
- Figure 2.5: Types of Market Abuse
- i. Price Manipulation
- ii. Circular Trading
- iii. Misuse of Insider Knowledge
- iv. Trade-based Money Laundering (TBML)
- v. Price Influencing
- vi. Improper Order Handling
- vii. Misleading Conduct
- 2.2.1. Types of Market Abuse
- 2.3. Drivers
- 2.3.1. Regulatory Pressure
- 2.3.2. Technological Innovation
- 2.3.3. Market Complexity
- 2.3.4. Data Governance
- 2.4. Challenges
- 2.4.1. False Positives
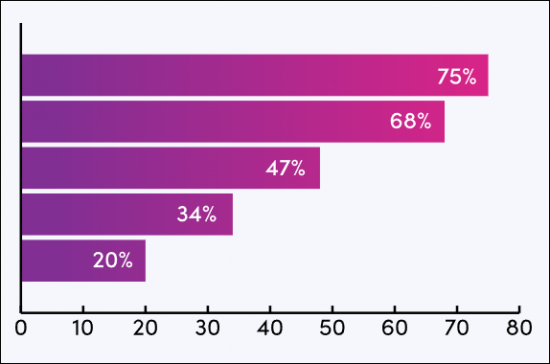
- Figure 2.6: Acuiti Trade Surveillance Market Review Survey
- 2.4.2. Pressure On Compliance Teams
- 2.4.3. Cross-product Surveillance
- 2.4.1. False Positives
3. Segment Analysis
- 3.1. Segment Analysis
- Figure 3.1: Total Spend on Third-party Trade Surveillance Systems ($m), 2029, Split by Segment - $4.9 Billion
- 3.1.1. Large Financial Institutions
- Figure 3.2: Global Spend on Third-party Trade Surveillance Systems by Large ($m), 2024-2029
- 3.1.2. Medium-sized Financial Institutions
- Figure 3.3: Global Spend on Third-party Trade Surveillance Systems by Mediumsized FIs ($m), 2024-2029
- 3.1.3. Small-sized Financial Institutions
- Figure 3.4: Global Spend on Third-party Trade Surveillance Systems by Small FIs ($m), 2024-2029
- 3.1.4. Other Businesses
- Figure 3.5: Global Spend on Third-party Trade Surveillance Systems by Other Businesses ($m), 2024-2029
4. Competitor Leaderboard
- 4.1. Why Read This Report
- Figure 4.1: Juniper Research Competitor Leaderboard Vendors: Trade Surveillance Systems
- Figure 4.2: Juniper Research Competitor Leaderboard: Trade Surveillance Systems Vendors
- Figure 4.3: Juniper Research Competitor Leaderboard: Trade Surveillance Systems Vendors Ranking
- Table 4.4: Juniper Research Trade Surveillance Systems Market: Heatmap Results (Part 1 of 2)
- Table 4.5: Juniper Research Trade Surveillance Systems Market: Heatmap Results (Part 2 of 2)
- 4.2. Vendor Profiles
- 4.2.1. ACA Group
- i. Corporate
- ii. Geographical Spread
- iii. Key Clients & Strategic Partnerships
- iv. High-level View of Offerings
- v. Juniper Research's View: Key Strengths & Strategic Development Opportunities
- 4.2.2. Aquis Exchange
- i. Corporate
- Figure 4.6: Aquis' Financial Snapshot ($m), (Converted from GBP at 1.24)
- ii. Geographical Spread
- iii. Key Clients & Strategic Partnerships
- iv. High-level View of Offerings
- v. Juniper Research's View: Key Strengths & Strategic Development Opportunities
- i. Corporate
- 4.2.3. b-next
- i. Corporate
- ii. Geographical Spread
- iii. Key Clients & Strategic Partnerships
- iv. High-level View of Offerings
- v. Juniper Research's View: Key Strengths & Strategic Development Opportunities
- 4.2.4. eflow Global
- i. Corporate
- ii. Geographical Spread
- iii. Key Clients & Strategic Partnerships
- iv. High-level View of Offerings
- v. Juniper Research's View: Key Strengths & Strategic Development Opportunities
- 4.2.5. Eventus Systems
- i. Corporate
- ii. Geographical Spread
- iii. Key Clients & Strategic Partnerships
- iv. High-level View of Offerings
- v. Juniper Research's View: Key Strengths & Strategic Development Opportunities
- 4.2.6. FIS
- i. Corporate
- Figure 4.7: FIS Financial Snapshot ($m), 2021-2024
- ii. Geographical Spread
- iii. Key Clients & Strategic Partnerships
- iv. High-level View of Offerings
- v. Juniper Research's View: Key Strengths & Strategic Development Opportunities
- i. Corporate
- 4.2.7. Nasdaq
- i. Corporate
- ii. Geographical Spread
- iii. Key Clients & Strategic Partnerships
- iv. High-level View of Offerings
- v. Juniper Research's View: Key Strengths & Strategic Development Opportunities
- 4.2.8. Nexi Group
- i. Corporate
- Figure 4.8: Nexi Group's Financial Snapshot ($m) Converted from Euro at 1.05
- ii. Geographical Spread
- iii. Key Clients & Strategic Partnerships
- iv. High-level View of Offerings
- v. Juniper Research's View: Key Strengths & Strategic Development Opportunities
- i. Corporate
- 4.2.9. NICE Actimize
- i. Corporate
- Table 4.9: NICE Actimize's Financial Performance ($m), 2020-2023
- ii. Geographical Spread
- iii. Key Clients & Strategic Partnerships
- iv. High-level View of Offerings
- v. Juniper Research's View: Key Strengths & Strategic Development Opportunities
- i. Corporate
- 4.2.10. Scila
- i. Corporate
- ii. Geographical Spread
- iii. Key Clients & Strategic Partnerships
- iv. High-level View of Offerings
- v. Juniper Research's View: Key Strengths & Strategic Development Opportunities
- 4.2.11. Software AG
- i. Corporate
- Figure 4.10: Software AG's Financial Snapshot ($m), converted from Euro at 1.05
- ii. Geographical Spread
- iii. Key Clients & Strategic Partnerships
- iv. High-level View of Offerings
- Figure 4.11: Software AG's Market Surveillance
- v. Juniper Research's View: Key Strengths & Strategic Development Opportunities
- i. Corporate
- 4.2.12. SteelEye
- i. Corporate
- ii. Geographical Spread
- iii. Key Clients & Strategic Partnerships
- iv. High-level View of Offerings
- Figure 4.12: SteelEye's Scope of Data Sources for Archiving and Monitoring
- v. Juniper Research's View: Key Strengths & Strategic Development Opportunities
- 4.2.13. SymphonyAI Sensa
- i. Corporate
- Table 4.13: SymphonyAI Sensa's Investment Rounds, 2012-2015
- ii. Geographical Spread
- iii. Key Clients & Strategic Partnerships
- iv. High-level View of Offerings
- v. Juniper Research's View: Key Strengths & Strategic Development Opportunities
- i. Corporate
- 4.2.14. Trading Technologies
- i. Corporate
- ii. Geographical Spread
- iii. Key Clients & Strategic Partnerships
- iv. High-level View of Offerings
- Figure 4.14: Trading Technologies-R Trade Surveillance
- v. Juniper Research's View: Key Strengths & Strategic Development Opportunities
- 4.2.15. TradingHub
- i. Corporate
- ii. Geographical Spread
- iii. Key Clients & Strategic Partnerships
- iv. High-level View of Offerings
- v. Juniper Research's View: Key Strengths & Strategic Development Opportunities
- 4.2.16. Trapets
- i. Corporate
- ii. Geographical Spread
- iii. Key Clients & Strategic Partnerships
- iv. High-level View of Offerings
- v. Juniper Research's View: Key Strengths & Strategic Development Opportunities
- 4.2.1. ACA Group
5. Data & Forecast
- 5.1. Introduction
- 5.2. Methodology & Assumptions
- Figure 5.1: Trade Surveillance Systems Forecast Methodology - Financial Services (Large, Medium, and Small Financial Institutions)
- Figure 5.2: Trade Surveillance Systems Forecast Methodology - Other Businesses
- 5.3. Trade Surveillance Systems Market
- 5.3.1. Total Spend on Trade Surveillance Systems
- Figure & Table 5.3: Total Spend on Third-party Trade Surveillance Systems ($m), Split by 8 Key Regions, 2024-2029
- Table 5.4: Total Spend on Third-party Trade Surveillance Systems ($m), Split by Segment, 2024-2029
- 5.3.2. Total Spend on Third-party Trade Surveillance Systems by Large Financial Institutions
- Figure & Table 5.5: Total Spend on Third-party Trade Surveillance Systems by Large Financial Institutions ($m), 2024-2029
- 5.3.3. Total Spend on Third-party Surveillance Systems by Medium-sized Financial Institutions
- Figure & Table 5.6: Total Spend on Third-party Trade Surveillance Systems by Medium-sized Financial Institutions ($m), 2024-2029
- 5.3.4. Total Spend on Third-party Trade Surveillance Systems by Small-sized Financial Institutions
- Figure & Table 5.7: Total Spend on Third-party Trade Surveillance Systems by Small-sized Businesses ($m), Split by 8 Key Regions, 2024-2029
- 5.3.5. Total Spend on Third-party Trade Surveillance Systems by Other Businesses
- Figure & Table 5.8: Total Spend on Third-party Trade Surveillance Systems by Other Businesses ($m), Split by 8 Key Regions, 2024-2029
- 5.3.1. Total Spend on Trade Surveillance Systems
 2025 年至 2033 年貿易監控系統市場報告(按組件、部署模式、企業規模、最終用戶和地區)
 交易監控系統全球市場報告 2025
 交易監控系統:市場佔有率分析、產業趨勢/統計、成長預測(2025-2030)
 市場佔有率與預測:2023年至2028年全球貿易監督與監控(2 份報告合集)
 貿易監控系統市場:按組件、部署分類 - 2025-2030 年全球預測
 貿易監控系統全球市場 2024-2028
 全球貿易監控市場研究報告 - 2024 年至 2032 年產業分析、規模、佔有率、成長、趨勢和預測
 2024-2032 年按組件、部署模式、企業規模、最終用戶和地區分類的貿易監控系統市場報告
 交易監控市場報告:2030 年趨勢、預測與競爭分析
 2023-2030 年全球貿易監控系統市場規模研究與預測(按組件、部署模型、企業規模、最終用戶和區域分析)