


 |
市場調查報告書
商品編碼
1669753
智慧商業建築中的物聯網設備(2025-2030)- 設備預測、採用、元趨勢分析IoT Devices in Smart Commercial Buildings 2025 to 2030 - Device Projections, Adoption & Meta-Trends Analysis |
||||||
商業建築領域正處於技術轉折點,預計到2030年物聯網應用將增加一倍以上,達到 41.2億。
人工智慧和物聯網系統的整合創造前所未有的能力,預計智慧建築人工智慧解決方案市場將以 25.5%的年複合成長率成長,到2028年達到 65億美元。安全漏洞需要強大的框架。最近發生的引人注目的事件凸顯了全面安全策略的重要性,並推動了以下安全策略的採用:
本報告研究了智慧商業建築中的物聯網設備市場,並深入了解了商業房地產領域(包括辦公室、零售、飯店和資料中心)的設備滲透率、技術採用模式和實施框架。
範例視圖
本報告的詳細細分分析和技術路線圖為駕馭複雜的智慧建築格局和識別眼前機會提供了重要指導,同時也為長期轉變做好了準備,包括:
範例視圖
目錄
前言
執行摘要
第1章 物聯網生態系
- 物聯網的定義
- 物聯網技術堆疊
- 建構物聯網
第2章 人工智慧在建構物聯網中的作用
- 物聯網感測器網路中人工智慧的演變
- 人工智慧與物聯網的融合
- 人工智慧投資與採用趨勢
- AI硬體和處理
- 邊緣人工智慧
- 實施挑戰與策略建議
第3章 物聯網技術前景
- 物聯網設備預測
- 依應用劃分的物聯網設備
- 物聯網感測器連接
- 商業建築業的物聯網設備
- 依地區劃分的物聯網設備
- 感測器技術的準備和成熟度
- 物聯網設備創新與新機會
第4章 實施挑戰與解決方案
- 系統整合與互通性
- 安全、隱私和資料所有權
- 成本論證與商業案例
- 裝置管理與視覺性
- 改造傳統建築系統
第5章 元趨勢分析
- 市場投資與招募趨勢
- 宏觀經濟展望
- 地緣政治趨勢
- 房地產趨勢
- CRE建築展望
- 環境、社會與治理趨勢(ESG)
- 物聯網技能與就業市場
第6章 標準與協定
- 開放標準的重要性
- 樓宇自動化協議
- 應用層協定
- 物聯網安全標準
- 資料模型與框架
- 標準整合與互通性工作
The Definitive Market Report on IoT Devices & Connectivity Transforming Commercial Real Estate through 2030
The commercial building sector stands at a technological inflection point, with IoT deployments projected to more than double to 4.12 billion by 2030. Our new market assessment provides unprecedented insights into device proliferation, technology adoption patterns, and implementation frameworks across commercial real estate verticals including offices, retail, hospitality, and data centers.
Based on primary research and rigorous data analysis, this report delivers the market intelligence needed to navigate the rapidly evolving smart building landscape. It examines the convergence of IT and OT systems, emerging connectivity protocols, AI integration, and critical security considerations that are fundamentally reshaping how commercial buildings operate and interact with occupants.
The research includes a spreadsheet with all the data tables AND a presentation file with high-resolution versions of the charts.
SAMPLE VIEW
KEY QUESTIONS ADDRESSED ABOUT IOT DEVICES
- How many connected IoT devices have been installed in commercial smart buildings? Memoori estimates that the installed base of IoT devices in commercial buildings is approximately 2 billion and is expected to grow to 4.12 billion by 2030. The report breaks this down by both technology vertical and building type.
- How are connectivity technologies evolving in smart buildings? Wireless technologies (Wi-Fi and Bluetooth/BLE) continue to grow their market share and will represent over 40% of all connections by 2030. The report forecasts sensor adoption by connectivity type across commercial buildings to 2030.
- What are the primary implementation challenges for smart building IoT systems? Organizations face significant integration hurdles from siloed building systems, with 81% reporting IoT-related cyber incidents and over 90% of sensor-generated data remaining unexploited due to technical fragmentation and organizational barriers between IT and operations teams.
The detailed segmentation analysis and technology roadmaps in this report provide essential guidance for navigating the complex smart building landscape, identifying immediate opportunities while preparing for longer-term shifts toward grid-interactive buildings and AI-driven autonomous operations.
Unlike broader IoT market reports, this research specifically addresses the unique requirements of commercial buildings through rigorous bottom-up and top-down modeling approaches. Our dual methodology incorporates detailed building stock analysis, technology adoption metrics, and regional variations validated by industry experts across the supply chain.
WITHIN ITS 243 PAGES AND 15 CHARTS AND TABLES, THE REPORT FILTERS OUT ALL THE KEY FACTS AND DRAWS CONCLUSIONS, SO YOU CAN UNDERSTAND EXACTLY WHAT IS SHAPING THE FUTURE OF COMMERCIAL SMART BUILDINGS.
- AI is transforming building intelligence. The integration of AI with IoT systems is creating unprecedented capabilities, with the market for AI solutions in smart buildings projected to grow at a rate of 25.5% CAGR to reach $6.5 billion by 2028, enabling predictive analytics that has demonstrated significant reductions in HVAC energy consumption.
- Security vulnerabilities demand robust frameworks. Recent high-profile incidents highlight the critical importance of integrated security strategies, driving adoption of NIST, ISO/IEC 27001, and Zero Trust Architecture.
- Standards convergence is accelerating interoperability. The industry is seeing an increase in standards collaboration with Project Haystack, Brick Schema, and ASHRAE developing 223P for unified data semantics, while Matter protocol expansion bridges traditional gaps between residential and commercial systems.
This report provides valuable information to companies so they can improve their strategic planning exercises AND look at the potential for developing their business.
WHO SHOULD BUY THIS REPORT?
The information contained in this report will be of value to all those engaged in managing, operating, and investing in commercial smart buildings (and their advisers) around the world. In particular, those wishing to understand exactly how the Internet of Things is impacting commercial real estate will find it most useful.
SAMPLE VIEW
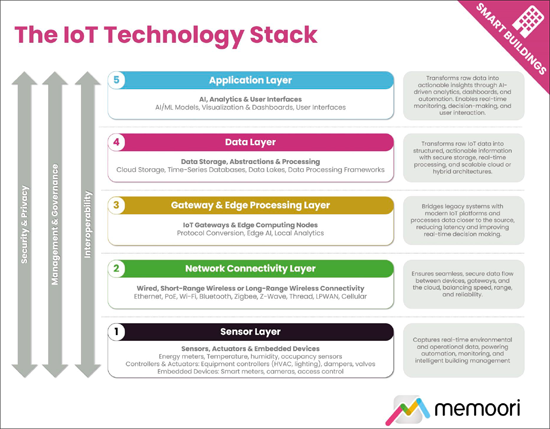
The model above illustrates the core components of the IoT technology stack, showing the five main layers together with three cross-cutting considerations, Security & Privacy, Management & Governance, and Interoperability.
Table of Contents
Preface
The Executive Summary
1. The IoT Ecosystem
- 1.1. Defining the IoT
- 1.2. The IoT Technology Stack
- 1.3. The Building Internet of Things
2. AI's Role in The Building Internet of Things
- 2.1. The Evolution of AI in IoT Sensor Networks
- 2.2. The Convergence of AI and IoT
- 2.3. AI Investment & Adoption Trends
- 2.4. AI Hardware & Processing
- 2.5. Edge AI
- 2.6. Implementation Challenges & Strategic Recommendations
3. The IoT Technology Landscape
- 3.1. IoT Device Projections
- 3.2. IoT Devices by Application
- 3.3. IoT Sensor Connectivity
- 3.4. IoT Devices by Commercial Building Vertical
- 3.5. IoT Devices by Region
- 3.6. Sensor Technology Readiness & Maturity
- 3.7. IoT Device Innovations & Emerging Opportunities
4. Implementation Challenges & Solutions
- 4.1. System Integration & Interoperability
- 4.2. Security, Privacy & Data Ownership
- 4.3. Cost Justifications & Business Case
- 4.4. Device Management & Visibility
- 4.5. Retrofitting Legacy Building Systems
5. Meta Trend Analysis
- 5.1. Market Investment & Adoption Trends
- 5.2. Macro Economic Outlook
- 5.3. Geopolitical Trends
- 5.4. Real Estate Trends
- 5.5. CRE Construction Outlook
- 5.6. Environmental, Social & Governance Trends (ESG)
- 5.7. IoT Skills & Job Markets
6. Standards & Protocols
- 6.1. The Importance of Open Standards
- 6.2. Building Automation Protocols
- 6.3. Application Layer Protocols
- 6.4. IoT Security Standards
- 6.5. Data Models & Frameworks
- 6.6. Standards Convergence & Interoperability Initiatives
List of Charts and Figures
- Fig 1.1: The IoT Technology Stack
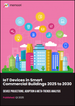
- Fig 1.2: The Internet of Things in Smart Commercial Buildings 2025 v6.0
- Fig 2.1: AI & Machine Learning Techniques and their Smart Building Applications
- Fig 3.1: Global IoT Device Projections. Installed Base of Connected Devices (Bn) 2023 to 2030
- Fig 3.2: Installed Base of IoT Devices in Commercial Smart Buildings 2022 to 2030 (Mn)
- Fig 3.3: Commercial Building IoT Devices by Application 2024 to 2030 (Mn)
- Fig 3.4: Commercial Smart Building IoT Devices by Connectivity Type 2024 to 2030 (Mn)
- Fig 3.5: Commercial Smart Building IoT Devices by Vertical 2024 to 2030 (Mn)
- Fig 3.6: Commercial Smart Building IoT Devices by Region 2024 to 2030 (Mn)
- Fig 3.7: Smart Building IoT Research Trends 2016 to 2023, Number of Publications per Year
- Fig 3.8: Smart Building IoT Patents Trends 2016 to 2024, Number of Patents per Year
- Fig 5.1: IoT Deployment Plans
- Fig 5.2: Quarterly Gross Leasing Volumes for Offices by Region
- A1 Comparative Analysis of IoT Sensing Technologies by Application
 智慧外牆市場 - 全球產業規模、佔有率、趨勢、機會和預測,按材料類型、技術、應用、地區、競爭細分,2020-2030 年預測
 智慧建築市場規模、佔有率及成長分析(按組件、解決方案、建築類型和地區)-2025-2032 年產業預測
 智慧建築:市場佔有率分析、產業趨勢與統計、成長預測(2025-2030 年)2025年智慧建築(非住宅建築)全球市場報告2025 年全球辦公大樓市場報告
 智慧建築市場機會、成長動力、產業趨勢分析及2025-2034年預測
 智慧建築市場分析:年度訂閱
 智慧建築的Start-Ups(2025年):M&A,投資,引人注目的亞太地區的新興企業
 2025-2029 年全球智慧建築
 2025 年五大智慧建築成長機會