


 |
市場調查報告書
商品編碼
2122635
數位化流程自動化:市場佔有率分析、產業趨勢與統計、成長預測(2026-2031)Digital Process Automation - Market Share Analysis, Industry Trends & Statistics, Growth Forecasts (2026 - 2031) |
||||||

※ 本網頁內容可能與最新版本有所差異。詳細情況請與我們聯繫。
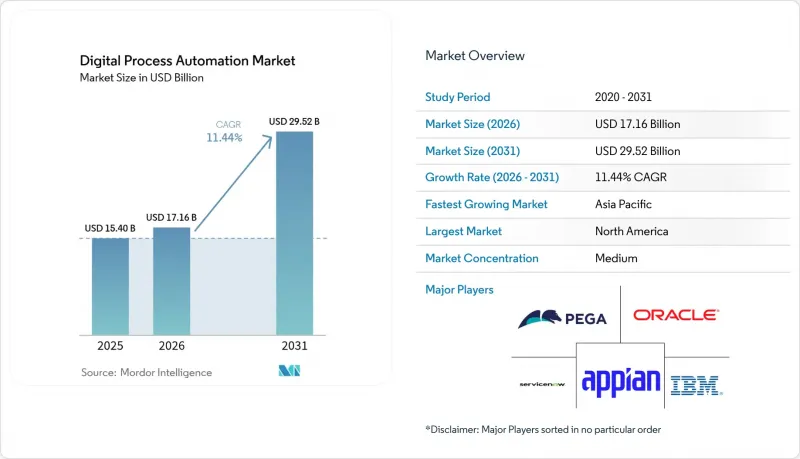
據 Mordor Intelligence 稱,2025 年數位流程自動化市場價值為 154 億美元,預計到 2031 年將達到 295.2 億美元,而 2026 年為 171.6 億美元,預測期(2026-2031 年)的複合年成長率為 11.4%。
本報告按組件(解決方案和服務)、部署模式(按需部署和本地部署)、企業規模(中小企業和大型企業)、最終用戶(銀行、金融服務和保險、製造業、IT和電信等)以及地區(北美、南美、歐洲、亞太、中東和非洲)進行細分。市場預測以美元計價。
全球數位化流程自動化市場趨勢與洞察
對自動化以簡化後勤部門營運的需求日益成長。
如今,企業不再僅僅將後勤部門轉型視為降低成本的手段,而是視為成長的驅動力。透過結合智慧文件處理和自動化決策,各大銀行已成功將貸款申請審核的人工工作量減少了40%至60%。在製造業,將供應鏈資訊與生產計畫同步,可縮短庫存週轉天數,並提高訂單履行的準確性。自動化套件中內建的持續流程挖掘診斷功能,無需等待季度審核,即可即時識別瓶頸。因此,企業衡量成功的標準不再是完成的任務數量,而是客戶滿意度和合規準確性,這表明市場已趨於成熟。能夠將這些以結果為導向的指標轉化為商業性價值提案的供應商,正在獲得競爭優勢。
低程式碼/無程式碼的引入使非專業開發者也能參與其中。
低程式碼技術的普及應用已將自動化工作負載從集中式 IT 部門轉移到各個業務單位。微軟預測,到 2024 年,Power Platform 的開發人員採用率將成長 500%。標準工作流程的專案前置作業時間已從數月縮短至數週,從而加快了投資回報。企業正透過建立自動化卓越中心來應對治理挑戰,這些中心提供範本、安全防護措施和審計策略,同時又不扼殺創造力。管治也越來越認可開發人員建立的流程,只要文件和可追溯性管理得當,這些流程就被視為一流的業務流程。這種民主化趨勢正在擴大數位流程自動化的市場。
流程自動化領域熟練人員短缺
具備流程分析、技術專長和變革管理技能的專家需求遠超供給。企業正透過建立內部學院和與大學合作來應對這一問題,但培養這些專家仍然需要很長時間。許多公司正在將有限的人才整合到自動化卓越中心,集中設計和管治技能。同時,服務供應商開始提供“自動化即服務 (AaaS)”,使企業能夠透過訂閱協議利用外部專家,即使內部能力不足也能確保專案順利進行。隨著時間的推移,低程式碼工具正在緩解部分人才短缺問題,但複雜的實施仍需要專家監督。
細分市場分析
預計到2025年,解決方案領域將保持54.65%的數位化流程自動化市場佔有率,這凸顯了買家對整合編配、分析和人工智慧的全端平台的偏好,這些平台只需一個許可證即可使用。然而,隨著企業意識到僅靠軟體無法重塑現有流程,服務領域正以12.86%的複合年成長率快速擴張。顧問團隊將流程挖掘的洞見與流程重塑研討會結合,在開始編寫機器人程式碼之前消除浪費。
業務收益擴大來自人工智慧模型訓練、跨平台整合和託管最佳化。合約範圍現已涵蓋持續改善週期,使服務提供者能夠在整個自動化生命週期中實現價值。預計到2031年,以服務為導向的數位化流程自動化市場規模將接近143.7億美元,這表明對外部專業知識的需求將持續存在。
預計到2025年,基於雲端的按需部署將佔數位流程自動化市場58.12%的佔有率,年複合成長率達12.52%,這主要得益於彈性擴展和訂閱模式的經濟效益獲得預算部門的支持。透過供應商管道提供的自動化補丁和AI更新將減輕IT團隊的維護工作量,並加速創新。
在對延遲和主權仍有要求的領域,混合框架正日益受到重視。邊緣自動化節點可在本地處理敏感數據,同時將匯總分析結果同步到雲端。可攜式的容器包允許在不同環境之間遷移流程而無需重構,讓使用者能夠安心地按照自己的節奏遷移工作負載。
區域分析
預計到2025年,北美將佔全球收入的35.78%,這主要得益於其成熟的雲端基礎設施、充裕的創業投資以及企業在核心營運早期就積極採用人工智慧的意願。美國企業率先開展了超自動化先導計畫,將流程挖掘、聊天機器人介面和自主決策循環整合到統一的程序中。加拿大除了在醫療保健和公共部門加大投入外,還在推動服務交付的現代化。
亞太地區是成長最快的地區,預計到2031年將以13.22%的複合年成長率成長。中國在智慧工廠領域處於主導地位,將流程自動化與工業感測器結合,實現自適應調度。在政府「數位印度」政策的推動下,印度領先的IT服務公司正在部署內部機器人,以提高設備運轉率和客戶應對力,該政策旨在促進自動化技術的應用。在東南亞,跨國公司正在為數位化提供稅收優惠的地區建立新的生產線,並引導當地供應商效仿。
在歐洲,創新與嚴格監管之間正尋求平衡。提案的「人工智慧法」要求提高透明度並減少偏見,這從自動化設計的早期階段就對其產生了影響。一家德國中型製造商正在將工作流引擎與邊緣設備整合,以減少停機時間;而一家英國銀行則致力於透過端到端的自動化證據記錄來實現合規。在該地區的其他地區,海灣國家和南非正在積極採用自動化技術來最佳化能源和公共服務,但人才短缺在短期內減緩了這一進程。
其他好處:
- Excel格式的市場預測(ME)表
- 3個月的分析師支持
目錄
第1章:引言
- 研究假設和市場定義
- 調查範圍
第2章:調查方法
第3章執行摘要
第4章 市場狀況
- 市場概覽
- 市場促進因素
- 提高後勤部門效率對自動化的需求日益成長。
- 低程式碼/無程式碼的引入將使公民開發者能夠發揮更積極的作用。
- 整合DPA、AI和RPA實現超自動化
- 由於監管要求,需要可審計的數位化工作流程。
- 事件驅動、API優先的微旅程自動化
- ESG報告驅動的永續發展業務流程數位化
- 市場限制因素
- 製程自動化領域熟練人員短缺
- 關鍵工作流程中的資料安全和隱私風險
- 舊有系統的碎片化推高了整合成本。
- 對自動化決策中演算法偏見的審查
- 宏觀經濟因素對市場的影響
- 供應鏈分析
- 監理情勢
- 技術展望
- 波特五力分析
第5章 市場規模與成長預測
- 按組件
- 解決方案
- 服務
- 不同的發展
- 一經請求
- 現場
- 按組織規模
- 小型企業
- 大公司
- 最終用戶
- 銀行、金融服務和保險(BFSI)
- 製造業
- 資訊科技/通訊
- 航太/國防
- 衛生保健
- 零售和消費品
- 其他最終用戶
- 按地區
- 北美洲
- 美國
- 加拿大
- 墨西哥
- 南美洲
- 巴西
- 阿根廷
- 其他南美國家
- 歐洲
- 德國
- 英國
- 法國
- 其他歐洲國家
- 亞太地區
- 中國
- 日本
- 印度
- 東南亞
- 其他亞太國家
- 中東和非洲
- 中東
- 沙烏地阿拉伯
- 阿拉伯聯合大公國
- 其他中東國家
- 非洲
- 南非
- 埃及
- 其他非洲國家
- 中東
- 北美洲
第6章 競爭情勢
- 市場集中度
- 策略趨勢
- 市佔率分析
- 公司簡介
- IBM Corporation
- Pegasystems Inc.
- Appian Corporation
- Bizagi Group Limited
- Oracle Corporation
- Software AG
- SS&C Technologies Holdings, Inc.
- OpenText Corporation
- Newgen Software Technologies Ltd.
- TIBCO Software Inc.
- Nintex Global Ltd.
- K2 Software Inc.
- Bonitasoft SA
- AgilePoint Inc.
- Kissflow Inc.
- ProcessMaker Inc.
- AuraQuantic SL
- BizFlow Corporation
- Joget Inc.
- Creatio EMEA Limited
- ServiceNow Inc.
- Genpact Limited
- Cognizant Technology Solutions Corp.
- Infosys Limited
- Wipro Limited
第7章 市場機會與未來展望
According to Mordor Intelligence, the digital process automation market size was valued at USD 15.4 billion in 2025 and estimated to grow from USD 17.16 billion in 2026 to reach USD 29.52 billion by 2031, at a CAGR of 11.44% during the forecast period (2026-2031).
This report is Segmented by Component (Solution and Service), Deployment (On-Demand and On-Premise), Organization Size (Small and Medium Sized Enterprises and Large Enterprises), End User (BFSI, Manufacturing, IT and Telecommunication, and More), and Geography (North America, South America, Europe, Asia-Pacific, Middle East and Africa). The Market Forecasts are Provided in Terms of Value (USD).
Global Digital Process Automation Market Trends and Insights
Rising Demand for Automated Back-Office Efficiency
Enterprises now treat back-office transformation as a growth lever, not merely a cost-takeout exercise. Intelligent document processing, paired with decision automation, has reduced manual effort in loan origination by 40-60% at leading banks. Manufacturers synchronize supply-chain updates with production schedules, reducing inventory days and improving order fulfillment accuracy. Continuous process-mining diagnostics embedded within automation suites surface bottlenecks in real-time, rather than waiting for quarterly reviews. As a result, companies measure success against customer satisfaction and compliance accuracy rather than task counts, signalling market maturity. Vendors able to translate these outcome-oriented metrics into commercial value propositions gain competitive traction.
Low-Code/No-Code Adoption Enabling Citizen Developers
A surge in low-code usage has shifted automation workload from centralized IT to business units. Microsoft reported a 500% increase in citizen-developer adoption of Power Platform during 2024. Project lead times for standard workflows now fall from months to weeks, accelerating the return on investment. Enterprises tackle governance challenges by standing up automation centers of excellence that issue templates, security guardrails, and audit policies without stifling creativity. Regulatory regimes are increasingly recognizing citizen-built flows as first-class business processes, provided that documentation and traceability controls are in place. The democratization trend expands the addressable market for digital process automation.
Shortage of Skilled Process-Automation Talent
The demand for professionals who blend process analysis, technical expertise, and change management exceeds the supply. Firms respond by funding internal academies and partnering with universities; yet, the ramp-up time for expert roles remains long. Many companies pool scarce talent inside automation centers of excellence, centralizing design and governance skills. Meanwhile, service providers launch automation-as-a-service offers, allowing businesses to tap external experts on subscription terms and keep projects on track despite internal gaps. Over time, low-code tools mitigate part of the shortage, but complex deployments still need specialist oversight.
Other drivers and restraints analyzed in the detailed report include:
- Integration of DPA with AI and RPA for Hyper-Automation
- Regulatory-Driven Need for Auditable Digital Workflows
- Data-Security and Privacy Risks in Critical Workflows
For complete list of drivers and restraints, kindly check the Table Of Contents.
Segment Analysis
The solution segment retained 54.65% digital process automation market share in 2025, underscoring buyer preference for full-stack platforms that consolidate orchestration, analytics, and AI on one license. Services, however, are scaling faster at a 12.86% CAGR as organizations realize that software alone cannot re-engineer entrenched processes. Advisory teams blend process-mining insights with redesign workshops to eliminate waste before any bot is coded.
Service revenue is increasingly derived from AI model training, cross-platform integration, and managed optimization. Engagement scopes now cover continuous improvement cycles, allowing providers to capture value throughout the automation lifecycle. The digital process automation market size attributable to services is projected to approach USD 14.37 billion by 2031, signaling sustained demand for external expertise.
Cloud-based on-demand deployments controlled 58.12% of the digital process automation market size in 2025 and are slated to grow at a 12.52% CAGR as elastic scaling and subscription economics resonate with budget owners. Automatic patching and AI updates delivered through the vendor's pipeline relieve IT teams from maintenance duties, accelerating innovation.
Hybrid frameworks gain momentum where latency or sovereignty requirements persist. Edge-enabled automation nodes process sensitive data locally while syncing summary insights to the cloud. Portable container packs let flows shift between environments without refactoring, giving buyers confidence to migrate workloads at their own pace.
Complete Report Scope:
- By Component
- Solution
- Service
- By Deployment
- On-demand
- On-premise
- By Organization Size
- Small- and Medium-sized Enterprises
- Large Enterprises
- By End User
- Banking, Financial Services and Insurance (BFSI)
- Manufacturing
- IT and Telecommunication
- Aerospace and Defense
- Healthcare
- Retail and Consumer Goods
- Other End Users
- By Geography
- North America
- United States
- Canada
- Mexico
- South America
- Brazil
- Argentina
- Rest of South America
- Europe
- Germany
- United Kingdom
- France
- Rest of Europe
- Asia-Pacific
- China
- Japan
- India
- South-East Asia
- Rest of Asia-Pacific
- Middle East and Africa
- Middle East
- Saudi Arabia
- United Arab Emirates
- Rest of Middle East
- Africa
- South Africa
- Egypt
- Rest of Africa
- Middle East
- North America
Geography Analysis
North America commanded 35.78% of 2025 revenue thanks to mature cloud infrastructure, abundant venture capital, and early enterprise willingness to insert AI into core operations. U.S. organizations trail-blazed hyper-automation pilots that weave process mining, chatbot interfaces, and autonomous decision loops into cohesive programs. Canada complements its healthcare and public-sector initiatives with modernizations of service delivery.
Asia-Pacific is the fastest mover, set to advance at a 13.22% CAGR through 2031. China leads smart-factory investments, pairing process automation with industrial sensors for adaptive scheduling. India's IT services giants deploy internal bots to enhance utilization and client responsiveness, bolstered by government Digital India policies that promote the adoption of automation. Across Southeast Asia, multinationals are establishing new manufacturing lines in jurisdictions that offer tax incentives for digital upgrades, drawing local suppliers along the same path.
Europe balances innovation with stringent oversight. The proposed AI Act mandates transparency and bias mitigation, influencing the design of automation from the outset. Germany's Mittelstand manufacturers integrate workflow engines with edge machines to shrink downtime, while U.K. banks target regulatory alignment through end-to-end automated evidence trails. Elsewhere, Gulf economies and South Africa are embracing automation to optimize energy and public services, although talent shortages are tempering near-term momentum.
- IBM Corporation
- Pegasystems Inc.
- Appian Corporation
- Bizagi Group Limited
- Oracle Corporation
- Software AG
- SS&C Technologies Holdings, Inc.
- OpenText Corporation
- Newgen Software Technologies Ltd.
- TIBCO Software Inc.
- Nintex Global Ltd.
- K2 Software Inc.
- Bonitasoft S.A.
- AgilePoint Inc.
- Kissflow Inc.
- ProcessMaker Inc.
- AuraQuantic S.L.
- BizFlow Corporation
- Joget Inc.
- Creatio EMEA Limited
- ServiceNow Inc.
- Genpact Limited
- Cognizant Technology Solutions Corp.
- Infosys Limited
- Wipro Limited
Additional Benefits:
- The market estimate (ME) sheet in Excel format
- 3 months of analyst support
TABLE OF CONTENTS
1 INTRODUCTION
- 1.1 Study Assumptions and Market Definition
- 1.2 Scope of the Study
2 RESEARCH METHODOLOGY
3 EXECUTIVE SUMMARY
4 MARKET LANDSCAPE
- 4.1 Market Overview
- 4.2 Market Drivers
- 4.2.1 Rising demand for automated back-office efficiency
- 4.2.2 Low-code/no-code adoption enabling citizen developers
- 4.2.3 Integration of DPA with AI and RPA for hyper-automation
- 4.2.4 Regulatory-driven need for auditable digital workflows
- 4.2.5 Event-driven API-first micro-journey automation
- 4.2.6 ESG-reporting-led sustainability workflow digitization
- 4.3 Market Restraints
- 4.3.1 Shortage of skilled process-automation talent
- 4.3.2 Data-security and privacy risks in critical workflows
- 4.3.3 Legacy-system fragmentation raising integration cost
- 4.3.4 Algorithmic-bias scrutiny in automated decisions
- 4.4 Impact of Macroeconomic Factors on the Market
- 4.5 Supply-Chain Analysis
- 4.6 Regulatory Landscape
- 4.7 Technological Outlook
- 4.8 Porter's Five Forces Analysis
- 4.8.1 Threat of New Entrants
- 4.8.2 Bargaining Power of Buyers
- 4.8.3 Bargaining Power of Suppliers
- 4.8.4 Threat of Substitute Products
- 4.8.5 Intensity of Competitive Rivalry
5 MARKET SIZE AND GROWTH FORECASTS (VALUE)
- 5.1 By Component
- 5.1.1 Solution
- 5.1.2 Service
- 5.2 By Deployment
- 5.2.1 On-demand
- 5.2.2 On-premise
- 5.3 By Organization Size
- 5.3.1 Small- and Medium-sized Enterprises
- 5.3.2 Large Enterprises
- 5.4 By End User
- 5.4.1 Banking, Financial Services and Insurance (BFSI)
- 5.4.2 Manufacturing
- 5.4.3 IT and Telecommunication
- 5.4.4 Aerospace and Defense
- 5.4.5 Healthcare
- 5.4.6 Retail and Consumer Goods
- 5.4.7 Other End Users
- 5.5 By Geography
- 5.5.1 North America
- 5.5.1.1 United States
- 5.5.1.2 Canada
- 5.5.1.3 Mexico
- 5.5.2 South America
- 5.5.2.1 Brazil
- 5.5.2.2 Argentina
- 5.5.2.3 Rest of South America
- 5.5.3 Europe
- 5.5.3.1 Germany
- 5.5.3.2 United Kingdom
- 5.5.3.3 France
- 5.5.3.4 Rest of Europe
- 5.5.4 Asia-Pacific
- 5.5.4.1 China
- 5.5.4.2 Japan
- 5.5.4.3 India
- 5.5.4.4 South-East Asia
- 5.5.4.5 Rest of Asia-Pacific
- 5.5.5 Middle East and Africa
- 5.5.5.1 Middle East
- 5.5.5.1.1 Saudi Arabia
- 5.5.5.1.2 United Arab Emirates
- 5.5.5.1.3 Rest of Middle East
- 5.5.5.2 Africa
- 5.5.5.2.1 South Africa
- 5.5.5.2.2 Egypt
- 5.5.5.2.3 Rest of Africa
- 5.5.5.1 Middle East
- 5.5.1 North America
6 COMPETITIVE LANDSCAPE
- 6.1 Market Concentration
- 6.2 Strategic Moves
- 6.3 Market Share Analysis
- 6.4 Company Profiles (includes Global level Overview, Market level overview, Core Segments, Financials as available, Strategic Information, Market Rank/Share for key companies, Products and Services, and Recent Developments)
- 6.4.1 IBM Corporation
- 6.4.2 Pegasystems Inc.
- 6.4.3 Appian Corporation
- 6.4.4 Bizagi Group Limited
- 6.4.5 Oracle Corporation
- 6.4.6 Software AG
- 6.4.7 SS&C Technologies Holdings, Inc.
- 6.4.8 OpenText Corporation
- 6.4.9 Newgen Software Technologies Ltd.
- 6.4.10 TIBCO Software Inc.
- 6.4.11 Nintex Global Ltd.
- 6.4.12 K2 Software Inc.
- 6.4.13 Bonitasoft S.A.
- 6.4.14 AgilePoint Inc.
- 6.4.15 Kissflow Inc.
- 6.4.16 ProcessMaker Inc.
- 6.4.17 AuraQuantic S.L.
- 6.4.18 BizFlow Corporation
- 6.4.19 Joget Inc.
- 6.4.20 Creatio EMEA Limited
- 6.4.21 ServiceNow Inc.
- 6.4.22 Genpact Limited
- 6.4.23 Cognizant Technology Solutions Corp.
- 6.4.24 Infosys Limited
- 6.4.25 Wipro Limited
7 MARKET OPPORTUNITIES AND FUTURE OUTLOOK
- 7.1 White-space and Unmet-Need Assessment

 對零件分類系統市場進行分析和預測,直至 2035 年:按類型、產品、服務、技術、組件、應用、流程、最終用戶、功能和安裝類型分類。
 永續製造智慧市場預測至2034年—按解決方案類型、部署方式、技術、最終用戶和地區分類的全球分析製造業智慧市場預測至2034年-按組件、智慧類型、部署形式、應用、產業和地區分類的全球分析預測性零件庫存管理系統市場至2034年:按組件、部署模式、最終用戶和地區分類的全球分析
 數位流程自動化市場:按元件、流程類型、產業、組織規模和部署類型分類 - 全球預測(2026-2032 年)
 2026年全球數位化流程自動化市場報告
 全球數位化流程自動化市場規模、佔有率、趨勢和成長分析報告(2026-2034年)
 日本智慧製造軟體市場規模、佔有率、趨勢和預測:按軟體類型、公司規模、實施類型、產業和地區分類,2026-2034年
 數位流程自動化市場規模、佔有率和成長分析(按組件、業務功能、行業垂直領域和地區分類)-2026-2033年產業預測
 數位流程自動化市場,按組件、按部署類型、按組織規模、按業務功能、按最終用戶、按國家/地區 - 2025 年至 2032 年全球行業分析、市場規模、市場佔有率和預測