


 |
市場調查報告書
商品編碼
1910606
硬體即服務 (HaaS):市場佔有率分析、產業趨勢與統計、成長預測 (2026-2031)Hardware-as-a-Service (HaaS) - Market Share Analysis, Industry Trends & Statistics, Growth Forecasts (2026 - 2031) |
||||||
※ 本網頁內容可能與最新版本有所差異。詳細情況請與我們聯繫。
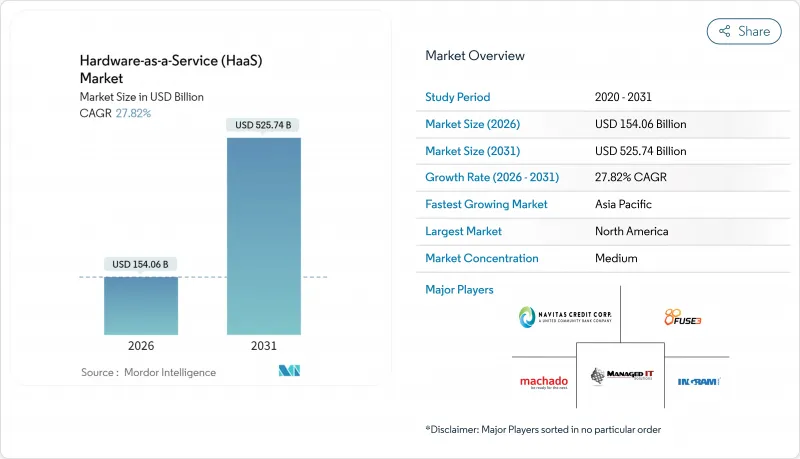
2025 年硬體即服務市場價值 1,205.4 億美元,預計到 2031 年將達到 5,257.4 億美元,而 2026 年為 1,540.6 億美元。
預測期(2026-2031 年)的複合年成長率預計為 27.82%。
這種快速成長反映出企業正將資本密集硬體採購轉向可預測的訂閱模式,而這主要得益於混合辦公模式的安全需求以及財務長對營運支出柔軟性的追求。政府主導的人工智慧項目,例如加拿大為國內超級運算撥款17億加元,正在刺激國內基礎設施需求;而美國《晶片科學法案》提供的500億美元獎勵,則促使製造商轉向訂閱式機器人技術,以在不耗盡現金儲備的情況下實現工廠現代化。資產支援證券化正在推動硬體即服務市場的發展,DLL計畫於2024年發行21.5億美元的證券,這將降低供應商的資金籌措成本,並促進價格競爭。歐盟的循環經濟法規也是推動這一趨勢的重要因素,因為這種模式符合強制性的耐用性和可維修性標準。
全球硬體即服務 (HaaS) 市場趨勢與洞察
訂閱模式允許公司將資本支出(CapEx)轉換為營運支出(OpEx)。
到 2024 年,美國54% 的設備採購將採用租賃方式,而非購買,這表明租賃模式正顯著轉向營運支出。訂閱協議能夠釋放資金用於戰略計劃,並保護買家免受設備快速折舊免稅額。戴爾 APEX 客戶報告稱,其服務台工作量減少了 50%,支援成本降低了 30%,這表明以結果為導向的夥伴關係正在取代一次性銷售。在設備快速更新換代的產業,這種優勢更為顯著,使得硬體即服務 (HaaS) 市場成為抵禦技術風險的策略性避險工具。
混合辦公安全法規正在縮短設備的使用壽命。
分散式辦公模式增加了終端安全威脅的風險,並將更新週期縮短至四年以內。惠普推出抗量子攻擊韌體,以應對未來的解密風險,並強調裝置更新內建的安全保障[HP.COM]。 70%的中小型企業計劃長期推行遠距辦公政策,增加了對託管更新服務的需求。
中小企業對HaaS的整體成本效益缺乏認知。
經合組織指出,數位落差依然存在,原因是中小企業缺乏評估訂閱提案所需的資金籌措技能和人力資源。這種錯配減緩了成本敏感地區的普及速度,但供應商提供的評估工具和政府補貼正在縮小知識差距。
細分市場分析
截至2025年,設備即服務(DaaS)將佔據硬體即服務(HaaS)市場佔有率的31.74%。同時,受小規模工廠自動化興起和低成本協作機器人廣泛應用的推動,機器人即服務(RaaS)預計將以29.35%的複合年成長率(CAGR)實現最快成長。 GPU即服務(GPU as a Service)的硬體即服務市場規模正隨著人工智慧(AI)工作負載的擴展而成長,GPU訂閱市場預計將從2025年的43.1億美元成長到2031年的498.4億美元。專業服務透過部署、監控和最佳化等功能為該硬體產品提供全面支持,從而提高運轉率。
訂閱模式的創新也延伸到了平台級服務領域。西門子Senseye每分鐘可處理超過一百萬個感測器資料點,展現了預測分析如何將原始硬體轉化為工業性能保障。這種架構轉變將價值從所有權轉移到使用權,使硬體即服務(HaaS)市場紮根於以結果為導向的經濟模式,並將競爭優勢向兼具分析和財務專業知識的供應商傾斜。
到 2025 年,本地部署將佔據 44.85% 的市場佔有率,這凸顯了金融和醫療保健等行業對合規性和延遲的敏感度。然而,結合了本地控制和雲端彈性的混合/網路即服務 (NaaS) 模型將繼續以 25.9% 的複合年成長率成長。聯想 ThinkAgile MX455 V3 展示了工作負載可移植性如何定義現代採購:它將 AI 推理部署在邊緣,同時將訓練工作負載擴展到 Azure。
雲端管理的硬體服務對於應對容量激增和簡化更新仍然至關重要,但資料主權法律規定某些工作負載必須保留在本地。 IBM 的 Power Virtual Server 本機部署 pod 表明,即使是公共雲端供應商也提供在地化訂閱以滿足資料主權要求。因此,硬體即服務 (HaaS) 市場正從非此即彼的思維模式轉向資產可以動態遷移的連續模式。
區域分析
到2025年,北美將維持41.72%的硬體即服務(HaaS)市場佔有率,這得益於其完善的租賃生態系統和鼓勵國內製造業發展的聯邦獎勵。目前,美國超過一半的設備採購已透過租賃方式完成,訂閱模式也日趨成熟。政府對半導體和先進製造業的補貼正在推動對軟性機器人和邊緣設備的需求。
亞太地區是成長最快的區域,複合年成長率達19.15%。中國的資本更新計畫旨在2027年將資本財支出增加25%,而印度為支持數位支付而進行的資料中心擴張,將創造強勁的訂閱管道。台灣在伺服器製造領域的領先地位,為設備即服務(DaaS)集群的全球物流鏈提供了支持,進一步將該地區與不斷擴張的全球硬體即服務(HaaS)市場聯繫起來。
歐洲的發展趨勢受到循環經濟法規的驅動,這些法規正引導企業轉向以服務為基礎的所有權模式。將於2024年7月生效的《永續產品生態設計》法規要求產品具備長壽命、可維修性和備件供應能力,這與包含維護服務的服務合約直接相關。擅長管理回收循環並提供翻新產品的供應商將受益於該法規,從而使歐洲成為以永續性主導的訂閱創新模式的試驗場。
其他福利:
- Excel格式的市場預測(ME)表
- 3個月的分析師支持
目錄
第1章 全球硬體即服務 (HaaS) 市場
第2章 引言
- 研究假設和市場定義
- 調查範圍
第3章調查方法
第4章執行摘要
第5章 市場情勢
- 市場概覽
- 市場促進因素
- 基於訂閱的硬體採購模式將企業的支出模式從資本支出(CapEx)轉變為營運支出(OpEx)。
- 混合辦公模式的安全需求導致設備生命週期縮短。
- 工業HaaS領域創業投資資金籌措與資產支持證券化模式的興起
- 政府的回流政策透過HaaS加速了自動化進程。
- 促進產品轉型為服務的循環經濟法規
- 利用嵌入式物聯網分析實現預測性維護合約
- 市場限制
- 中小企業對HaaS的整體成本效益認知不足。
- 供應商鎖定和複雜的終止條款
- 不斷上漲的資本成本正在擠壓供應商的利潤率。
- 訂閱式硬體資產的會計準則不一致
- 產業價值/價值鏈分析
- 監管環境
- 技術展望
- 波特五力分析
- 供應商的議價能力
- 消費者議價能力
- 新進入者的威脅
- 替代品的威脅
- 競爭對手之間的競爭
第6章 市場規模與成長預測
- 報價
- 硬體型號
- 設備即服務 (DaaS)
- 桌面/PC即服務
- 基礎設施硬體即服務 (I-HaaS)
- 平台硬體即服務 (P-HaaS)
- 機器人即服務(RaaS)
- GPU 即服務 (GPUaaS)
- 專業服務
- 硬體型號
- 透過部署模式
- 本地部署
- 雲端管理
- 混合/網路即服務
- 按最終用戶公司規模分類
- 主要企業
- 小型企業
- 按最終用戶行業分類
- 零售和批發
- 教育
- 銀行、金融服務和保險(BFSI)
- 製造業
- 醫療保健和生命科學
- 資訊科技/通訊
- 政府和公共部門
- 其他行業(能源、建築等)
- 按地區
- 北美洲
- 美國
- 加拿大
- 墨西哥
- 歐洲
- 德國
- 英國
- 法國
- 俄羅斯
- 其他歐洲
- 亞太地區
- 中國
- 日本
- 印度
- 韓國
- 澳洲
- 亞太其他地區
- 中東和非洲
- 中東
- 沙烏地阿拉伯
- 阿拉伯聯合大公國
- 其他中東地區
- 非洲
- 南非
- 埃及
- 其他非洲地區
- 中東
- 南美洲
- 巴西
- 阿根廷
- 南美洲其他地區
- 北美洲
第7章 競爭情勢
- 市場集中度
- 策略趨勢
- 市佔率分析
- 公司簡介
- Dell Technologies Inc.
- HP Inc.
- Lenovo Group Limited
- Fujitsu Limited
- Microsoft Corporation
- Cisco Systems, Inc.
- Amazon.com, Inc.(AWS Devices & Services)
- Hewlett Packard Enterprise Company
- Arrow Electronics, Inc.
- Ingram Micro Inc.
- Navitas Credit Corp.
- PhoenixNAP, LLC
- FUSE3 Communications, LLC
- Design Data Systems, Inc.
- Machado Consulting, Inc.
- Managed IT Solutions, Inc.
- Formic Technologies, Inc.
- Flex Ltd.
- Zscaler, Inc.
- Google LLC(ChromeOS & DaaS alliances)
第8章:市場機會與未來趨勢
- 評估差距和未滿足的需求
The hardware as a service market was valued at USD 120.54 billion in 2025 and estimated to grow from USD 154.06 billion in 2026 to reach USD 525.74 billion by 2031, at a CAGR of 27.82% during the forecast period (2026-2031).
The leap reflects enterprises converting capital-intensive hardware purchases into predictable subscriptions, a shift accelerated by hybrid-work security mandates and CFO preference for operating-expense flexibility. Sovereign AI programs, such as Canada's CAD 1.7 billion allocation for domestic super-computing, are stimulating home-grown infrastructure demand, while the U.S. CHIPS and Science Act's USD 50 billion incentives are pushing manufacturers toward subscription robotics to modernize plants without depleting cash reserves. Asset-backed securitization is scaling the hardware as a service market, with DLL issuing USD 2.15 billion in notes during 2024, lowering providers' cost of funds and enabling competitive pricing. Circular-economy regulation in the EU is another catalyst because the model aligns with mandated durability and repairability standards.
Global Hardware-as-a-Service (HaaS) Market Trends and Insights
Enterprises shift CapEx to OpEx with subscriptions
Leasing overtook purchasing for 54% of U.S. equipment acquisitions in 2024, illustrating the pivot to operational expenses Subscription contracts free capital for strategic projects and shield buyers from rapid depreciation. Dell APEX customers report a 50% cut in help-desk load and 30% lower support costs, showing that outcome-oriented partnerships replace one-off sales. The benefit is amplified in sectors with fast obsolescence, making the hardware-as-a-service market a strategic hedge against technology risk.
Device lifecycle shortens under hybrid-work security rules
Distributed work raises endpoint threat exposure, compressing refresh cycles below four years. HP introduced quantum-resistant firmware to counter future decryption risks, underscoring the security premium now baked into device turnover [HP.COM]. Seventy percent of SMEs plan permanent remote-work policies that intensify the need for managed refresh services.
Limited SME awareness of HaaS total-cost benefits
OECD notes that digital gaps linger because SMEs lack the financing skills and staff capacity to evaluate subscription proposals. The mismatch slows adoption in cost-sensitive regions, though provider-run assessment tools and government grants are shrinking the knowledge gap.
Other drivers and restraints analyzed in the detailed report include:
- VC funding and securitization boost industrial HaaS
- Government on-shoring incentives accelerate automation
- Vendor lock-in and complex exit terms
For complete list of drivers and restraints, kindly check the Table Of Contents.
Segment Analysis
Device-as-a-Service captured 31.74 of of % hardware as a service market share in 2025. Robot-as-a-Service, however, posts the fastest 29.35% CAGR, powered by small-factory automation and cheaper collaborative robots. The hardware as a service market size for GPU-as-a-Service is scaling alongside AI workloads; GPU subscriptions grew from USD 4.31 billion in 2025 to projections of USD 49.84 billion by 2031. Professional services wrap these hardware offerings with deployment, monitoring, and optimization that enhance uptime.
Subscription innovation extends to platform-level services. Siemens Senseye processes more than 1 million sensor points per minute, showing how predictive analytics converts raw hardware into industrial performance guarantees. The architecture shift elevates value from ownership to usage, anchoring the hardware as a service market in outcome-based economics and tilting competitive advantage toward vendors that bundle analytics and financing expertise.
On-premises deployments held a 44.85% share in 2025, a testament to compliance and latency sensitivities in industries such as finance and healthcare. Yet the hybrid/network-as-a-service model grows at 25.9% CAGR because it fuses local control with cloud elasticity. Lenovo's ThinkAgile MX455 V3 lets customers place AI inference at the edge while bursting training workloads to Azure, demonstrating how workload portability defines modern procurement.
Cloud-managed hardware services remain crucial for burst capacity and simplified updates, but data sovereignty law keeps certain workloads local. IBM's Power Virtual Server on-premise pod shows that even public-cloud vendors are packaging localized subscriptions to satisfy sovereignty mandates. The hardware as a service market is therefore shifting from an either-or mindset to a continuum where assets can relocate dynamically.
The Hardware As A Service Market Report is Segmented by Offering (Device-As-A-Service, Desktop/PC-as-a-Service, and More), Deployment Mode (On-Premises, Cloud-Managed, Hybrid/Network-as-a-Service), End-User Enterprise Size (Large Enterprises, Smes), End-User Industry (Retail and Wholesale, Education, and More), and Geography. The Market Forecasts are Provided in Terms of Value (USD).
Geography Analysis
North America retained a 41.72% share of the hardware as a service market in 2025, sustained by sophisticated leasing ecosystems and federal incentives that reward domestic production. Over half of U.S. equipment procurement already flows through leases, reinforcing subscription maturity. Government grants supporting semiconductor and advanced manufacturing multiply demand for flexible robotics and edge devices.
Asia-Pacific is the fastest-growing region, posting a 19.15% CAGR. China's equipment renewal plan that aims for 25% growth in capital goods spending by 2027, and India's data-center expansion to support digital payments, will generate robust subscription pipelines. Taiwan's dominance in server manufacturing supplies the global logistics chain for device-as-a-service fleets, further entwining the region with global hardware as a service market expansion
Europe's trajectory hinges on circular-economy regulations that push organizations toward service-based ownership. The Ecodesign for Sustainable Products Regulation effective July 2024 requires long life, repairability, and spare-parts availability, aligning directly with service contracts that embed maintenance. Providers adept at managing take-back loops and refurbishment enjoy regulatory tailwinds, marking Europe as a laboratory for sustainability-driven subscription innovation.
- Dell Technologies Inc.
- HP Inc.
- Lenovo Group Limited
- Fujitsu Limited
- Microsoft Corporation
- Cisco Systems, Inc.
- Amazon.com, Inc. (AWS Devices & Services)
- Hewlett Packard Enterprise Company
- Arrow Electronics, Inc.
- Ingram Micro Inc.
- Navitas Credit Corp.
- PhoenixNAP, LLC
- FUSE3 Communications, LLC
- Design Data Systems, Inc.
- Machado Consulting, Inc.
- Managed IT Solutions, Inc.
- Formic Technologies, Inc.
- Flex Ltd.
- Zscaler, Inc.
- Google LLC (ChromeOS & DaaS alliances)
Additional Benefits:
- The market estimate (ME) sheet in Excel format
- 3 months of analyst support
TABLE OF CONTENTS
1 Global Hardware-as-a-Service (HaaS) Market
2 INTRODUCTION
- 2.1 Study Assumptions and Market Definition
- 2.2 Scope of the Study
3 RESEARCH METHODOLOGY
4 EXECUTIVE SUMMARY
5 MARKET LANDSCAPE
- 5.1 Market Overview
- 5.2 Market Drivers
- 5.2.1 Enterprises shifting CapEx to OpEx through subscription-based hardware procurement
- 5.2.2 Device lifecycle shortening under hybrid-work security mandates
- 5.2.3 Rising VC funding and asset-backed securitisation models for industrial HaaS
- 5.2.4 Government on-shoring incentives accelerating automation via HaaS
- 5.2.5 Circular-economy regulations favouring product-as-a-service
- 5.2.6 Embedded IoT-analytics enabling predictive-maintenance contracts
- 5.3 Market Restraints
- 5.3.1 Limited SME awareness of HaaS total-cost benefits
- 5.3.2 Vendor lock-in and complex exit terms
- 5.3.3 Rising cost of capital compressing provider margins
- 5.3.4 Non-uniform accounting rules for subscription hardware assets
- 5.4 Industry Value / Supply-Chain Analysis
- 5.5 Regulatory Landscape
- 5.6 Technological Outlook
- 5.7 Porter's Five Forces Analysis
- 5.7.1 Bargaining Power of Suppliers
- 5.7.2 Bargaining Power of Consumers
- 5.7.3 Threat of New Entrants
- 5.7.4 Threat of Substitutes
- 5.7.5 Intensity of Competitive Rivalry
6 MARKET SIZE AND GROWTH FORECASTS (VALUE)
- 6.1 By Offering
- 6.1.1 Hardware Model
- 6.1.1.1 Device-as-a-Service (DaaS)
- 6.1.1.2 Desktop/PC-as-a-Service
- 6.1.1.3 Infrastructure-Hardware-as-a-Service (I-HaaS)
- 6.1.1.4 Platform-Hardware-as-a-Service (P-HaaS)
- 6.1.1.5 Robot-as-a-Service (RaaS)
- 6.1.1.6 GPU-as-a-Service (GPUaaS)
- 6.1.2 Professional Services
- 6.1.1 Hardware Model
- 6.2 By Deployment Mode
- 6.2.1 On-premises
- 6.2.2 Cloud-managed
- 6.2.3 Hybrid / Network-as-a-Service
- 6.3 By End-user Enterprise Size
- 6.3.1 Large Enterprises
- 6.3.2 SMEs
- 6.4 By End-User Industry
- 6.4.1 Retail and Wholesale
- 6.4.2 Education
- 6.4.3 Banking, Financial Services and Insurance (BFSI)
- 6.4.4 Manufacturing
- 6.4.5 Healthcare and Life Sciences
- 6.4.6 IT and Telecommunications
- 6.4.7 Government and Public Sector
- 6.4.8 Other Industries (Energy, Construction, etc.)
- 6.5 By Geography
- 6.5.1 North America
- 6.5.1.1 United States
- 6.5.1.2 Canada
- 6.5.1.3 Mexico
- 6.5.2 Europe
- 6.5.2.1 Germany
- 6.5.2.2 United Kingdom
- 6.5.2.3 France
- 6.5.2.4 Russia
- 6.5.2.5 Rest of Europe
- 6.5.3 Asia-Pacific
- 6.5.3.1 China
- 6.5.3.2 Japan
- 6.5.3.3 India
- 6.5.3.4 South Korea
- 6.5.3.5 Australia
- 6.5.3.6 Rest of Asia-Pacific
- 6.5.4 Middle East and Africa
- 6.5.4.1 Middle East
- 6.5.4.1.1 Saudi Arabia
- 6.5.4.1.2 United Arab Emirates
- 6.5.4.1.3 Rest of Middle East
- 6.5.4.2 Africa
- 6.5.4.2.1 South Africa
- 6.5.4.2.2 Egypt
- 6.5.4.2.3 Rest of Africa
- 6.5.4.1 Middle East
- 6.5.5 South America
- 6.5.5.1 Brazil
- 6.5.5.2 Argentina
- 6.5.5.3 Rest of South America
- 6.5.1 North America
7 COMPETITIVE LANDSCAPE
- 7.1 Market Concentration
- 7.2 Strategic Moves
- 7.3 Market Share Analysis
- 7.4 Company Profiles (includes Global level Overview, Market level overview, Core Segments, Financials as available, Strategic Information, Market Rank/Share for key companies, Products and Services, and Recent Developments)
- 7.4.1 Dell Technologies Inc.
- 7.4.2 HP Inc.
- 7.4.3 Lenovo Group Limited
- 7.4.4 Fujitsu Limited
- 7.4.5 Microsoft Corporation
- 7.4.6 Cisco Systems, Inc.
- 7.4.7 Amazon.com, Inc. (AWS Devices & Services)
- 7.4.8 Hewlett Packard Enterprise Company
- 7.4.9 Arrow Electronics, Inc.
- 7.4.10 Ingram Micro Inc.
- 7.4.11 Navitas Credit Corp.
- 7.4.12 PhoenixNAP, LLC
- 7.4.13 FUSE3 Communications, LLC
- 7.4.14 Design Data Systems, Inc.
- 7.4.15 Machado Consulting, Inc.
- 7.4.16 Managed IT Solutions, Inc.
- 7.4.17 Formic Technologies, Inc.
- 7.4.18 Flex Ltd.
- 7.4.19 Zscaler, Inc.
- 7.4.20 Google LLC (ChromeOS & DaaS alliances)
8 MARKET OPPORTUNITIES AND FUTURE TRENDS
- 8.1 White-space and Unmet-need Assessment
 2026-2030年全球基礎設施即服務(IaaS)市場
 基礎設施即服務 (IaaS) 市場報告:按部署類型、解決方案、最終用戶、產業和地區分類 (2026–2034)
 硬體即服務 (HaaS) 市場:2026-2032 年全球市場預測(按組件、部署類型、最終用戶產業和組織規模分類)IaaS(基礎設施即服務)市場:按服務模式、工作負載、定價模式、銷售管道、部署類型、組織規模和產業分類-2026-2032年全球市場預測
 全球基礎設施即服務 (IaaS) 市場:市場規模、佔有率、趨勢和成長分析 (2026-2034)
 基礎設施即服務 (IaaS) 市場:按元件、部署類型、使用者類型、產業和地區分類
 2026年全球硬體即服務市場報告2026年全球基礎設施即服務(IaaS)市場報告全球硬體即服務市場規模、佔有率、趨勢和成長分析報告(2026-2034年)2026年全球硬體人工智慧(AI)市場報告