


 |
市場調查報告書
商品編碼
2124938
系統整合:市場佔有率分析、產業趨勢與統計、成長預測(2026-2031)System Integration - Market Share Analysis, Industry Trends & Statistics, Growth Forecasts (2026 - 2031) |
||||||

※ 本網頁內容可能與最新版本有所差異。詳細情況請與我們聯繫。
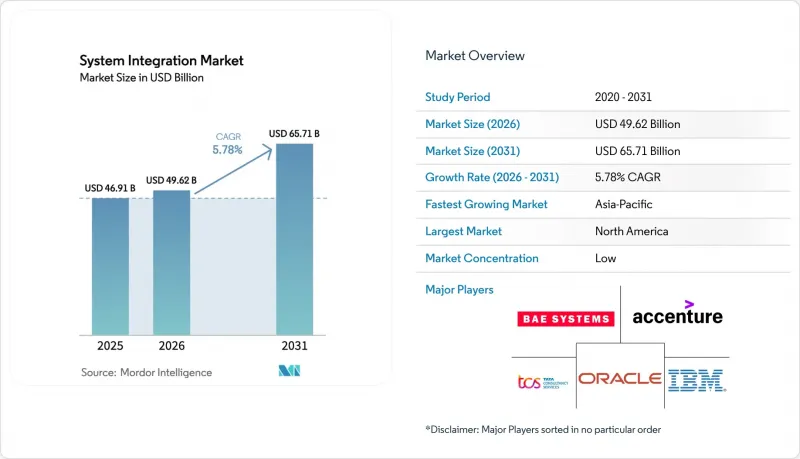
據 Mordor Intelligence 稱,2025 年系統整合市場價值為 469.1 億美元,預計到 2031 年將達到 657.1 億美元,而 2026 年為 496.2 億美元,預測期(2026-2031 年)的複合年成長率為 5.78%。
本報告按服務類型(基礎設施整合、諮詢顧問及其他)、部署模式(本地部署、雲端部署)、最終用戶產業(製造業、汽車業及其他)、整合類型(設備/物聯網整合及其他)、組織規模(大型企業、中小企業)和地區進行細分。市場預測以美元計價。
全球系統整合市場趨勢與洞察
遷移到混合式多重雲端整合架構
目前,企業在維護本地環境的同時,將工作負載分佈在三個或更多超大規模資料中心業者。 2025 年的一項調查證實了這一趨勢,該調查顯示,72% 的大型企業將採用多重雲端。因此,能夠連接不同 API、身分模型和資料主權約束的整合平台正成為重要的策略控制層。金融機構正在將客戶資料拆分到獨立的雲端平台,同時將分析業務外包給全球供應商,從而顯著增加了整合觸點。歐洲中央銀行 (ECB) 發布的 2024 年外包指南要求制定退出策略並互通性,這進一步加速了對編配的投資。架構師正在轉向事件驅動設計和服務網格,以抽象化基礎設施,從而在混合環境中實現近乎即時的資料架構。
由於 5G 和邊緣運算的引入,對低延遲編配的需求日益成長。
獨立組網的5G網路正將運算推向邊緣,毫秒級的延遲限制使得往返中央資料中心的通訊變得不可接受。 2025年中期,全球5G用戶數將達到19億,網路切片將為各產業創建專用通訊通道。製造工廠正在部署邊緣閘道器,用於預處理感測器數據,然後將其與雲端的ERP(企業資源計劃)系統同步。電信業者正在對其營運支援系統平台進行現代化改造,以開放5G核心API,從而推動對營運商級中間件的需求。國際電信聯盟(ITU)於2024年最終確定的IMT-2020標準規定了整合供應商必須滿足的超高可靠性和低延遲通訊基準。因此,從邊緣到雲端的編配對於實現5G投資的盈利至關重要,而不應將其視為可有可無的升級選項。
整合架構師短缺問題日益嚴重。
根據LinkedIn的數據,2025年整合架構師的職缺數量年增34%,但招募的平均時間仍超過60天。儘管合約和股票選擇權會增加專案預算,但由於對行業特定知識的需求,候選人庫正在進一步縮小。雖然在許多IT領域,使用海外人才可以降低成本,但在需要與本地團隊協調時區的混合整合工作中,其效果有限。企業正在嘗試採用低程式碼工具來最大限度地利用有限的人才,但這些平台在高度客製化的舊有系統環境中表現不佳。預計這種人才短缺狀況將持續到2028年,從而限制市場擴張的速度。
細分市場分析
到2025年,基礎設施整合將佔系統整合市場佔有率的45.61%,凸顯了在混合環境中編配伺服器、儲存和網路的重要性。由於金融機構和政府機構繼續依賴管理嚴格的本地資料中心,因此佈線、虛擬化和容錯設計的收入仍然強勁。供應商目前正將監控、修補程式和容量規劃納入基本契約中,這延長了合約期限並穩定了收入來源。
同時,應用和軟體整合市場正以6.33%的複合年成長率持續成長,預計到2031年將維持這一成長動能。這是因為企業傾向於採用「API優先」模式,將行動應用程式和分析功能與後端核心解耦。這種轉變模糊了基礎設施層和應用層之間的界限,因為同一個編配引擎既管理Kubernetes叢集,也管理閘道器端點。 IBM在2023年以46億美元收購Apptio,凸顯了市場對能夠簡化整合預算的成本管治工具的需求。能夠將基礎設施配置和應用連接打包成單一託管服務的供應商正在系統整合市場中不斷擴大市場佔有率。
到2025年,本地部署佔總收入的59.16%。這反映了資料主權法規以及支援受監管工作負載的中間件的龐大部署基礎。在對邊緣節點進行現代化改造的同時,銀行和公共機構正在透過優先控制關鍵任務整合中心的實體位置來延長其資本支出週期。這種做法體現了其希望保持對關鍵基礎設施的直接監管和安全,確保可靠性,並最大限度地降低與外部依賴相關的潛在風險。
受其極具吸引力的訂閱定價、自動擴展和持續續訂功能等因素的推動,基於雲端的整合平台預計到2031年將以6.16%的複合年成長率成長。 MuleSoft的報告顯示,到2025年,64%的新部署將是雲端原生部署,高於兩年前的48%。歐盟資料保護法將於2025年9月生效,該法案將賦予企業資料可攜權,降低轉換成本,並鼓勵創新措施。混合控制平面模式(資料保留在本地,而編配邏輯在雲端運作)目前已成為許多概念驗證(PoC)專案的基礎,從而擴大了整個系統整合市場。
區域分析
到2025年,北美將佔據系統整合市場38.91%的主導佔有率。這主要得益於聯邦政府對零信任的強制性要求以及銀行業務的現代化。美國管理和預算辦公室(OMB)正致力於在混合環境中落實詳細的政策,並強調以身分為中心的控制措施。同時,加拿大公司也正在調整其隱私框架,使其與跨境合作夥伴的框架保持一致。
預計到2031年,亞太地區的複合年成長率將達到6.83%,在所有地區中成長最高。中國的「新基建」計畫正在資助5G、工業網際網路和資料中心的建設,所有這些都需要強大的編配。印度的統一支付介面(UPI)到2025年12月將處理114億筆交易,生動地展現了即時整合工作負載的規模。日本和韓國正在加速建立智慧工廠和自動駕駛汽車生態系統,從邊緣到雲端,每個生態系統的複雜性都在增加。
在歐洲,受《數位營運彈性法案》和NIS2的推動,預計將實現穩定成長。這兩項法案強制要求進行文件記錄、事件報告和第三方風險測試。德國在汽車和機械領域的IT與OT融合方面主導;法國正在擴展開放銀行API;而英國則面臨著跨境編配成本上升的問題,同時還要應對脫歐後監管方面的差異。儘管南美洲、中東和非洲的市場佔有率仍然較小,但巴西、阿拉伯聯合大公國和沙烏地阿拉伯的智慧城市和能源網專案正在穩步擴大全球系統整合市場。
其他好處
- Excel格式的市場預測(ME)表
- 3個月的分析師支持
目錄
第1章:引言
- 研究假設和市場定義
- 調查範圍
第2章:調查方法
第3章執行摘要
第4章 市場狀況
- 市場概覽
- 市場促進因素
- 遷移到混合式多重雲端整合架構
- 由於 5G 和邊緣運算的引入,對低延遲編配的需求日益成長。
- 智慧製造領域中資訊科技與營運技術(OT)的快速融合
- 網路安全合規義務(例如,NIS2、CISA SBOM)
- 由於海底電纜升級,營運商級軟體需要進行平台遷移。
- AI驅動的「整合平台即代碼」縮短了價值創造的時間。
- 市場限制因素
- 整合架構師短缺問題日益嚴重。
- 舊有系統中的技術債導致成本超支
- 與超大規模資料中心業者整合服務相關的供應商鎖定風險
- 由於範圍 3 的 ESG 報告負擔加重,導致資本投資延遲。
- 產業價值鏈分析
- 監理情勢
- 技術展望
- 宏觀經濟因素對市場的影響
- 波特五力分析
第5章 市場規模與成長預測
- 按服務類型
- 基礎設施整合
- 應用和軟體整合
- 諮詢和顧問服務
- 部署模式
- 現場
- 雲
- 按最終用戶行業分類
- 資訊科技/通訊
- BFSI
- 醫療保健和生命科學
- 製造業
- 政府/公共產業
- 能源和石油天然氣
- 零售與電子商務
- 航太/國防
- 車
- 其他
- 整合類型
- 資料整合
- 流程/工作流程整合
- 應用程式/API整合
- 設備/物聯網整合
- 按組織規模
- 大公司
- 小型企業
- 按地區
- 北美洲
- 美國
- 加拿大
- 墨西哥
- 南美洲
- 巴西
- 阿根廷
- 其他南美國家
- 歐洲
- 英國
- 德國
- 法國
- 義大利
- 其他歐洲國家
- 亞太地區
- 中國
- 日本
- 印度
- 韓國
- 其他亞太國家
- 中東和非洲
- 中東
- 阿拉伯聯合大公國
- 沙烏地阿拉伯
- 其他中東國家
- 非洲
- 南非
- 埃及
- 其他非洲地區
- 中東
- 北美洲
第6章 競爭情勢
- 市場集中度
- 策略趨勢
- 市佔率分析
- 公司簡介
- Accenture plc
- IBM Corporation
- Tata Consultancy Services Limited
- Oracle Corporation
- BAE Systems plc
- Wipro Limited
- Cognizant Technology Solutions Corporation
- Deloitte Touche Tohmatsu Limited
- Infosys Limited
- MDS Systems Integration
- Capgemini SE
- Tech Mahindra Limited
- Siemens AG
- Fujitsu Limited
- CGI Inc.
- DXC Technology Company
- Cisco Systems, Inc.
- HCL Technologies Limited
- Hitachi Vantara LLC
- Atos SE
- SAP SE
- NEC Corporation
- NTT DATA Corporation
- EPAM Systems, Inc.
- MuleSoft LLC
- Red Hat, Inc.
第7章 市場機會與未來展望
According to Mordor Intelligence, the system integration market size was valued at USD 46.91 billion in 2025 and estimated to grow from USD 49.62 billion in 2026 to reach USD 65.71 billion by 2031, at a CAGR of 5.78% during the forecast period (2026-2031).
This report is Segmented by Service Type (Infrastructure Integration, Consulting and Advisory, and More), Deployment Mode (On-Premise, and Cloud), End-User Industry (Manufacturing, Automotive, and More), Integration Type (Device/IoT Integration, and More), Organization Size (Large Enterprises, and Small and Medium Enterprises), and Geography. The Market Forecasts are Provided in Terms of Value (USD).
Global System Integration Market Trends and Insights
Shift to Hybrid-Multi-Cloud Integration Architectures
Enterprises now distribute workloads across three or more hyperscalers alongside retained on-premise estates, a pattern confirmed by a 2025 survey that found multi-cloud usage rising to 72% of large firms. Integration platforms that translate divergent APIs, identity models, and data-sovereignty constraints have therefore become strategic control planes. Financial institutions split customer data onto sovereign clouds while offloading analytics to global providers, multiplying integration touchpoints. The European Central Bank's 2024 outsourcing guidelines require exit strategies and interoperability, further accelerating orchestration spending. Architects are pivoting toward event-driven designs and service meshes that abstract infrastructure, enabling near-real-time data fabrics across hybrid landscapes.
5G and Edge-Computing Roll-Outs Demanding Low-Latency Orchestration
Standalone 5G networks push compute to the edge, where millisecond latency budgets prohibit round-trips to central data centers. Global 5G subscriptions hit 1.9 billion in mid-2025, with network slicing creating dedicated industrial lanes. Manufacturing plants deploy edge gateways that preprocess sensor data before syncing it with enterprise resource planning systems in the cloud. Telecom operators are re-platforming operations-support systems to expose 5G core APIs, driving demand for carrier-grade middleware. ITU's IMT-2020 standards, finalized in 2024, codify ultra-reliable low-latency communication benchmarks that integration vendors must now meet. Edge-to-cloud orchestration is therefore essential for monetizing 5G investments rather than treating it as a discretionary upgrade.
Escalating Talent Shortage of Integration Architects
LinkedIn recorded a 34% year-over-year increase in open integration-architect roles in 2025, yet the median time-to-fill still exceeded 60 days. Signing bonuses and equity grants inflate project budgets, while sector-specific knowledge demands narrow the candidate pool further. Offshore staffing mitigates costs in many IT domains but provides limited relief for hybrid-integration work that requires time-zone alignment with on-premises teams. Enterprises are experimenting with low-code tools to stretch scarce talent, though such platforms falter in deeply customized legacy estates. The shortage is expected to persist through 2028, capping the attainable speed of market expansion.
Other drivers and restraints analyzed in the detailed report include:
- Rapid IT-OT Convergence in Smart Manufacturing
- Cyber-Security Compliance Mandates
- Cost Overruns from Technical Debt in Legacy Estates
For complete list of drivers and restraints, kindly check the Table Of Contents.
Segment Analysis
Infrastructure integration accounted for 45.61% of the system integration market share in 2025, underscoring the need to orchestrate servers, storage, and networks across hybrid estates. Financial institutions and government agencies still depend on tightly controlled on-premise hubs, so revenue from cabling, virtualization, and resiliency engineering remains steady. Providers now bundle monitoring, patching, and capacity planning into outcome-based contracts, lengthening engagement tenures and smoothing revenue flow.
Application and software integration, meanwhile, is expanding at a 6.33% CAGR through 2031 as enterprises favor API-first models that decouple mobile apps and analytics from back-end cores. The pivot blurs the lines between the infrastructure and application layers because the same orchestration engines manage both Kubernetes clusters and gateway endpoints. IBM's USD 4.6 billion acquisition of Apptio in 2023 highlighted demand for cost-governance tools that rationalize integration budgets. Vendors that can package infrastructure provisioning with application connectivity into a single managed service are capturing a growing share of the system integration market.
On-premises installations accounted for 59.16% of 2025 revenue, reflecting data-sovereignty rules and the substantial installed base of middleware supporting regulated workloads. Even as they modernize edge nodes, banks and public agencies are extending capital investment cycles by favoring physical control over mission-critical integration hubs. This approach reflects their preference for maintaining direct oversight and security of critical infrastructure, ensuring reliability and minimizing potential risks associated with external dependencies.
Cloud-based integration platforms are growing at a 6.16% CAGR to 2031 as subscription pricing, auto-scaling, and continuous updates prove attractive to mid-market firms. MuleSoft reported that 64% of its new deployments were cloud-native in 2025, up from 48% two years earlier. The European Union Data Act, effective September 2025, grants enterprises data-portability rights, lowering switching costs and encouraging experimentation. Hybrid control-plane patterns, where data stays on-premises but orchestration logic runs in the cloud, now anchor many proofs of concept and expand the overall system integration market.
Complete Report Scope:
- By Service Type
- Infrastructure Integration
- Application and Software Integration
- Consulting and Advisory
- By Deployment Mode
- On-Premise
- Cloud
- By End-User Industry
- IT and Telecom
- BFSI
- Healthcare and Life Sciences
- Manufacturing
- Government and Utilities
- Energy and Oil and Gas
- Retail and E-Commerce
- Aerospace and Defense
- Automotive
- Other End-User Industries
- By Integration Type
- Data Integration
- Process / Workflow Integration
- Application / API Integration
- Device / IoT Integration
- By Organization Size
- Large Enterprises
- Small and Medium Enterprises
- By Geography
- North America
- United States
- Canada
- Mexico
- South America
- Brazil
- Argentina
- Rest of South America
- Europe
- United Kingdom
- Germany
- France
- Italy
- Rest of Europe
- Asia Pacific
- China
- Japan
- India
- South Korea
- Rest of Asia Pacific
- Middle East and Africa
- Middle East
- United Arab Emirates
- Saudi Arabia
- Rest of Middle East
- Africa
- South Africa
- Egypt
- Rest of Africa
- Middle East
- North America
Geography Analysis
In 2025, North America commanded a dominant 38.91% share of the system integration market, driven by federal zero-trust mandates and a push for banking modernization. The U.S. Office of Management and Budget emphasizes identity-centric controls, relying on detailed policy enforcement across hybrid environments. Meanwhile, Canadian companies are aligning their privacy frameworks with those of their cross-border counterparts.
Asia-Pacific is projected to grow at a 6.83% CAGR through 2031, the fastest among regions. China's New Infrastructure program funds 5G, the industrial internet, and data-center builds, all of which require robust orchestration. India's Unified Payments Interface processed 11.4 billion transactions in December 2025, showcasing the scale of real-time integration workloads. Japan and South Korea accelerate smart-factory and autonomous-vehicle ecosystems, each adding edge-to-cloud complexity.
Europe contributes steady growth driven by the Digital Operational Resilience Act and NIS2, which together enforce documentation, incident reporting, and third-party risk testing. Germany spearheads IT-OT convergence in automotive and machinery, France expands open-banking APIs, and the United Kingdom navigates post-Brexit divergence that elevates cross-border orchestration costs. South America, the Middle East, and Africa remain smaller slices, yet smart-city and energy-grid projects in Brazil, the United Arab Emirates, and Saudi Arabia steadily expand the global system integration market.
- Accenture plc
- IBM Corporation
- Tata Consultancy Services Limited
- Oracle Corporation
- BAE Systems plc
- Wipro Limited
- Cognizant Technology Solutions Corporation
- Deloitte Touche Tohmatsu Limited
- Infosys Limited
- MDS Systems Integration
- Capgemini SE
- Tech Mahindra Limited
- Siemens AG
- Fujitsu Limited
- CGI Inc.
- DXC Technology Company
- Cisco Systems, Inc.
- HCL Technologies Limited
- Hitachi Vantara LLC
- Atos SE
- SAP SE
- NEC Corporation
- NTT DATA Corporation
- EPAM Systems, Inc.
- MuleSoft LLC
- Red Hat, Inc.
Additional Benefits:
- The market estimate (ME) sheet in Excel format
- 3 months of analyst support
TABLE OF CONTENTS
1 INTRODUCTION
- 1.1 Study Assumptions and Market Definition
- 1.2 Scope of the Study
2 RESEARCH METHODOLOGY
3 EXECUTIVE SUMMARY
4 MARKET LANDSCAPE
- 4.1 Market Overview
- 4.2 Market Drivers
- 4.2.1 Shift to Hybrid-Multi-Cloud Integration Architectures
- 4.2.2 5G and Edge-Computing Roll-Outs Demanding Low-Latency Orchestration
- 4.2.3 Rapid IT-OT Convergence in Smart Manufacturing
- 4.2.4 Cyber-Security Compliance Mandates (e.g., NIS2, CISA SBOM)
- 4.2.5 Under-Sea Cable Upgrades Forcing Carrier-Grade Software Re-Platforming
- 4.2.6 AI-Driven "Integration-Platform-as-Code" Reducing Time-to-Value
- 4.3 Market Restraints
- 4.3.1 Escalating Talent Shortage of Integration Architects
- 4.3.2 Cost Overruns from Technical Debt in Legacy Estates
- 4.3.3 Vendor-Lock-In Risk with Hyperscaler Integration Services
- 4.3.4 Rising Scope-3 ESG Reporting Burden Delaying Capex
- 4.4 Industry Value Chain Analysis
- 4.5 Regulatory Landscape
- 4.6 Technological Outlook
- 4.7 Impact of Macroeconomic Factors on the Market
- 4.8 Porter's Five Forces Analysis
- 4.8.1 Bargaining Power of Suppliers
- 4.8.2 Bargaining Power of Buyers/Consumers
- 4.8.3 Threat of New Entrants
- 4.8.4 Threat of Substitutes
- 4.8.5 Intensity of Competitive Rivalry
5 MARKET SIZE AND GROWTH FORECASTS (VALUE)
- 5.1 By Service Type
- 5.1.1 Infrastructure Integration
- 5.1.2 Application and Software Integration
- 5.1.3 Consulting and Advisory
- 5.2 By Deployment Mode
- 5.2.1 On-Premise
- 5.2.2 Cloud
- 5.3 By End-User Industry
- 5.3.1 IT and Telecom
- 5.3.2 BFSI
- 5.3.3 Healthcare and Life Sciences
- 5.3.4 Manufacturing
- 5.3.5 Government and Utilities
- 5.3.6 Energy and Oil and Gas
- 5.3.7 Retail and E-Commerce
- 5.3.8 Aerospace and Defense
- 5.3.9 Automotive
- 5.3.10 Other End-User Industries
- 5.4 By Integration Type
- 5.4.1 Data Integration
- 5.4.2 Process / Workflow Integration
- 5.4.3 Application / API Integration
- 5.4.4 Device / IoT Integration
- 5.5 By Organization Size
- 5.5.1 Large Enterprises
- 5.5.2 Small and Medium Enterprises
- 5.6 By Geography
- 5.6.1 North America
- 5.6.1.1 United States
- 5.6.1.2 Canada
- 5.6.1.3 Mexico
- 5.6.2 South America
- 5.6.2.1 Brazil
- 5.6.2.2 Argentina
- 5.6.2.3 Rest of South America
- 5.6.3 Europe
- 5.6.3.1 United Kingdom
- 5.6.3.2 Germany
- 5.6.3.3 France
- 5.6.3.4 Italy
- 5.6.3.5 Rest of Europe
- 5.6.4 Asia Pacific
- 5.6.4.1 China
- 5.6.4.2 Japan
- 5.6.4.3 India
- 5.6.4.4 South Korea
- 5.6.4.5 Rest of Asia Pacific
- 5.6.5 Middle East and Africa
- 5.6.5.1 Middle East
- 5.6.5.1.1 United Arab Emirates
- 5.6.5.1.2 Saudi Arabia
- 5.6.5.1.3 Rest of Middle East
- 5.6.5.2 Africa
- 5.6.5.2.1 South Africa
- 5.6.5.2.2 Egypt
- 5.6.5.2.3 Rest of Africa
- 5.6.5.1 Middle East
- 5.6.1 North America
6 COMPETITIVE LANDSCAPE
- 6.1 Market Concentration
- 6.2 Strategic Moves
- 6.3 Market Share Analysis
- 6.4 Company Profiles (includes Global Level Overview, Market Level Overview, Core Segments, Financials as available, Strategic Information, Market Rank/Share, Products and Services, Recent Developments)
- 6.4.1 Accenture plc
- 6.4.2 IBM Corporation
- 6.4.3 Tata Consultancy Services Limited
- 6.4.4 Oracle Corporation
- 6.4.5 BAE Systems plc
- 6.4.6 Wipro Limited
- 6.4.7 Cognizant Technology Solutions Corporation
- 6.4.8 Deloitte Touche Tohmatsu Limited
- 6.4.9 Infosys Limited
- 6.4.10 MDS Systems Integration
- 6.4.11 Capgemini SE
- 6.4.12 Tech Mahindra Limited
- 6.4.13 Siemens AG
- 6.4.14 Fujitsu Limited
- 6.4.15 CGI Inc.
- 6.4.16 DXC Technology Company
- 6.4.17 Cisco Systems, Inc.
- 6.4.18 HCL Technologies Limited
- 6.4.19 Hitachi Vantara LLC
- 6.4.20 Atos SE
- 6.4.21 SAP SE
- 6.4.22 NEC Corporation
- 6.4.23 NTT DATA Corporation
- 6.4.24 EPAM Systems, Inc.
- 6.4.25 MuleSoft LLC
- 6.4.26 Red Hat, Inc.
7 MARKET OPPORTUNITIES AND FUTURE OUTLOOK
- 7.1 White-Space and Unmet-Need Assessment

 綜合診斷市場-策略分析與預測(2026-2035)
 2026年全球整合應用市場報告
 亞太、拉丁美洲和歐洲、中東及非洲地區通訊系統整合市場:按解決方案、服務模式、部署類型和最終用戶分類
 系統整合市場規模、佔有率和趨勢分析報告:按服務、企業規模、最終用途、地區和細分市場預測(2026-2033 年)全球系統整合市場規模、佔有率、趨勢和成長分析報告(2026-2034年)系統整合市場:按解決方案、公司規模、產業和地區分類整合診斷市場:按整合形式和產品類型分類2026年全球整合系統市場報告
 整合系統市場機會、成長要素、產業趨勢分析及2026年至2035年預測
 系統整合市場報告(按服務、最終用戶產業和地區分類),2026-2034年