


 |
市場調查報告書
商品編碼
1850178
智慧家庭:市場佔有率分析、產業趨勢、統計數據和成長預測(2025-2030)Smart Homes - Market Share Analysis, Industry Trends & Statistics, Growth Forecasts (2025 - 2030) |
||||||
※ 本網頁內容可能與最新版本有所差異。詳細情況請與我們聯繫。
預計2025年智慧家庭市場規模將達1,442.3億美元,2030年將達3,008.7億美元,複合年成長率為15.8%。
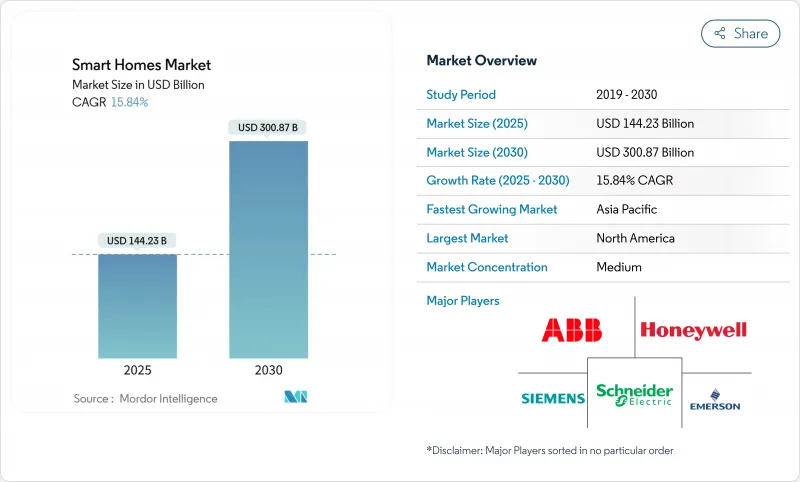
這一成長的驅動力源於能源成本上漲、脫碳政策和技術融合,將連網生活從高階新奇事物轉變為基本的住宅基礎設施。儘管大規模的聯邦激勵措施支撐著北美的領先地位,但亞太地區在都市化和智慧城市計畫的推動下,發展最為迅速。 5G、人工智慧和Matter互通性通訊協定的整合正在消除成本和複雜性障礙,使其應用範圍超越富裕的早期採用者。儘管設備生態系統仍然碎片化,但隨著建築商在新建築中部署互聯基礎設施,以及多用戶住宅開發商採用智慧解決方案來打造差異化物業,平台整合正在加速。
全球智慧家庭市場趨勢與洞察
節能智慧家電的需求不斷增加
不斷上漲的電費和氣候變遷目標正推動消費者轉向可最佳化消費量並提供豐厚稅額扣抵的連網設備。在美國,《通膨控制法》規定,符合資格的熱泵、熱水器和節能控制裝置的購買成本可抵免 30%,從而大大縮短了投資回收期。通用電氣家電的 EcoBalance 平台整合了屋頂太陽能、電池儲能和電動車充電器,可實現全屋編配,從而減少 20-35% 的用電量,並可能透過聯邦效率計劃為屋主帶來高達 4,000 美元的返利。面對電網不穩定,公用事業公司擴大向連網電器所有者支付參與需量反應活動的費用,將廚房和暖通空調系統轉變為分散式能源資產。由此產生的收入流促使他們採用人工智慧來預測減載機會並提高電器的終身價值。
寬頻和5G的採用
高速連接支援可靠的設備性能。 5G固定無線存取已服務美國超過400萬戶家庭,提供光纖級速度,確保即時安全資訊和語音助理的正常運作。 5G邊緣處理降低了安全關鍵功能的延遲,並推動了價格實惠的物聯網感測器的普及。農村社區將最大程度地避免昂貴的「最後一哩路」光纖,從而為傳統邊緣化細分市場打開智慧家庭市場。隨著印度和巴西頻譜競標的加速,智慧家居接入預計將在新興市場擴展。
初期安裝維修成本高
整個家庭系統的成本通常在1.5萬美元到4萬美元之間,儘管其潛在的終身節能潛力,但這對中等收入家庭來說仍然是一個障礙。老舊房屋需要升級面板和重新佈線,這會增加計劃預算。熟練的電氣和暖通空調工人的短缺進一步增加了成本。對於低收入家庭,返利可以抵銷高達80%的支出,但行政管理的複雜性和報銷延遲限制了其有效性。發票償還和綠色抵押貸款等資金籌措可以減輕初期支出,並加速智慧家庭市場的滲透。
細分分析
2024年,門禁、安防和保全將佔總營收的22.1%,這將支撐智慧家庭市場,因為屋主優先考慮防盜和節省保險費用。智慧鎖現已整合生物識別訊息,並為送貨人員生成審核線索。隨著慢性病管理逐漸深入家庭,智慧家庭市場的醫療保健部分預計將成長最快,複合年成長率將達到16.2%。語音控制中心兼具服藥提醒功能,連網聽診器可為臨床醫師提供即時生命徵象數據。公用事業公司正在透過提供自動需量反應帳單需量反應來推動能源管理系統的發展,而智慧暖通空調系統 (HVAC) 正憑藉能夠傳達電網狀況的人工智慧最佳化熱泵獲得發展。控制器和集線器正面臨商品化,Matter 認證可實現跨供應商配對,而差異化則轉向嵌入式分析,用於預測維護並改進舒適度演算法。
新興類別包括智慧廚房,其中人工智慧根據飲食目標和庫存推薦食譜。通用電氣家電 (GE Appliances) 的 Flavorly 服務將食品雜貨訂單與家電設置關聯起來,展現了食品零售與家庭物聯網的融合。照明正從照明轉向符合晝夜節律的頻譜和無需電池運作的能源採集開關發展,從而降低大型住宅建築的維護成本。
到2024年,隨著個人屋主自由選擇設備生態系統並部署全屋套餐,單戶住宅將佔據64.5%的收益。智慧電錶、屋頂太陽能和電池儲能系統與電動車充電器同步,形成自足式的能源節點。多用戶住宅住宅的採用正以16.9%的複合年成長率縮小差距,這得益於資產管理公司尋求提高入住率和營運效率。智慧鎖簡化了單元週轉,能源儀錶板顯示分錶數據,以提高租戶帳單透明度。配備高科技設施的公寓租金溢價5%至25%,激勵了持續投資。隱私保護(例如租戶管理的存取日誌)是租戶接受的關鍵。集中式管理儀錶板使營運商能夠查看其投資組合,並實現預測性維護,從而控制營運費用。
智慧家庭市場報告按組件(家電、門禁控制、安全、安保、照明、能源管理、智慧暖通空調/氣候控制、控制器/集線器、智慧家庭醫療保健、智慧廚房)、住房類型(單戶住宅、多用戶住宅)、安裝類型(新建、維修)、銷售管道(線上、線下)和地區進行細分。
區域分析
在政策獎勵和寬頻普及的支持下,北美佔2024年銷售額的36.4%。包括連網控制在內的節能維修可為每戶家庭節省高達1.4萬美元的開支,有助於推動其普及。加拿大的一個省級計畫借鑒聯邦政府的支持,提供1萬加元的補助金和零息貸款,優先考慮連網熱泵和監控儀錶板。生態系統合作夥伴關係,例如三星的SmartThings Energy,將電動車與家庭電網平衡連接起來,展現了區域在整合整個生態系統方面的領導地位。
受快速都市化和政府主導的智慧城市藍圖的推動,亞太地區是成長最快的地區,複合年成長率高達16.5%。中國小米等本土品牌正推出價格實惠的智慧家庭套餐,推動大眾市場普及。印度的光纖和5G部署正在擴大家庭覆蓋範圍,而新加坡正在試行配備環境感知功能的養老公寓,以提醒看護者。該地區製造地的集中度正在降低材料成本,使新興中產階級能夠輕鬆獲得環境級解決方案,並拓寬智慧家庭市場。
在嚴格的能源指令和注重隱私的法規的推動下,歐洲的智慧家庭應用正在穩步成長。預計到 2022 年,智慧家庭普及率將超過 1.12 億戶,到 2027 年將達到 47%。Schneider Electric的 Wiser Home 平台應用人工智慧預測來減少尖峰時段的消費量,反映出歐洲大陸優先考慮電網穩定性。 GDPR 鼓勵本地資料處理,並鼓勵供應商設計邊緣智慧設備。 Fit-for-55 套餐為購買併網設備的屋主提供獎勵,將多餘的太陽能電力整合到需量反應市場。中東和非洲雖然仍處於起步階段,但正在受益於沙烏地阿拉伯 NEOM 等旗艦智慧城市發展。隨著互聯基礎設施的成熟和消費者習慣於互聯生活,拉丁美洲正在取得進步,巴西在全國推廣智慧電錶就是明證。
其他福利:
- Excel 格式的市場預測 (ME) 表
- 3個月的分析師支持
目錄
第1章 引言
- 研究假設和市場定義
- 調查範圍
第2章調查方法
第3章執行摘要
第4章 市場狀況
- 市場概況
- 市場促進因素
- 節能智慧家電的需求不斷增加
- 寬頻和5G普及率
- 住宅脫碳和能源管理的獎勵
- 老年住房與居家醫療融合的激增
- 透過互通性標準加速生態系(Matter)
- Z 世代購屋推動自動化支出
- 市場限制
- 初始安裝和維修成本高
- 網路安全和資料隱私問題
- 分散的設備生態系統阻礙了普及
- 半導體供應鏈不穩定
- 價值鏈分析
- 技術展望
- 波特五力分析
- 供應商的議價能力
- 買方的議價能力
- 新進入者的威脅
- 替代品的威脅
- 競爭對手之間的競爭
- 評估宏觀經濟趨勢對市場的影響
第5章市場規模及成長預測
- 按組件
- 家電
- 智慧音箱
- 智慧家庭劇院
- 智慧水質淨化器
- 其他家電
- 門禁、安全與安保
- 智慧警報
- 智慧鎖
- 智慧感測器
- 煙霧/危險偵測器
- 智慧攝影機和監控
- 車庫門開啟器等
- 燈光
- 智慧照明
- 智慧燈具
- 環境照明
- 其他照明產品
- 能源管理
- 照明能量控制器
- 中央控制系統
- HVAC 能源控制
- 智慧暖通空調/氣候控制
- 扇子
- 散熱器
- 恆溫器
- 空調
- 控制器/集線器
- DIY 輪轂和麵板
- 專業中心和麵板
- 智慧家庭醫療保健
- 醫療警報系統
- 智慧型血糖儀
- 智慧型心臟監視器
- 智慧廚房
- 智慧冰箱
- 智慧烹調器具和爐灶
- 智慧洗碗機
- 智慧烤箱
- 其他
- 家電
- 依房屋類型
- 獨立式住宅
- 多用戶住宅
- 按安裝類型
- 新建築
- 修改
- 按銷售管道
- 線上
- 離線
- 按地區
- 北美洲
- 美國
- 加拿大
- 墨西哥
- 歐洲
- 德國
- 英國
- 法國
- 義大利
- 西班牙
- 俄羅斯
- 其他歐洲地區
- 亞太地區
- 中國
- 日本
- 印度
- 韓國
- ASEAN
- 澳洲和紐西蘭
- 其他亞太地區
- 南美洲
- 巴西
- 阿根廷
- 其他南美
- 中東和非洲
- 中東
- 沙烏地阿拉伯
- 阿拉伯聯合大公國
- 土耳其
- 其他中東地區
- 非洲
- 南非
- 奈及利亞
- 其他非洲國家
- 北美洲
第6章 競爭態勢
- 市場集中度
- 策略趨勢
- 市佔率分析
- 公司簡介
- ABB Ltd
- Schneider Electric SE
- Honeywell International Inc.
- Emerson Electric Co.
- Siemens AG
- LG Electronics Inc.
- Cisco Systems Inc.
- Google LLC
- Microsoft Corporation
- General Electric Company
- IBM Corporation
- Legrand SA
- Lutron Electronics Co. Inc.
- Samsung Electronics Co., Ltd.
- Control4 Corporation
- Assa Abloy AB
- Amazon.com, Inc.
- Apple Inc.
- Bosch Smart Home GmbH
- Sony Group Corporation
- Faststream Technologies
- Simplisafe Inc.
- Ecobee Inc.
- Signify NV
- ADT Inc.
- Arlo Technologies, Inc.
- Vivint Smart Home, Inc.
- Ring LLC
第7章 市場機會與未來展望
The smart homes market size is valued at USD 144.23 billion in 2025 and is projected to reach USD 300.87 billion by 2030, advancing at a 15.8% CAGR.
The up-swing stems from energy-cost inflation, decarbonization policies, and technology convergence that shift connected living from premium novelty to baseline residential infrastructure. Sizeable federal incentives anchor North America's leadership, while Asia-Pacific delivers the fastest expansion on the back of urbanization and smart-city programs. The convergence of 5G, artificial intelligence, and the Matter interoperability protocol is eroding cost and complexity barriers, broadening adoption beyond affluent early users. Device ecosystems remain fragmented, yet platform integration is accelerating as builders include connected infrastructure in new construction and multi-family operators adopt smart solutions to differentiate properties.
Global Smart Homes Market Trends and Insights
Increasing demand for energy-efficient smart appliances
Rising electricity tariffs and climate targets are propelling consumers toward connected devices that optimize consumption and qualify for generous tax credits. Under the Inflation Reduction Act, U.S. households recoup 30% of purchase costs for qualifying heat pumps, water heaters, and energy-savvy controls, sharply lowering payback periods. GE Appliances' EcoBalance platform integrates rooftop solar, storage, and EV chargers, enabling whole-home orchestration that can trim electricity use 20-35% and earn homeowners rebates up to USD 4,000 through federal efficiency programs. Utilities, facing grid volatility, increasingly pay connected-appliance owners for participating in demand-response events, turning kitchens and HVAC systems into distributed energy assets. The resulting revenue stream motivates manufacturers to embed AI that predicts load-shaving opportunities and boosts lifetime appliance value.
Growing broadband and 5G penetration
High-speed connectivity underpins reliable device performance. 5G Fixed Wireless Access already serves more than 4 million U.S. households and delivers fiber-class speeds that sustain real-time security feeds and voice assistants. Edge processing over 5G cuts latency for safety-critical functions and allows inexpensive IoT sensors to proliferate. Rural communities benefit most, bypassing costly last-mile fiber and unlocking the smart homes market for demographics traditionally left behind. As spectrum auctions accelerate in India and Brazil, comparable infrastructure gains are expected to broaden smart-home accessibility across emerging markets.
High upfront installation and retrofit costs
Total-home systems typically range from USD 15,000-40,000, a hurdle for middle-income adopters despite lifetime energy savings. Older dwellings require panel upgrades and rewiring that inflate project budgets. Skilled-labor shortages in electrical and HVAC trades compound costs. Although rebates can offset as much as 80% for low-income households, paperwork complexity and delayed reimbursements limit efficacy. Financing innovations such as on-bill repayment and green mortgages are emerging to soften initial spend and accelerate penetration of the smart homes market.
Other drivers and restraints analyzed in the detailed report include:
- Incentives for residential decarbonization and energy-management
- Aging-in-place and home-health integration surge
- Cyber-security and data-privacy concerns
For complete list of drivers and restraints, kindly check the Table Of Contents.
Segment Analysis
Access Control, Safety, and Security retained 22.1% of 2024 revenue, underpinning the smart homes market as homeowners prioritize burglary deterrence and insurance savings. Smart locks now integrate biometric credentials and generate audit trails for delivery personnel. The smart homes market size for healthcare components is forecast to expand fastest, climbing at 16.2% CAGR as chronic-disease management shifts into residences. Voice-controlled hubs double as medication coaches, and connected stethoscopes stream real-time vitals to clinicians. Utilities catalyze Energy-Management systems by offering bill credits for automated demand response, while Smart HVAC gains traction through AI-optimized heat pumps that communicate grid conditions. Controllers and hubs face commoditization as Matter certification allows multi-vendor pairing; differentiation is pivoting toward embedded analytics that predict maintenance and refine comfort algorithms.
Emergent categories include smart kitchens where AI recommends recipes aligned with dietary goals and inventory. GE Appliances' Flavorly service links grocery ordering to appliance settings, illustrating convergence between food retail and residential IoT. Lighting is shifting beyond illumination to circadian-friendly spectrums and energy harvesting switches that operate without batteries, lowering maintenance costs for large residences.
Single-family properties controlled 64.5% revenue in 2024 as individual homeowners freely select device ecosystems and implement whole-home packages. Smart meters, rooftop solar, and battery storage sync with EV chargers to form self-contained energy nodes. Multi-family adoption is closing the gap at a 16.9% CAGR, propelled by asset managers seeking higher occupancy and operating efficiency. Smart locks simplify unit turnover, and energy dashboards expose sub-meter data that improve tenant billing transparency. Rent premiums in tech-equipped apartments range between 5-25%, motivating continued investment. Privacy safeguards, including resident-controlled access logs, are central to tenant acceptance. Central management dashboards give operators visibility across portfolios, enabling predictive maintenance that restrains operational expenditure.
The Smart Homes Market Report is Segmented by Components (Consumer Electronics, Access Control, Safety, and Security, Lighting, Energy Management, Smart HVAC / Climate Control, Controllers / Hubs, Smart-Home Healthcare, and Smart Kitchen), Housing Type (Single-Family and Multi-Family), Installation Type (New Construction and Retrofit), Sales Channel (Online and Offline), and Geography.
Geography Analysis
North America commanded 36.4% of 2024 revenue, buoyed by policy incentives and broad broadband coverage. Up to USD 14,000 per household is now recoverable for energy-efficient retrofits that include connected controls, driving mainstream uptake. Provincial programs in Canada mirror federal support, issuing CAD 10,000 grants and zero-interest loans that prioritize connected heat pumps and monitoring dashboards. Ecosystem alliances, such as Samsung's SmartThings Energy linking electric vehicles to home-grid balancing, showcase regional leadership in whole-ecosystem integration.
Asia-Pacific is the fastest-growing arena at 16.5% CAGR, steered by rapid urbanization and government-sponsored smart-city blueprints. China's domestic brands like Xiaomi deliver affordable whole-home bundles, catalyzing mass-market adoption. India's fiber and 5G rollouts expand addressable households, while Singapore pilots senior-care apartments equipped with ambient sensing that alerts caregivers to abnormalities. Manufacturing concentration in the region compresses bill-of-materials costs, making entry-level solutions attainable for emerging middle classes and widening the smart homes market footprint.
Europe exhibits stable uptake, bolstered by stringent energy directives and privacy-centric regulations. Household penetration surpassed 112 million smart homes by 2022, and trajectories point to 47% adoption by 2027. Schneider Electric's Wiser Home platform applies AI forecasting to shave consumption during tariff peaks, reflecting continental emphasis on grid stability. GDPR prompts local data processing, pushing vendors to design edge-intelligent devices. Incentives under the Fit-for-55 package reward homeowners for grid-interactive equipment, integrating solar surplus into demand response markets. The Middle East and Africa, though nascent, benefit from flagship smart-city builds such as Saudi Arabia's NEOM. Latin America progresses as connectivity infrastructure matures and Brazil's nationwide smart-meter rollout accelerates consumer familiarity with connected living.
- ABB Ltd
- Schneider Electric SE
- Honeywell International Inc.
- Emerson Electric Co.
- Siemens AG
- LG Electronics Inc.
- Cisco Systems Inc.
- Google LLC
- Microsoft Corporation
- General Electric Company
- IBM Corporation
- Legrand SA
- Lutron Electronics Co. Inc.
- Samsung Electronics Co., Ltd.
- Control4 Corporation
- Assa Abloy AB
- Amazon.com, Inc.
- Apple Inc.
- Bosch Smart Home GmbH
- Sony Group Corporation
- Faststream Technologies
- Simplisafe Inc.
- Ecobee Inc.
- Signify N.V.
- ADT Inc.
- Arlo Technologies, Inc.
- Vivint Smart Home, Inc.
- Ring LLC
Additional Benefits:
- The market estimate (ME) sheet in Excel format
- 3 months of analyst support
TABLE OF CONTENTS
1 INTRODUCTION
- 1.1 Study Assumptions and Market Definition
- 1.2 Scope of the Study
2 RESEARCH METHODOLOGY
3 EXECUTIVE SUMMARY
4 MARKET LANDSCAPE
- 4.1 Market Overview
- 4.2 Market Drivers
- 4.2.1 Increasing demand for energy-efficient smart appliances
- 4.2.2 Growing broadband and 5G penetration
- 4.2.3 Incentives for residential decarbonisation and energy-management
- 4.2.4 Aging-in-place and home-health integration surge
- 4.2.5 Interoperability standard (Matter) accelerating ecosystem
- 4.2.6 Gen-Z home-ownership driving automation spend
- 4.3 Market Restraints
- 4.3.1 High upfront installation and retrofit costs
- 4.3.2 Cyber-security and data-privacy concerns
- 4.3.3 Fragmented device ecosystems hinder adoption
- 4.3.4 Semiconductor supply-chain volatility
- 4.4 Value Chain Analysis
- 4.5 Technological Outlook
- 4.6 Porter's Five Forces Analysis
- 4.6.1 Bargaining Power of Suppliers
- 4.6.2 Bargaining Power of Buyers
- 4.6.3 Threat of New Entrants
- 4.6.4 Threat of Substitute Products
- 4.6.5 Intensity of Competitive Rivalry
- 4.7 Assessment of the Impact of Macroeconomic Trends on the Market
5 MARKET SIZE AND GROWTH FORECASTS (VALUE)
- 5.1 By Components
- 5.1.1 Consumer Electronics
- 5.1.1.1 Smart Speaker
- 5.1.1.2 Smart Home Theater
- 5.1.1.3 Smart Purifier
- 5.1.1.4 Other Appliances
- 5.1.2 Access Control, Safety and Security
- 5.1.2.1 Smart Alarm
- 5.1.2.2 Smart Locks
- 5.1.2.3 Smart Sensors
- 5.1.2.4 Smoke/ Hazard Detectors
- 5.1.2.5 Smart Cameras and Monitoring
- 5.1.2.6 Garage-Door Operators and Others
- 5.1.3 Lighting
- 5.1.3.1 Smart Lighting
- 5.1.3.2 Smart Lamps and Luminaires
- 5.1.3.3 Ambient Lighting
- 5.1.3.4 Other Lighting Products
- 5.1.4 Energy Management
- 5.1.4.1 Lighting Energy Controllers
- 5.1.4.2 Central Control Systems
- 5.1.4.3 HVAC Energy Controls
- 5.1.5 Smart HVAC / Climate Control
- 5.1.5.1 Fans
- 5.1.5.2 Radiators
- 5.1.5.3 Thermostats
- 5.1.5.4 Air-Conditioners
- 5.1.6 Controllers / Hubs
- 5.1.6.1 DIY Hubs and Panels
- 5.1.6.2 Professional Hubs and Panels
- 5.1.7 Smart-Home Healthcare
- 5.1.7.1 Medical-alert Systems
- 5.1.7.2 Smart Glucose Monitors
- 5.1.7.3 Smart Cardiac Monitors
- 5.1.8 Smart Kitchen
- 5.1.8.1 Smart Refrigerators
- 5.1.8.2 Smart Cookware and Cooktops
- 5.1.8.3 Smart Dishwashers
- 5.1.8.4 Smart Ovens
- 5.1.8.5 Others
- 5.1.1 Consumer Electronics
- 5.2 By Housing Type
- 5.2.1 Single-family
- 5.2.2 Multi-family
- 5.3 By Installation Type
- 5.3.1 New Construction
- 5.3.2 Retrofit
- 5.4 By Sales Channel
- 5.4.1 Online
- 5.4.2 Offline
- 5.5 By Geography
- 5.5.1 North America
- 5.5.1.1 United States
- 5.5.1.2 Canada
- 5.5.1.3 Mexico
- 5.5.2 Europe
- 5.5.2.1 Germany
- 5.5.2.2 United Kingdom
- 5.5.2.3 France
- 5.5.2.4 Italy
- 5.5.2.5 Spain
- 5.5.2.6 Russia
- 5.5.2.7 Rest of Europe
- 5.5.3 Asia-Pacific
- 5.5.3.1 China
- 5.5.3.2 Japan
- 5.5.3.3 India
- 5.5.3.4 South Korea
- 5.5.3.5 ASEAN
- 5.5.3.6 Australia and New Zealand
- 5.5.3.7 Rest of Asia-Pacific
- 5.5.4 South America
- 5.5.4.1 Brazil
- 5.5.4.2 Argentina
- 5.5.4.3 Rest of South America
- 5.5.5 Middle East and Africa
- 5.5.5.1 Middle East
- 5.5.5.1.1 Saudi Arabia
- 5.5.5.1.2 UAE
- 5.5.5.1.3 Turkey
- 5.5.5.1.4 Rest of Middle East
- 5.5.5.2 Africa
- 5.5.5.2.1 South Africa
- 5.5.5.2.2 Nigeria
- 5.5.5.2.3 Rest of Africa
- 5.5.1 North America
6 COMPETITIVE LANDSCAPE
- 6.1 Market Concentration
- 6.2 Strategic Moves
- 6.3 Market Share Analysis
- 6.4 Company Profiles (includes Global level Overview, Market level overview, Core Segments, Financials as available, Strategic Information, Market Rank/Share, Products and Services, Recent Developments)
- 6.4.1 ABB Ltd
- 6.4.2 Schneider Electric SE
- 6.4.3 Honeywell International Inc.
- 6.4.4 Emerson Electric Co.
- 6.4.5 Siemens AG
- 6.4.6 LG Electronics Inc.
- 6.4.7 Cisco Systems Inc.
- 6.4.8 Google LLC
- 6.4.9 Microsoft Corporation
- 6.4.10 General Electric Company
- 6.4.11 IBM Corporation
- 6.4.12 Legrand SA
- 6.4.13 Lutron Electronics Co. Inc.
- 6.4.14 Samsung Electronics Co., Ltd.
- 6.4.15 Control4 Corporation
- 6.4.16 Assa Abloy AB
- 6.4.17 Amazon.com, Inc.
- 6.4.18 Apple Inc.
- 6.4.19 Bosch Smart Home GmbH
- 6.4.20 Sony Group Corporation
- 6.4.21 Faststream Technologies
- 6.4.22 Simplisafe Inc.
- 6.4.23 Ecobee Inc.
- 6.4.24 Signify N.V.
- 6.4.25 ADT Inc.
- 6.4.26 Arlo Technologies, Inc.
- 6.4.27 Vivint Smart Home, Inc.
- 6.4.28 Ring LLC
7 MARKET OPPORTUNITIES AND FUTURE OUTLOOK
- 7.1 White-space and Unmet-need Assessment
 智慧家庭市場:2026-2032年全球市場預測(按產品、使用者介面、應用、分銷管道和最終用戶分類)
 智慧家庭市場規模、佔有率、趨勢和預測:按組件、應用和地區分類,2026-2034 年
 2026年全球單戶智慧家庭市場報告2026年全球多用戶住宅及其他住宅開發市場報告2026年全球智慧公寓市場報告2026年全球智慧別墅市場報告2026年全球機器人預製住宅建造商市場報告2026年全球產品召回計畫市場報告
 智慧微型住宅市場預測至2034年-按住宅類型、整合功能、組件、應用、最終用戶、分銷管道和地區分類的全球分析身臨其境型家庭平台市場預測至2034年-按平台類型、組件、部署模式、技術、應用、最終用戶和地區分類的全球分析