


 |
市場調查報告書
商品編碼
2122302
光耦合器:市場佔有率分析、產業趨勢與統計、成長預測(2026-2031)Optocouplers - Market Share Analysis, Industry Trends & Statistics, Growth Forecasts (2026 - 2031) |
||||||

※ 本網頁內容可能與最新版本有所差異。詳細情況請與我們聯繫。
據 Mordor Intelligence 稱,2025 年光杯市值為 29.8 億美元,預計到 2031 年將從 2026 年的 32.6 億美元成長至 50.8 億美元,預測期(2026-2031 年)的複合年成長率為 9.29%。
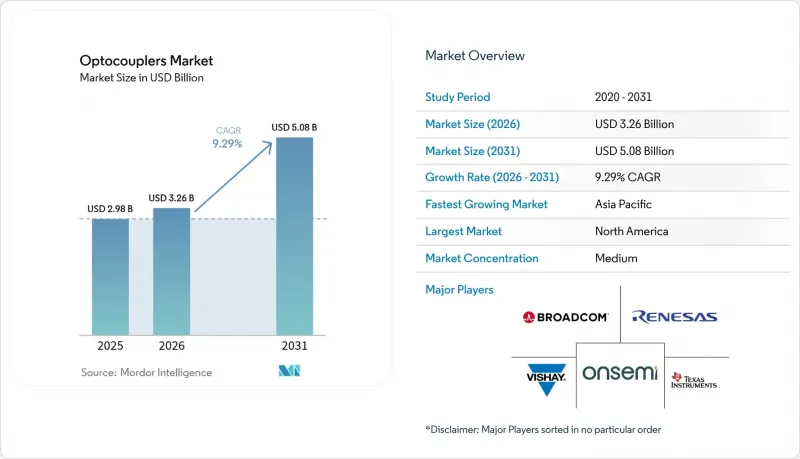
本報告按產品類型(光電電晶體、光電達林頓管等)、通道數(單通道、雙通道、四通道、六通道、八通道)、隔離電壓等級(2.5 kVrms 或更低,其他)、終端用戶行業(汽車/電動車、工業自動化/運動控制,其他)和地區進行細分。市場預測以美元計價。
全球光耦合器市場趨勢與洞察
混合動力和純電動驅動系統的應用迅速成長
在電動車中,800V電池組與12V控制域之間需要電氣隔離,這促使符合IEC 60747-5-5標準的高壓光耦合器在電動車架構中得到更廣泛的應用。電池斷開單元擴大採用SiC JFET和邏輯閘光耦合器的組合來縮短故障恢復時間,而快速充電站則要求每個功率模組配備多個隔離的閘極驅動通道。汽車OEM採購指南現在規定了最低共模瞬態抗擾度超過20 kV/µs的要求,而具有最佳化內部屏蔽結構的光耦合器在該性能範圍內具有優勢。預計到2030年,全球純電動車銷量將接近2,000萬輛,屆時額定電壓高於5 kVrms的光耦合器出貨量將會增加。
工廠自動化技術的進步以及向工業4.0的維修
在傳統的可程式邏輯控制器 (PLC) 和馬達驅動器中,光耦合器仍然被廣泛使用,因為 LED 和光電電晶體的組合能夠在逆變器和伺服密集分佈的設備中提供卓越的噪音抑制性能。即使升級到智慧感測器和雲端連接的邊緣控制器,傳統的隔離拓撲結構通常仍然保留,這意味著現代化改造需要在現有設備的基礎上增加新的通道。供應商現在提供多通道表面黏著技術封裝,可將 PCB面積減少 40%,這對於控制面板空間有限的環境至關重要。在政府獎勵考慮提高紡織、金屬和離散製造業生產力的激勵措施的推動下,亞洲製造商正引領這波維修。
LED老化性能劣化和CTR降低
光纖傳輸取決於發光體的效率。隨著LED效能隨時間劣化,其電流傳輸比(CTR)會低於資料手冊中規定的最小值,因此需要降低額定值或定期更換。加速劣化測試表明,在125 度C下運作10,000小時後,CTR會下降25%,這相當於汽車牽引逆變器中大約四年的使用時間。因此,設計人員必須增加LED的容量或提高驅動電流,但這兩種方法都會增加功率損耗並降低系統整體效率。
細分市場分析
2025年,光電電晶體類光耦合器佔據了光耦合器市場收入的31.85%。工業邏輯輸入和功率回饋迴路的出貨量仍然很高,但成長速度較為溫和。高速邏輯閘類光耦合器的複合年成長率(CAGR)為10.31%,預計到2031年,隨著5G、電動車和可再生能源逆變器等OEM廠商向100奈秒以下的傳播延遲邁進,高速邏輯閘類光耦合器將在光耦合器市場佔據更大的佔有率。用於IGBT和MOSFET閘極驅動器的光耦合器現在整合了米勒箝位電路和去飽和檢測功能,取代了分離式比較器,從而減少了物料清單(BOM)中的條目。
新推出的光電可控矽整流器(photoSCR)和光電雙向可控矽整流器(photoTRIAC)滿足了消費性電子和暖通空調(HVAC)市場對固態繼電器的需求,而用於光伏發電的光耦合器無需輔助偏壓電源即可產生閘極驅動電壓。這對於光伏微型逆變器中的隔離式高側開關來說是一個極具吸引力的特性。東芝的TLP3640A已獲得EN IEC 60747-5-5認證,顯示合規性認證正在推動功能安全領域的應用。供應商持續投資專有的LED化學技術,以在相同驅動電流下實現雙倍光輸出、延長使用壽命並降低電流轉換率(CTR)劣化。
即使到了2025年,單通道產品仍維持著光耦合器市場41.05%的佔有率。這是因為傳統的PLC I/O卡和離線電源的返馳式控制器嚴重依賴一對一隔離。儘管如此,預計到2031年,4通道裝置的年成長率將達到10.52%,這反映了設計人員為縮小多軸伺服驅動器和電池管理模組的基板尺寸所做的努力。雙通道封裝可在RS-485收發器中實現雙向通訊鏈路,而6通道和8通道陣列則應用於三相馬達逆變器,從而能夠同時控制每一相的高側和低側閘極。
提高光耦合密度需要權衡利弊。通道間的熱耦合會增加內部LED結的溫度,因此封裝設計人員會採用銅導線架和模製空腔來散熱。光耦合器產業正擴大提供引腳相容的多通道產品,這些產品具有獨立的使能引腳和開集電極故障輸出,從而簡化了過渡過程。利用更高通道密度的系統整合商通常可以實現高達18%的PCB面積縮減,這對於高功率電動車載充電器至關重要。
區域分析
北美市場引領市場,預計2025年將佔據光耦合器市場44.25%的佔有率,主要得益於汽車電氣化專案、航太升級以及半導體製造設備擴張帶來的強勁需求。原始設備製造商(OEM)受益於該地區的生態系統,從亞利桑那州LED晶圓的生產到墨西哥下加利福尼亞半島的組裝,都體現了這一點。諸如美國《晶片和整合產品法案》(CHIPS Act)等經濟獎勵可望進一步提升美國國內光電產品的生產能力,並縮短區域客戶的交貨前置作業時間。
歐洲緊隨其後,德國、義大利和法國嚴格的功能安全法規以及工業自動化企業的集中發展推動了成長。歐盟的氣候目標正在促進800V電動車繼電器和可再生能源儲存系統的發展,這兩者都需要數千伏有效值的絕緣。該地區為實現碳中和製造所做的努力正在推動用光隔離固態繼電器取代電子機械繼電器。然而,GDP成長緩慢限制了整體出貨量的成長。
亞太地區年複合成長率達12.25%,預計將迅速縮小市場佔有率差距。中國積極部署5G、龐大的消費性電子供應鏈以及電動車產量激增,正催生龐大的市場需求。同時,日本現有企業正利用其製程技術優勢,為工廠自動化出口提供高可靠性的光耦合器。韓國的記憶體工廠正在實施嚴格的設備升級計劃,每台新的EUV光刻機都安裝了數十個隔離通道。印度的生產連結獎勵計畫計畫正吸引LED晶圓切割和後端組裝線,進一步豐富該地區的供應鏈。
其他好處:
- Excel格式的市場預測(ME)表
- 3個月的分析師支持
目錄
第1章:引言
- 研究假設和市場定義
- 調查範圍
第2章:調查方法
第3章執行摘要
第4章 市場狀況
- 市場概覽
- 市場促進因素
- 混合動力和純電動驅動系統的應用正在迅速增加。
- 工廠自動化技術的進步以及向工業4.0的維修
- 5G相容基地台的部署正在推動對電源隔離設備的需求。
- GaN/SiC功率元件的廣泛應用推動了高速光耦合器的需求。
- 推廣功能安全相關法規(ISO 26262、IEC 60747-5-5)
- 新型固體斷路器架構
- 市場限制因素
- LED隨時間劣化和CTR隨時間劣化
- 接頭溫度超過 150 度C時的溫度控管面臨挑戰
- 與數位隔離器(電容式和磁性式)的競爭
- 亞洲LED晶片供應鏈的集中度
- 產業供應鏈分析
- 監理情勢
- 技術展望
- 波特五力分析
第5章 市場規模與成長預測
- 依產品類型
- 光電電晶體
- 照片達靈頓
- 照片 SCR
- 光三叉戟
- 高速邏輯閘型光耦合器
- 用於IGBT/功率MOSFET閘極驅動的光耦合器
- 其他產品類型(太陽能、模擬等)
- 按頻道數
- 1 通道
- 雙通道
- 4個頻道
- 6通道和8通道
- 絕緣電壓額定值
- 2.5 kVrms 或更低
- 2.5~5 kVrms
- 超過 5 kVrms
- 按最終用戶行業分類
- 汽車和電動旅行
- 工業自動化和運動控制
- 電力和能源(可再生能源、電網)
- 家用電子電器和家用電器
- 通訊和資料通訊
- 醫療設備
- 其他終端用戶產業(航太、國防等)
- 按地區
- 北美洲
- 美國
- 加拿大
- 墨西哥
- 南美洲
- 巴西
- 阿根廷
- 哥倫比亞
- 其他南美國家
- 歐洲
- 英國
- 德國
- 法國
- 義大利
- 西班牙
- 其他歐洲國家
- 亞太地區
- 中國
- 日本
- 韓國
- 印度
- 其他亞太國家
- 中東和非洲
- 中東
- 沙烏地阿拉伯
- 阿拉伯聯合大公國
- 其他中東國家
- 非洲
- 南非
- 埃及
- 其他非洲國家
- 中東
- 北美洲
第6章 競爭情勢
- 市場集中度
- 策略趨勢
- 市佔率分析
- 公司簡介
- Broadcom Inc.
- ON Semiconductor Corporation
- Texas Instruments Incorporated
- Vishay Intertechnology Inc.
- Renesas Electronics Corporation
- Toshiba Electronic Devices and Storage Corporation
- Panasonic Holdings Corporation
- Skyworks Solutions Inc.
- LITE-ON Technology Corporation
- Isocom Components 2004 Ltd
- Standex Electronics Inc.
- Everlight Electronics Co., Ltd.
- Shenzhen Kento Electronic Co., Ltd.
- Senba Sensing Technology Co., Ltd.
- Sharp Devices Europe GmbH
- NXP Semiconductors NV
- Infineon Technologies AG
- ROHM Semiconductor GmbH
- Tamura Corporation
- CT Micro International Corporation
第7章 市場機會與未來展望
According to Mordor Intelligence, the optocouplers market size was valued at USD 2.98 billion in 2025 and estimated to grow from USD 3.26 billion in 2026 to reach USD 5.08 billion by 2031, at a CAGR of 9.29% during the forecast period (2026-2031).
This report is Segmented by Product Type (Phototransistor, Photodarlington, and More), Channel Count (1-Channel, 2-Channel, 4-Channel, 6-Channel, and 8-Channel), Isolation Voltage Rating (Less Than or Equal To 2. 5 KVrms, and More), End-User Industry (Automotive and E-Mobility, Industrial Automation and Motion Control, and More), and Geography. The Market Forecasts are Provided in Terms of Value (USD).
Global Optocouplers Market Trends and Insights
Surging adoption in hybrid and battery-electric drivetrains
Electric vehicles require galvanic isolation between 800 V battery packs and 12 V control domains, so EV architectures pull in larger numbers of high-voltage optocouplers certified to IEC 60747-5-5. Battery-disconnect units increasingly pair SiC JFETs with logic-gate optocouplers to shorten fault-clearing times, and fast-charging stations need several isolated gate-drive channels per power module. Automotive OEM sourcing guidelines now stipulate minimum common-mode transient immunity above 20 kV/µs, a performance band that favors optocouplers with optimized internal shield structures. As global BEV sales climb toward 20 million units by 2030, the optocouplers market is expected to ship higher volumes of devices rated above 5 kVrms.
Rising factory automation and Industry 4.0 retrofits
Legacy programmable-logic controllers and motor drives stay with optocouplers because LED-phototransistor pairs exhibit excellent noise rejection in facilities packed with inverters and servos. Upgrades to smart sensors and cloud-connected edge controllers often retain the original isolation topology, so modernization activity layers new channels on top of the installed base. Suppliers now offer multi-channel surface-mount packages that reduce PCB area by 40%, an essential feature for densely packed control cabinets. Asian manufacturers spearhead this retrofitting wave as government incentives prioritize productivity improvements across textiles, metals, and discrete manufacturing.
LED wear-out and CTR degradation over lifetime
Photonic transfer relies on emitter efficiency; as LEDs age, current transfer ratio falls below datasheet minima, forcing derating or scheduled replacement. Accelerated-aging studies show 25% CTR loss after 10,000 operating hours at 125 °C, which in automotive traction inverters equates to roughly four years of service. Designers therefore oversize LEDs or increase drive current, both raising power dissipation and reducing overall system efficiency.
Other drivers and restraints analyzed in the detailed report include:
- 5G-enabled base-station roll-outs driving power isolation demand
- Proliferation of GaN/SiC power devices boosting high-speed optocouplers
- Competition from digital isolators (capacitive and magnetic)
For complete list of drivers and restraints, kindly check the Table Of Contents.
Segment Analysis
The phototransistor class controlled 31.85% of 2025 revenue within the optocouplers market. Although volume remains high for industrial logic inputs and power-supply feedback loops, its growth is modest. High-speed logic-gate types are tracking a 10.31% CAGR and, by 2031, will account for a markedly larger slice of the optocouplers market size as 5G, electric-vehicle, and renewable-inverter OEMs pivot toward sub-100 ns propagation delays. IGBT and MOSFET gate-drive optocouplers now integrate Miller-clamp circuits and desaturation detection, displacing discrete comparators and reducing BOM count.
Emerging photo-SCR and photo-TRIAC options address solid-state relays in appliance and HVAC markets, while photovoltaic optocouplers produce gate-drive voltages without ancillary bias supplies, a compelling feature for isolated high-side switches in solar micro-inverters. Toshiba's TLP3640A, certified to EN IEC 60747-5-5, demonstrates how compliance credentials buttress adoption in functional-safety landscapes. Suppliers continue to invest in proprietary LED chemistries that double luminous output for the same drive current, prolonging lifespan and mitigating CTR degradation.
Single-channel units kept 41.05% share of the optocouplers market in 2025 as legacy PLC I/O cards and off-line power-supply flyback controllers rely heavily on one-for-one isolation. Nevertheless, 4-channel devices are predicted to grow 10.52% annually through 2031, reflecting designers' push to shrink board footprints in multi-axis servo drives and battery-management modules. Dual-channel packages facilitate bidirectional communication links in RS-485 transceivers, while six- and eight-channel arrays serve three-phase motor inverters, enabling simultaneous high-side and low-side gating per phase.
Density gains do not come without trade-offs; thermal coupling between channels elevates internal LED junction temperature, so package designers employ copper lead-frames and molded cavities to dissipate heat. The optocouplers industry increasingly offers pin-compatible multi-channel options featuring independent enable pins plus open-collector fault outputs, making migration straightforward. System integrators leveraging higher channel densities often achieve up to 18% PCB area savings, crucial in high-power EV on-board chargers.
Complete Report Scope:
- By Product Type
- Phototransistor
- Photodarlington
- Photo-SCR
- Photo-TRIAC
- High-speed Logic-gate Optocoupler
- IGBT/Power MOSFET Gate-drive Optocoupler
- Other Product Types (Photovoltaic, Analog, etc.)
- By Channel Count
- 1-Channel
- 2-Channel
- 4-Channel
- 6-Channel and 8-Channel
- By Isolation Voltage Rating
- Less than or Equal to 2.5 kVrms
- 2.5 - 5 kVrms
- Greater than 5 kVrms
- By End-user Industry
- Automotive and E-Mobility
- Industrial Automation and Motion Control
- Power and Energy (Renewables, Grid)
- Consumer Electronics and Home Appliances
- Telecom and Datacom
- Healthcare Equipment
- Other End-user Industries (Aerospace, Defense, etc.)
- By Geography
- North America
- United States
- Canada
- Mexico
- South America
- Brazil
- Argentina
- Colombia
- Rest of South America
- Europe
- United Kingdom
- Germany
- France
- Italy
- Spain
- Rest of Europe
- Asia-Pacific
- China
- Japan
- South Korea
- India
- Rest of Asia-Pacific
- Middle East and Africa
- Middle East
- Saudi Arabia
- United Arab Emirates
- Rest of Middle East
- Africa
- South Africa
- Egypt
- Rest of Africa
- Middle East
- North America
Geography Analysis
North America dominated 2025 revenue with a 44.25% stake in the optocouplers market share as vehicle electrification programs, aerospace upgrades, and semiconductor equipment builds kept demand vibrant. OEMs benefit from a local ecosystem spanning LED wafer growth in Arizona through to assembly in Mexico's Baja corridor. Economic incentives such as the U.S. CHIPS Act will further bolster domestic optoelectronics capacity, potentially tightening lead times for regional customers.
Europe follows, propelled by stringent functional-safety mandates and a strong concentration of industrial-automation firms in Germany, Italy, and France. EU climate targets incentivize 800 V EV platforms and renewable-energy storage systems, each requiring multi-kVrms isolation. The region's commitment to carbon-neutral manufacturing supports the replacement of electromechanical relays with optically isolated solid-state alternatives. However, moderate GDP growth tempers total unit expansion.
Asia-Pacific is on a 12.25% CAGR trajectory and will close the share gap quickly. China's aggressive 5G rollout, sprawling consumer-electronics supply chains, and surging EV output drive huge volume requirements, while Japanese incumbents leverage their process know-how to supply high-reliability optocouplers for factory-automation exports. South Korea's memory fabs execute stringent equipment upgrade cycles, each new EUV stepper containing dozens of isolation channels. India's production-linked incentive programs have begun to lure LED wafer slicing and backend assembly lines, diversifying the region's supply base.
- Broadcom Inc.
- ON Semiconductor Corporation
- Texas Instruments Incorporated
- Vishay Intertechnology Inc.
- Renesas Electronics Corporation
- Toshiba Electronic Devices and Storage Corporation
- Panasonic Holdings Corporation
- Skyworks Solutions Inc.
- LITE-ON Technology Corporation
- Isocom Components 2004 Ltd
- Standex Electronics Inc.
- Everlight Electronics Co., Ltd.
- Shenzhen Kento Electronic Co., Ltd.
- Senba Sensing Technology Co., Ltd.
- Sharp Devices Europe GmbH
- NXP Semiconductors N.V.
- Infineon Technologies AG
- ROHM Semiconductor GmbH
- Tamura Corporation
- CT Micro International Corporation
Additional Benefits:
- The market estimate (ME) sheet in Excel format
- 3 months of analyst support
TABLE OF CONTENTS
1 INTRODUCTION
- 1.1 Study Assumptions and Market Definition
- 1.2 Scope of the Study
2 RESEARCH METHODOLOGY
3 EXECUTIVE SUMMARY
4 MARKET LANDSCAPE
- 4.1 Market Overview
- 4.2 Market Drivers
- 4.2.1 Surging adoption in hybrid and battery-electric drivetrains
- 4.2.2 Rising factory automation and Industry 4.0 retrofits
- 4.2.3 5G-enabled base-station roll-outs driving power isolation demand
- 4.2.4 Proliferation of GaN/SiC power devices boosting high-speed optocouplers
- 4.2.5 Regulatory push for functional safety (ISO 26262, IEC 60747-5-5)
- 4.2.6 Emerging solid-state circuit-breaker architectures
- 4.3 Market Restraints
- 4.3.1 LED wear-out and CTR degradation over lifetime
- 4.3.2 Thermal-management challenges above 150 °C junction
- 4.3.3 Competition from digital isolators (capacitive and magnetic)
- 4.3.4 Supply-chain concentration in Asia for LED die
- 4.4 Industry Supply Chain Analysis
- 4.5 Regulatory Landscape
- 4.6 Technological Outlook
- 4.7 Porter's Five Forces Analysis
- 4.7.1 Bargaining Power of Suppliers
- 4.7.2 Bargaining Power of Buyers
- 4.7.3 Threat of New Entrants
- 4.7.4 Threat of Substitute Products
- 4.7.5 Intensity of Competitive Rivalry
5 MARKET SIZE AND GROWTH FORECASTS (VALUE)
- 5.1 By Product Type
- 5.1.1 Phototransistor
- 5.1.2 Photodarlington
- 5.1.3 Photo-SCR
- 5.1.4 Photo-TRIAC
- 5.1.5 High-speed Logic-gate Optocoupler
- 5.1.6 IGBT/Power MOSFET Gate-drive Optocoupler
- 5.1.7 Other Product Types (Photovoltaic, Analog, etc.)
- 5.2 By Channel Count
- 5.2.1 1-Channel
- 5.2.2 2-Channel
- 5.2.3 4-Channel
- 5.2.4 6-Channel and 8-Channel
- 5.3 By Isolation Voltage Rating
- 5.3.1 Less than or Equal to 2.5 kVrms
- 5.3.2 2.5 - 5 kVrms
- 5.3.3 Greater than 5 kVrms
- 5.4 By End-user Industry
- 5.4.1 Automotive and E-Mobility
- 5.4.2 Industrial Automation and Motion Control
- 5.4.3 Power and Energy (Renewables, Grid)
- 5.4.4 Consumer Electronics and Home Appliances
- 5.4.5 Telecom and Datacom
- 5.4.6 Healthcare Equipment
- 5.4.7 Other End-user Industries (Aerospace, Defense, etc.)
- 5.5 By Geography
- 5.5.1 North America
- 5.5.1.1 United States
- 5.5.1.2 Canada
- 5.5.1.3 Mexico
- 5.5.2 South America
- 5.5.2.1 Brazil
- 5.5.2.2 Argentina
- 5.5.2.3 Colombia
- 5.5.2.4 Rest of South America
- 5.5.3 Europe
- 5.5.3.1 United Kingdom
- 5.5.3.2 Germany
- 5.5.3.3 France
- 5.5.3.4 Italy
- 5.5.3.5 Spain
- 5.5.3.6 Rest of Europe
- 5.5.4 Asia-Pacific
- 5.5.4.1 China
- 5.5.4.2 Japan
- 5.5.4.3 South Korea
- 5.5.4.4 India
- 5.5.4.5 Rest of Asia-Pacific
- 5.5.5 Middle East and Africa
- 5.5.5.1 Middle East
- 5.5.5.1.1 Saudi Arabia
- 5.5.5.1.2 United Arab Emirates
- 5.5.5.1.3 Rest of Middle East
- 5.5.5.2 Africa
- 5.5.5.2.1 South Africa
- 5.5.5.2.2 Egypt
- 5.5.5.2.3 Rest of Africa
- 5.5.5.1 Middle East
- 5.5.1 North America
6 COMPETITIVE LANDSCAPE
- 6.1 Market Concentration
- 6.2 Strategic Moves
- 6.3 Market Share Analysis
- 6.4 Company Profiles {(includes Global level Overview, Market level overview, Core Segments, Financials as available, Strategic Information, Market Rank/Share, Products and Services, Recent Developments)}
- 6.4.1 Broadcom Inc.
- 6.4.2 ON Semiconductor Corporation
- 6.4.3 Texas Instruments Incorporated
- 6.4.4 Vishay Intertechnology Inc.
- 6.4.5 Renesas Electronics Corporation
- 6.4.6 Toshiba Electronic Devices and Storage Corporation
- 6.4.7 Panasonic Holdings Corporation
- 6.4.8 Skyworks Solutions Inc.
- 6.4.9 LITE-ON Technology Corporation
- 6.4.10 Isocom Components 2004 Ltd
- 6.4.11 Standex Electronics Inc.
- 6.4.12 Everlight Electronics Co., Ltd.
- 6.4.13 Shenzhen Kento Electronic Co., Ltd.
- 6.4.14 Senba Sensing Technology Co., Ltd.
- 6.4.15 Sharp Devices Europe GmbH
- 6.4.16 NXP Semiconductors N.V.
- 6.4.17 Infineon Technologies AG
- 6.4.18 ROHM Semiconductor GmbH
- 6.4.19 Tamura Corporation
- 6.4.20 CT Micro International Corporation
7 MARKET OPPORTUNITIES AND FUTURE OUTLOOK
- 7.1 White-space and Unmet-need Assessment

 Optocapura市場:全球市場預測,2026-2032年
 光耦合器市場報告:趨勢、預測和競爭分析(至2035年)
 2026 年全球光耦合器市場報告光電二極體光耦合器市場報告:趨勢、預測和競爭分析(至2035年)高壓光耦合器市場按產品類型、隔離電壓、封裝類型、LED波長和應用分類,全球預測(2026-2032年)
 光耦合器市場規模、佔有率和成長分析(按產品、引腳類型、元件、應用和地區分類)—產業預測(2026-2033 年)
 光耦合器積體電路市場-全球產業規模、佔有率、趨勢、機會和預測,按類型、引腳、垂直應用、地區和競爭格局分類,2020-2030年預測
 全球光耦合器市場:預測(2025-2030)