


 |
市場調查報告書
商品編碼
2120803
行動化運營服務:市場佔有率分析、產業趨勢與統計、成長預測(2026-2031 年)Managed Mobility Services - Market Share Analysis, Industry Trends & Statistics, Growth Forecasts (2026 - 2031) |
||||||

※ 本網頁內容可能與最新版本有所差異。詳細情況請與我們聯繫。
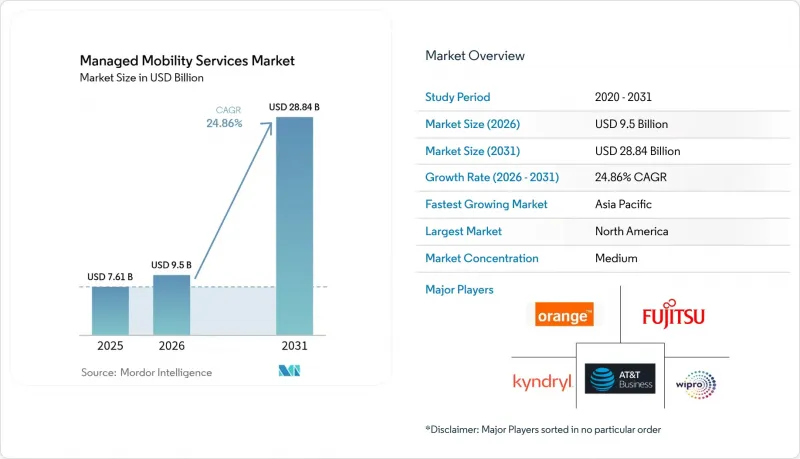
根據 Mordor Intelligence 預測,行動化運營服務市場規模將從 2025 年的 76.1 億美元成長到 2026 年的 95 億美元,然後在 2031 年達到 288.4 億美元,2026 年至 2031 年的複合年成長率為 24.86%。
本報告按功能(行動裝置管理、行動應用程式管理等)、部署模式(雲端和本地部署)、組織規模(大型企業和中小企業)、最終用戶產業(IT和電信、銀行、金融服務和保險、醫療保健等)以及地區進行細分。市場預測以美元計價。
全球行動化運營服務市場趨勢與洞察
自備設備辦公室(BYOD)的普及和混合辦公模式的建立。
目前,80% 的員工透過個人設備存取公司數據,這迫使企業管理前所未有的多樣化終端,給內部 IT 團隊帶來了超越實際承受能力的負擔。在未經管理的智慧型手機和平板電腦上處理敏感文件會增加網路風險,促使企業尋求外部專家,以在不限制用戶自由的前提下統一策略。行動化運營服務市場的供應商正在利用容器化和即時威脅偵測技術來滿足這項需求,這些技術可以保護傳輸中和靜態資料。在知識密集產業,由於生產力的提高抵消了設備多樣性帶來的影響,因此對這類服務的需求成長最為迅速。隨著混合辦公模式的日益普及,能夠整合安全性、使用者體驗和合規性的服務供應商有望獲得多年期的大規模合約。
透過IT和行動技術生命週期外包降低整體擁有成本
隨著預算分配從資本支出轉向營運費用,可預測的訂閱模式變得更具吸引力。對比研究表明,將生命週期營運外包給利用自動化和規模經濟的多租戶服務供應商,可以將每台設備的維護成本降低 30%。外包使不堪重負的 IT 團隊能夠專注於策略性數位化項目,並為經營團隊提供統一的使用情況、合規性和支出情況儀表板。因此,缺乏內部行動專家的中型企業對行動化運營服務的需求正在迅速成長。供應商如果能夠證明其在成本節約、快速部署以及基於服務等級協定 (SLA) 的品質指標方面優於內部能力,就能贏得合約。
令人擔憂的問題包括營運管理缺失和成本不透明。
當預算責任和即時績效數據不明確時,主管往往不願意將關鍵的行動辦公室功能外包。在合約談判過程中,如果出現價格浮動、客製化報告額外收費或供應商鎖定條款等情況,這種擔憂會進一步加劇。目前,供應商正努力透過提供詳細的儀錶板、靈活的終止選項和基準定價來重建信任。透明的管治結構和共同管理模式,使得即使是風險規避型企業也能在行動化運營服務市場保持發展勢頭。
細分市場分析
到 2025 年,行動裝置管理將佔據行動化運營服務市場 61.98% 的佔有率。這是因為企業最初優先考慮的是跨智慧型手機、平板電腦和環境適應性終端的統一策略執行、資產追蹤和遠端擦拭巾功能。對韌體更新和加密狀態的全面管理,使得裝置層成為合規性稽核和事件回應的重要基礎。然而,隨著企業將安全措施擴展到資料層,該領域的成長速度落後於更靈活、以應用為中心的解決方案。
在所有功能類別中,行動應用管理預計將以 26.64% 的複合年成長率 (CAGR) 實現最高成長,因為容器化將自帶設備 (BYOD) 上的企業和個人環境分離,並消除了對設備級控制的需求。醫療機構正在採用應用程式級管理來保護病患記錄,同時允許臨床醫生使用他們的個人智慧型手機;金融機構則正在為行動銀行顧問部署安全的應用程式封裝。這種轉變促使供應商將設備、應用程式和內容模組捆綁在一起,從而避免客戶簽署多份合約。這種整合將使行動化運營服務市場能夠保持靈活性,以應對不斷變化的終端安全威脅和員工期望。
預計到2025年,雲端解決方案將佔據行動化運營服務市場68.15%的佔有率,並有望維持26.92%的複合年成長率,因為企業需要彈性容量、統一的策略執行和快速的功能部署。多租戶架構能夠帶來本地環境無法實現的規模經濟效益,尤其是在修補程式分發、分析處理和合規性報告方面。資訊長們也高度重視超大規模資料中心提供的地理冗餘,而這種冗餘無需資本投資即可確保運作。
在國防、公共部門和監管嚴格的公共產業領域,由於資料居住要求和空氣間隙操作的必要性,本地部署仍然十分普遍。即使在這些產業內部,混合模式也正在興起:核心身分儲存仍保留在本地,而裝置遙測和人工智慧分析則在雲端進行處理。因此,服務供應商正在投資靈活的架構,並配備連接器,以便在不同環境之間無縫遷移工作負載。這種方法使他們能夠在主權法規不斷變化的情況下維持廣泛的客戶群,從而鞏固行動化運營服務市場,使其成為實現整合端點監控的可行途徑。
區域分析
預計到2025年,北美將維持39.35%的市佔率。這主要得益於BYOD(自帶設備辦公室)的早期普及、成熟的雲端技術應用以及嚴格的隱私法規,這些因素共同推動了對功能齊全的託管服務項目的投資。企業正日益將行動威脅防護、安全連接和分析功能整合到統一合約中,從而推高了合約的平均價值。隨著政府機構在滿足FedRAMP和CJIS要求的同時推動服務交付現代化,公共部門的需求也在不斷成長,所有這些因素都擴大了行動化運營服務市場的區域收入規模。
亞太地區預計將以26.21%的複合年成長率成為全球成長最快的地區,這主要得益於產業數位化、政府智慧城市計畫以及多元化的電子商務生態系統。中國領先的本土雲端公司正在將行動服務與5G專網捆綁銷售,而印度的IT服務整合商則正在向渴望遠端支援的本地中小企業推廣全球最佳實踐。東南亞國協正在投資勞動力移動化,以簡化旅遊業、物流走廊和普惠金融等領域的邊境檢查,這些領域都依賴強大的終端安全保障。這些多元化的應用案例正在深化區域專業知識,並吸引新的資本進入行動化運營服務市場。
在歐洲,由於GDPR的實施、數位身分方案的推廣以及對符合主權要求的雲端服務的需求,市場呈現穩定成長態勢。企業正在調整採購策略,優先選擇能夠在歐盟境內託管遙測資料並符合ISO 27001標準的供應商。儘管預算週期依然謹慎,但合約的持續續約維持了可預測的成長動能。在南美、中東和非洲,隨著行動寬頻普及率的提高以及跨國公司在其分支機構部署標準化策略,新的需求正在湧現。區域電信業者的能力建構進一步擴大了行動化運營服務市場的規模。
其他好處:
- Excel格式的市場預測(ME)表
- 3個月的分析師支持
目錄
第1章:引言
- 研究假設和市場定義
- 調查範圍
第2章:調查方法
第3章執行摘要
第4章 市場狀況
- 市場概覽
- 市場促進因素
- 自備設備辦公室(BYOD)的普及和混合辦公模式的建立。
- 透過外包IT和行動技術生命週期各環節,降低整體擁有成本
- 雲端運算的快速普及使得擴充性彩信發送成為可能。
- 所有端點都需要統一的安全性和合規性
- eSIM/iSIM 和遠端 SIM-OTA 正在推動零接觸全球車隊的發展。
- 人工智慧驅動的預測支援可顯著減少設備停機時間。
- 市場限制因素
- 認知到營運管理能力和成本可見度的喪失。
- 與傳統基礎設施整合的複雜性
- 由於客製化和廣泛的支援服務,服務等級協定 (SLA) 違約費用增加。
- 熟練的流動性專業人員短缺
- 產業價值鏈分析
- 監理情勢
- 技術展望
- 波特五力分析
第5章 市場規模與成長預測
- 按功能
- 行動裝置管理
- 行動應用程式管理
- 行動安全管理
- 支援與維護
- 按部署模式
- 基於雲端的
- 現場
- 按組織規模
- 大公司
- 小型企業
- 按最終用戶行業分類
- IT/通訊
- BFSI
- 衛生保健
- 製造業
- 零售與電子商務
- 教育
- 政府/公共部門
- 按地區
- 北美洲
- 美國
- 加拿大
- 墨西哥
- 南美洲
- 巴西
- 阿根廷
- 其他南美國家
- 歐洲
- 德國
- 英國
- 法國
- 義大利
- 西班牙
- 其他歐洲國家
- 亞太地區
- 中國
- 日本
- 韓國
- 印度
- ASEAN
- 其他亞太國家
- 中東和非洲
- 中東
- 沙烏地阿拉伯
- 阿拉伯聯合大公國
- 土耳其
- 其他中東國家
- 非洲
- 南非
- 奈及利亞
- 其他非洲國家
- 中東
- 北美洲
第6章 競爭情勢
- 市場集中度分析
- 策略性舉措(併購、合作、新產品發布)
- 市佔率分析
- 公司簡介
- AT&T Inc.
- Fujitsu Limited
- Kyndryl Holdings, Inc.
- Wipro Limited
- Orange SA
- Telefonica SA
- Samsung Electronics Co., Ltd.
- Hewlett Packard Enterprise Company
- Vodafone Group Plc
- Microsoft Corporation
- Tech Mahindra Limited
- Accenture plc
- International Business Machines Corporation
- Deutsche Telekom AG
- Verizon Communications Inc.
- Tata Consultancy Services Limited
- Infosys Limited
- DXC Technology Company
- Calero-MDSL, LLC
- Tangoe, Inc.
- SOTI Inc.
- Stratix Corporation
- Brightfin, LLC
- DMI(Digital Management, LLC)
第7章 市場機會與未來展望
According to Mordor Intelligence, the managed mobility services market size is expected to grow from USD 7.61 billion in 2025 to USD 9.5 billion in 2026 and is forecast to reach USD 28.84 billion by 2031 at 24.86% CAGR over 2026-2031.
This report is Segmented by Function (Mobile Device Management, Mobile Application Management, and More), Deployment Model (Cloud-Based and On-Premises), Organization Size (Large Enterprises and Small and Medium-Sized Enterprises), End-User Industry (IT and Telecom, BFSI, Healthcare, and More), and Geography. The Market Forecasts are Provided in Terms of Value (USD).
Global Managed Mobility Services Market Trends and Insights
BYOD proliferation and hybrid work normalization
Firms now manage unprecedented endpoint diversity because 80% of employees access corporate data from personal devices, a scenario that stretches internal IT teams beyond practical limits. Cyber-risks rise when unmanaged smartphones and tablets handle sensitive files, so enterprises seek external specialists able to impose policy uniformity without limiting user freedom. Managed mobility services market vendors respond with containerization and real-time threat detection that secure data in motion and at rest. Demand rises fastest among knowledge-intensive industries where productivity gains offset device heterogeneity. Service providers that can blend security, user experience, and regulatory compliance stand to win large multiyear contracts as hybrid work policies solidify.
Outsourcing of IT and mobility lifecycle to cut TCO
Budget ownership has shifted from capital to operating expense, making predictable subscription models attractive. Comparative studies show per-device support costs drop 30% when lifecycle tasks move to a multi-tenant provider that leverages automation and scale. Outsourcing frees overstretched IT teams for strategic digital programs while giving executives uniform dashboards for usage, compliance, and spend. The managed mobility services market therefore grows rapidly among mid-market companies that lack mobility specialists. Vendors win deals when they can prove measurable savings, rapid onboarding, and SLA-based quality metrics that outclass in-house alternatives.
Perceived loss of operational control and cost visibility
Executives hesitate to hand key mobility functions to third parties when budget accountability and live performance data appear opaque. Concerns grow when variable fees, custom reporting surcharges, or vendor lock-in clauses come to light during contract negotiations. Providers now counter by exposing granular dashboards, flexible exit options, and benchmark pricing to rebuild trust. Transparent governance frameworks and co-managed models help sustain momentum in the managed mobility services market even among risk-averse organizations.
Other drivers and restraints analyzed in the detailed report include:
- Rapid cloud adoption enabling scalable MMS delivery
- Need for unified security and compliance across endpoints
- Integration complexity with legacy infrastructure
For complete list of drivers and restraints, kindly check the Table Of Contents.
Segment Analysis
Mobile device management delivered 61.98% of the managed mobility services market share in 2025 because enterprises initially prioritized uniform policy enforcement, asset tracking, and remote wipe capabilities across smartphones, tablets, and rugged endpoints. Comprehensive control over firmware updates and encryption status made the device layer an indispensable foundation for compliance audits and incident response. However, the segment's expansion rate now lags more agile application-centric options as organizations refine security to the data layer.
Mobile application management is forecast to post a 26.64% CAGR, the strongest among functional categories, as containerization separates corporate and personal contexts on BYOD hardware without intrusive full-device controls. Healthcare providers adopt app-level management to safeguard patient records while permitting clinicians to use personal phones, and financial institutions deploy secure app wrappers for mobile banking advisors. The shift encourages service vendors to bundle device, app, and content modules so clients avoid multiple contracts. Such convergence keeps the managed mobility services market adaptable to evolving endpoint threats and workforce expectations.
Cloud solutions held 68.15% of managed mobility services market size in 2025 and they will maintain momentum with a 26.92% CAGR as enterprises seek elastic capacity, uniform policy propagation, and rapid feature rollout. Multi-tenant architectures offer economies of scale for patch distribution, analytics processing, and compliance reporting that on-premises stacks cannot match. CIOs also value geographic redundancy delivered through hyperscale data centers that satisfy uptime commitments without capital expenditure.
On-premises deployments persist in defense, public sector, and heavily regulated utilities that require data residency or air-gapped operations. Even within those verticals, hybrid models emerge where core identity stores remain on site but device telemetry and AI analytics reside in the cloud. Service providers therefore invest in flexible architectures with connectors that move workloads seamlessly across environments. This approach keeps their addressable universe broad as sovereignty rules evolve, reinforcing the managed mobility services market as a pragmatic pathway to unified endpoint oversight.
Complete Report Scope:
- By Function
- Mobile Device Management
- Mobile Application Management
- Mobile Security Management
- Support and Maintenance
- By Deployment Model
- Cloud-based
- On-premises
- By Organization Size
- Large Enterprises
- Small and Medium-Sized Enterprises
- By End-user Industry
- IT and Telecom
- BFSI
- Healthcare
- Manufacturing
- Retail and E-commerce
- Education
- Government and Public Sector
- By Geography
- North America
- United States
- Canada
- Mexico
- South America
- Brazil
- Argentina
- Rest of South America
- Europe
- Germany
- United Kingdom
- France
- Italy
- Spain
- Rest of Europe
- Asia-Pacific
- China
- Japan
- South Korea
- India
- ASEAN
- Rest of Asia-Pacific
- Middle East and Africa
- Middle East
- Saudi Arabia
- United Arab Emirates
- Turkey
- Rest of Middle East
- Africa
- South Africa
- Nigeria
- Rest of Africa
- Middle East
- North America
Geography Analysis
North America retained 39.35% share in 2025 because early BYOD acceptance, mature cloud adoption, and stringent privacy rules together encouraged investment in full-featured managed programs. Enterprises routinely integrate mobile threat defense, secure connectivity, and analytics within unified contracts, raising average deal values. Public sector demand also rises as agencies modernize service delivery while satisfying FedRAMP and CJIS mandates, all of which magnify regional revenue pools for the managed mobility services market.
Asia-Pacific will advance at a 26.21% CAGR, the fastest worldwide, underpinned by industrial digitalization, government smart city agendas, and multifaceted e-commerce ecosystems. China's domestic cloud champions bundle mobility services with 5G private networks, while India's IT service integrators extend global best practices to local SMEs eager for remote support. ASEAN nations invest in workforce mobility to streamline tourism border checks, logistics corridors, and financial inclusion programs that rely on robust endpoint security. These varied deployments deepen regional expertise and attract fresh capital into the managed mobility services market.
Europe records steady growth due to GDPR enforcement, digital identity schemes, and demand for sovereignty-compliant clouds. Enterprises adjust procurement to favor providers that host telemetry within the bloc and can certify ISO 27001 compliance. Although budget cycles remain cautious, repeat contract renewals sustain predictable momentum. South America and the Middle East and Africa exhibit emerging demand as mobile broadband penetration climbs and multinational firms roll out standardized policies across affiliates. Capacity building by regional telecoms further enlarges the managed mobility services market footprint.
- AT&T Inc.
- Fujitsu Limited
- Kyndryl Holdings, Inc.
- Wipro Limited
- Orange S.A.
- Telefonica S.A.
- Samsung Electronics Co., Ltd.
- Hewlett Packard Enterprise Company
- Vodafone Group Plc
- Microsoft Corporation
- Tech Mahindra Limited
- Accenture plc
- International Business Machines Corporation
- Deutsche Telekom AG
- Verizon Communications Inc.
- Tata Consultancy Services Limited
- Infosys Limited
- DXC Technology Company
- Calero-MDSL, LLC
- Tangoe, Inc.
- SOTI Inc.
- Stratix Corporation
- Brightfin, LLC
- DMI (Digital Management, LLC)
Additional Benefits:
- The market estimate (ME) sheet in Excel format
- 3 months of analyst support
TABLE OF CONTENTS
1 INTRODUCTION
- 1.1 Study Assumptions and Market Definition
- 1.2 Scope of the Study
2 RESEARCH METHODOLOGY
3 EXECUTIVE SUMMARY
4 MARKET LANDSCAPE
- 4.1 Market Overview
- 4.2 Market Drivers
- 4.2.1 BYOD proliferation and hybrid-work normalization
- 4.2.2 Outsourcing of IT and mobility lifecycle to cut TCO
- 4.2.3 Rapid cloud adoption enabling scalable MMS delivery
- 4.2.4 Need for unified security and compliance across endpoints
- 4.2.5 eSIM/iSIM and remote SIM-OTA fueling zero-touch global fleets
- 4.2.6 AI-driven predictive support slashing device downtime
- 4.3 Market Restraints
- 4.3.1 Perceived loss of operational control and cost visibility
- 4.3.2 Integration complexity with legacy infrastructure
- 4.3.3 Rising SLA penalties from customization and high-touch support
- 4.3.4 Shortage of skilled mobility professionals
- 4.4 Industry Value Chain Analysis
- 4.5 Regulatory Landscape
- 4.6 Technological Outlook
- 4.7 Porter's Five Forces Analysis
- 4.7.1 Bargaining Power of Suppliers
- 4.7.2 Bargaining Power of Buyers/Consumers
- 4.7.3 Threat of New Entrants
- 4.7.4 Intensity of Competitive Rivalry
- 4.7.5 Threat of Substitutes
5 MARKET SIZE AND GROWTH FORECASTS (VALUE)
- 5.1 By Function
- 5.1.1 Mobile Device Management
- 5.1.2 Mobile Application Management
- 5.1.3 Mobile Security Management
- 5.1.4 Support and Maintenance
- 5.2 By Deployment Model
- 5.2.1 Cloud-based
- 5.2.2 On-premises
- 5.3 By Organization Size
- 5.3.1 Large Enterprises
- 5.3.2 Small and Medium-Sized Enterprises
- 5.4 By End-user Industry
- 5.4.1 IT and Telecom
- 5.4.2 BFSI
- 5.4.3 Healthcare
- 5.4.4 Manufacturing
- 5.4.5 Retail and E-commerce
- 5.4.6 Education
- 5.4.7 Government and Public Sector
- 5.5 By Geography
- 5.5.1 North America
- 5.5.1.1 United States
- 5.5.1.2 Canada
- 5.5.1.3 Mexico
- 5.5.2 South America
- 5.5.2.1 Brazil
- 5.5.2.2 Argentina
- 5.5.2.3 Rest of South America
- 5.5.3 Europe
- 5.5.3.1 Germany
- 5.5.3.2 United Kingdom
- 5.5.3.3 France
- 5.5.3.4 Italy
- 5.5.3.5 Spain
- 5.5.3.6 Rest of Europe
- 5.5.4 Asia-Pacific
- 5.5.4.1 China
- 5.5.4.2 Japan
- 5.5.4.3 South Korea
- 5.5.4.4 India
- 5.5.4.5 ASEAN
- 5.5.4.6 Rest of Asia-Pacific
- 5.5.5 Middle East and Africa
- 5.5.5.1 Middle East
- 5.5.5.1.1 Saudi Arabia
- 5.5.5.1.2 United Arab Emirates
- 5.5.5.1.3 Turkey
- 5.5.5.1.4 Rest of Middle East
- 5.5.5.2 Africa
- 5.5.5.2.1 South Africa
- 5.5.5.2.2 Nigeria
- 5.5.5.2.3 Rest of Africa
- 5.5.5.1 Middle East
- 5.5.1 North America
6 COMPETITIVE LANDSCAPE
- 6.1 Market Concentration Analysis
- 6.2 Strategic Moves (MandA, Partnerships, Product Launches)
- 6.3 Market Share Analysis
- 6.4 Company Profiles (includes Global overview, Market-level overview, Core Segments, Financials as available, Strategic Information, Market Rank/Share, Products and Services, Recent Developments)
- 6.4.1 AT&T Inc.
- 6.4.2 Fujitsu Limited
- 6.4.3 Kyndryl Holdings, Inc.
- 6.4.4 Wipro Limited
- 6.4.5 Orange S.A.
- 6.4.6 Telefonica S.A.
- 6.4.7 Samsung Electronics Co., Ltd.
- 6.4.8 Hewlett Packard Enterprise Company
- 6.4.9 Vodafone Group Plc
- 6.4.10 Microsoft Corporation
- 6.4.11 Tech Mahindra Limited
- 6.4.12 Accenture plc
- 6.4.13 International Business Machines Corporation
- 6.4.14 Deutsche Telekom AG
- 6.4.15 Verizon Communications Inc.
- 6.4.16 Tata Consultancy Services Limited
- 6.4.17 Infosys Limited
- 6.4.18 DXC Technology Company
- 6.4.19 Calero-MDSL, LLC
- 6.4.20 Tangoe, Inc.
- 6.4.21 SOTI Inc.
- 6.4.22 Stratix Corporation
- 6.4.23 Brightfin, LLC
- 6.4.24 DMI (Digital Management, LLC)
7 MARKET OPPORTUNITIES AND FUTURE OUTLOOK
- 7.1 White-space and Unmet-need Assessment


