


 |
市場調查報告書
商品編碼
1851015
邊緣運算:市場佔有率分析、產業趨勢、統計數據和成長預測(2025-2030 年)Edge Computing - Market Share Analysis, Industry Trends & Statistics, Growth Forecasts (2025 - 2030) |
||||||
※ 本網頁內容可能與最新版本有所差異。詳細情況請與我們聯繫。
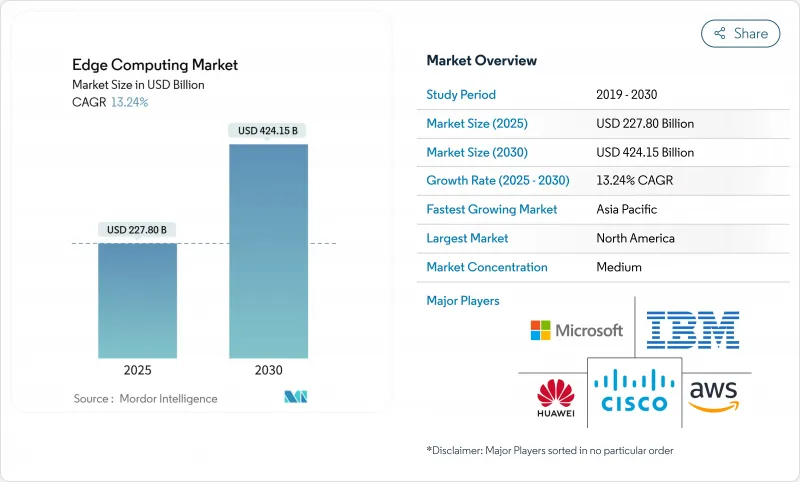
預計到 2025 年,邊緣運算市場規模將達到 2,278 億美元,到 2030 年將達到 4,241.5 億美元,年複合成長率為 13.24%。
網路邊緣資料負載的不斷成長、5G無線接取網路的部署以及全球資料主權要求,正在透過將時間敏感型處理從集中式雲端轉移出去,重新定義企業架構。硬體供應商受益於ASIC和SoC價格的下降,這降低了即時AI推理的准入門檻;而通訊業者透過符合ETSI第四階段規範的多重存取邊緣運算(MEC)服務,開闢了新的收入來源。製造、能源和移動出行行業的公司正在採用邊緣節點來最大限度地減少延遲、保護敏感資料並提高營運彈性。同時,雲端超大規模供應商正在將託管服務擴展到客戶現場,從而實現對分散式工作負載的統一觀察和生命週期管理。
全球邊緣運算市場趨勢與洞察
5G部署推動超低延遲應用場景
全球5G部署將實現自動駕駛汽車、遠端手術和身臨其境型維護應用所需的亞毫秒延遲。 Verizon和NVIDIA正在私有5G網路上試行即時AI服務,將邊緣節點錨定在基地台,以滿足嚴格的往返延遲計算。超大規模資料中心營運商正在通訊交換中心附近部署微型資料中心,使開發人員能夠將容器部署得更靠近使用者。 ETSI MEC第四階段規格創建了通用API,幫助營運商實現差異化延遲層級的商業化,同時確保工作負載的可移植性。這項投資週期與各國政府資助農村地區5G覆蓋以及將邊緣驅動服務擴展到人口密集的城市走廊之外的計劃相吻合。
物聯網終端和數據引力的激增
工業場所部署了數千個感測器,每天產生Terabyte的資料。 89%的製造商計劃將AI推理遷移到本地閘道器,以實現即時品管。邊緣原生架構透過將大量資料保留在本地直至摘要,從而降低頻寬成本並避免雲端連線費用。 TCS CleverEnergy等平台利用本地推理來標記異常情況並觸發即時糾正措施。物聯網設備整合了輕量級GPU和NPU,使其能夠自主運行視覺模型,從而釋放回程傳輸線路以用於監控任務。
擴大分散式節點的網路攻擊面
每個閘道器、感測器和微型資料中心都可能成為入侵點,增加了攻擊者橫向入侵IT/OT網路的可能性。儘管工業營運商已經實施了零信任韌體、硬體信任根和TPM支援的身份驗證,但改造後的傳統設備通常缺乏安全的啟動序列。隨著邊緣節點離開受保護的資料中心,部署在工廠車間或路邊機櫃中,實體篡改的風險也隨之增加。缺乏本地即時取證工具會阻礙事件回應,並延長控制安全漏洞的平均時間。
細分市場分析
到2024年,硬體將佔邊緣運算市場的45.2%,這反映了對加固型伺服器、加速器和現場部署儲存設備所需的前期投資。硬體邊緣運算市場預計到2025年將達到1,028億美元,強勁成長主要得益於ASIC價格的下降。軟體平台在收入方面落後於硬體,但在創新方面領先,其複合年成長率(CAGR)高達13.7%,這主要得益於人工智慧模型生命週期管理和遠端監控功能被添加到編配堆疊中。服務收入雖然不高,但至關重要,包括整合傳統PLC以及在棕地工業場所部署即時作業系統。
晶片製造商之間的激烈競爭正在降低單價,並推動低功耗人工智慧推理卡的廣泛應用,這些推理卡能夠承受工業級溫度範圍。英特爾的 18A藍圖將提高收發器密度,並提升智慧閘道的確定性吞吐量。同時,研華和 Namura 的零配置框架將透過自動化節點配置來降低整合成本,這預示著圍繞硬體的託管服務未來將蓬勃發展。
到2024年,本地部署解決方案將佔據邊緣運算市場67.2%的佔有率。隨著企業在超大規模雲端中採用集中式模型訓練,並在工廠單元中採用分散式推理,混合雲端邊緣運算將以14.9%的複合年成長率快速成長。企業將嘗試工作負載分層,在本地運行即時推理,並將非時間關鍵型分析任務在夜間回程傳輸傳到區域可用區。
空氣間隙的郵輪支付系統展現了本地部署的強大韌性,即使衛星連線中斷也能繼續運作。另一方面,微軟對 Armada 的投資則反映了這家超大規模雲端服務商的信心,他們認為跨雲端和邊緣的統一控制平台最終將贏得市場。如今,供應商提供的設備已預先註冊了他們的雲端主機,從而能夠實現從單一站點概念驗證到多國部署的無縫擴展。
邊緣運算市場按元件(硬體、軟體、服務)、配置(本地部署、雲端部署)、終端用戶產業(製造業和工業、能源和公共產業、其他)、應用領域(工業IoT、預測性維護、其他)、企業規模(大型企業、中小企業)和地區進行細分。市場預測以美元計價。
區域分析
到2024年,北美將佔據邊緣運算市場24.8%的佔有率,這主要得益於強勁的5G部署、龐大的超大規模資料中心網路以及政府對半導體生產的公共資金支持。拜登政府已撥款2.69億美元用於一項微電子計劃,以增強國內邊緣硬體能力。在美國,公共產業正在利用專用LTE和強大的MEC節點實現電網營運現代化,預計到2025年,75%的企業產生資料將保留在源頭或附近。加拿大也正在效仿,致力於開發對廣域網路延遲容忍度極低的自主採礦和能源工作流程。
亞太地區是成長最快的地區,預計到2030年複合年成長率將達到15.1%。中國的「新基建」政策鼓勵在製造群附近建造邊緣資料中心,華為計畫將2024年營收的20.8%投入人工智慧、汽車和雲端服務等領域的研發。印度的智慧城市計畫整合了邊緣運算的監控和交通最佳化技術,日本領先的自動化公司正在將確定性乙太網路和TSN技術應用於其生產線。區域通訊業者正積極部署光纖網路,將邊緣聚合數據回程傳輸傳至城域核心網,從而最大限度地減少抖動,提升身臨其境型遊戲和遠距臨場系統。
其他福利:
- Excel格式的市場預測(ME)表
- 3個月的分析師支持
目錄
第1章 引言
- 研究假設和市場定義
- 調查範圍
第2章調查方法
第3章執行摘要
第4章 市場情勢
- 市場概覽
- 市場促進因素
- 5G部署推動超低延遲應用場景
- 物聯網終端的激增和邊緣資料引力
- 資料主權法規(例如歐盟資料法)
- 降低邊緣推理加速器的ASIC/SoC成本
- 能源效率目標(ESG)驅動微型資料中心
- RISC-V 和晶片組架構的興起使得客製化邊緣晶片成為可能。
- 市場限制
- 擴大分散式節點的網路攻擊面
- 部署和管理異質邊緣堆疊方面的技能差距
- 互通性與標準碎片化(MEC、Open-RAN、LF Edge)
- 棕地工業維修投資報酬率低
- 供應鏈分析
- 技術展望
- 監管環境
- 波特五力分析
- 供應商的議價能力
- 買方的議價能力
- 新進入者的威脅
- 替代品的威脅
- 競爭對手之間的競爭
- 評估影響市場的宏觀經濟因素
第5章 市場規模與成長預測
- 按組件
- 硬體
- 軟體
- 服務
- 透過部署模式
- 本地部署
- 雲
- 按最終用戶行業分類
- 製造業和工業
- 能源與公共產業
- 醫療保健和生命科學
- 零售與電子商務
- BFSI
- 資訊科技/通訊
- 其他
- 透過使用
- 工業IoT和預測性維護
- 視訊分析與監控
- 自動駕駛汽車和無人機
- 其他
- 按公司規模
- 主要企業
- 小型企業
- 按地區
- 北美洲
- 美國
- 加拿大
- 墨西哥
- 南美洲
- 巴西
- 阿根廷
- 其他南美洲
- 歐洲
- 德國
- 英國
- 法國
- 義大利
- 西班牙
- 俄羅斯
- 其他歐洲地區
- 亞太地區
- 中國
- 日本
- 印度
- 韓國
- 澳洲和紐西蘭
- 東南亞
- 亞太其他地區
- 中東和非洲
- 中東
- 沙烏地阿拉伯
- 阿拉伯聯合大公國
- 土耳其
- 其他中東地區
- 非洲
- 南非
- 奈及利亞
- 埃及
- 其他非洲地區
- 北美洲
第6章 競爭情勢
- 市場集中度
- 策略趨勢
- 市佔率分析
- 公司簡介
- Amazon Web Services(AWS)
- Microsoft Corporation
- Cisco Systems Inc.
- Huawei Technologies Co. Ltd.
- IBM Corporation
- Hewlett Packard Enterprise(HPE)
- Dell Technologies Inc.
- Google LLC(Alphabet Inc.)
- Intel Corporation
- NVIDIA Corporation
- Juniper Networks Inc.
- Advantech Co. Ltd.
- ADLINK Technology Inc.
- Schneider Electric SE
- Siemens AG
- Capgemini Engineering
- EdgeIQ(MachineShop Inc.)
- Vapor IO Inc.
- Litmus Automation
- FogHorn Systems
- Lumen Technologies Inc.
第7章 市場機會與未來展望
The edge computing market size is estimated at USD 227.80 billion in 2025 and is on track to reach USD 424.15 billion by 2030, advancing at a 13.24% CAGR.
Intensifying data-gravity at the network edge, the roll-out of 5G radio access networks, and global data-sovereignty mandates are redefining enterprise architecture by shifting time-sensitive processing away from centralized clouds. Hardware vendors benefit from falling ASIC and SoC prices that lower entry barriers for real-time AI inference, while telecom operators carve new revenue streams through multi-access edge compute (MEC) services aligned with ETSI Phase 4 specifications. Enterprises in manufacturing, energy, and mobility adopt edge nodes to minimize latency, protect sensitive data, and improve operational resilience. At the same time, cloud hyperscalers extend managed services to customer premises, enabling unified observability and lifecycle management of distributed workloads
Global Edge Computing Market Trends and Insights
5G Roll-out Catalyzing Ultra-Low-Latency Use-Cases
Global 5G deployments enable sub-millisecond latency that autonomous vehicles, telesurgery, and immersive maintenance applications require. Verizon and NVIDIA have begun piloting real-time AI services on private 5G networks, anchoring edge nodes at base stations to meet stringent round-trip delay budgets. Hyperscalers now colocate micro-data-centres at telecom exchanges, allowing developers to push containers closer to users. ETSI MEC Phase 4 profiles create common APIs, helping operators monetize differentiated latency tiers while ensuring workload portabilit.The investment cycle aligns with governments funding rural 5G coverage, extending edge-powered services beyond dense urban corridors.
Proliferation of IoT Endpoints and Data Gravity
Industrial sites deploy thousands of sensors that stream terabytes daily, making centralized analytics both costly and sluggish. Manufacturers report 89% intent to shift AI inference to local gateways for real-time quality control. Edge-native architectures cut bandwidth expenses and avoid cloud egress charges by keeping high-volume data onsite until summarized. Platforms such as TCS Clever Energy use local inference to flag anomalies and trigger immediate corrective action. As IoT devices integrate lightweight GPUs and NPUs, they can execute vision models autonomously, freeing backhaul links for supervisory tasks.
Cyber-Attack Surface Expansion at Distributed Nodes
Every gateway, sensor, and micro-data-centre becomes a potential ingress point, raising the probability of lateral movement across converged IT/OT networks. Industrial operators deploy zero-trust firmware, hardware root-of-trust, and TPM-backed attestation, yet retrofitted legacy devices often lack secure boot sequences. Physical tampering risk climbs as edge nodes leave protected data-centre premises and reside on factory floors or in roadside cabinets. The scarcity of real-time forensics tools that run locally hampers incident response, extending mean-time-to-contain breaches.
Other drivers and restraints analyzed in the detailed report include:
- Regulatory Data-Sovereignty Mandates
- Declining ASIC/SoC Costs for Edge Inference Accelerators
- Skills Gap in Deploying and Managing Heterogeneous Edge Stacks
For complete list of drivers and restraints, kindly check the Table Of Contents.
Segment Analysis
Hardware accounted for 45.2% of the edge computing market in 2024, reflecting the up-front capital required for ruggedized servers, accelerators, and field-deployable storage. The edge computing market size for hardware reached USD 102.8 billion in 2025 and is expected to grow steadily as ASIC prices fall. Software platforms trail in revenue but lead in innovation, posting the highest 13.7% CAGR as orchestration stacks add AI model lifecycle management and remote observability. Services revenue remains modest yet essential, addressing integration of legacy PLCs and real-time operating systems within brownfield industrial sites.
Intense competition among chipmakers compresses unit costs, enabling high-volume deployment of low-power AI inference cards that withstand industrial temperature ranges. Intel's 18A roadmap improves transceiver density, boosting deterministic throughput in intelligent gateways. Simultaneously, zero-touch deployment frameworks from Advantech and Namla lower integration costs by automating node provisioning, signalling future growth for managed services that wrap around hardware.
On-premises solutions retained 67.2% of the edge computing market in 2024, driven by data locality and deterministic latency requirements. Hybrid-cloud edges grow rapidly at 14.9% CAGR as enterprises adopt central model training in hyperscale clouds with distributed inference at factory cells. Enterprises pilot workload tiering, where real-time inference runs locally, and non-urgent analytics backhaul to regional availability zones overnight.
Air-gapped cruise-ship payment systems illustrate on-premises resilience, continuing operation when satellite links fail. Conversely, Microsoft's investment in Armada reflects hyperscaler conviction that unified control planes spanning cloud and edge will win long term. Vendors now ship appliances pre-registered with cloud consoles, enabling frictionless expansion from single-site POCs to multi-country estates
Edge Computing Market is Segment by Component (Hardware, Software, Services), Deployment (On Premise, Cloud), End User Industry (Manufacturing and Industrial, Energy and Utilities, and More), Application (Industrial IoT and Predictive Maintenance, and More), Organization Size (Large Enterprise, Small and Medium Enterprise), and by Geography. The Market Forecasts are Provided in Terms of Value (USD).
Geography Analysis
North America held 24.8% of the edge computing market in 2024, anchored by robust 5G deployment, a vast hyperscaler footprint, and public funding for semiconductor production. The Biden administration allocated USD 269 million to micro-electronics programs that strengthen domestic edge hardware capacity. Utilities in the United States deploy private LTE coupled with ruggedized MEC nodes to modernize grid operations, and 75% of enterprise-generated data is forecast to remain at or near the source by 2025 Canada follows, targeting autonomous mining and energy workflows that cannot tolerate WAN latency.
Asia Pacific is the fastest-growing region at a 15.1% CAGR through 2030. China's "new infrastructure" policy incentivizes edge data-centre buildouts close to manufacturing clusters, and Huawei invested 20.8% of its 2024 revenue back into research and development that spans AI, automotive, and cloud services. India's smart-city programs integrate edge-enabled surveillance and traffic optimization, while Japan's automation giants embed deterministic Ethernet and TSN in production lines. Regional telcos leverage aggressive fiber roll-outs to backhaul edge aggregates to metro cores, minimizing jitter for immersive gaming and telepresence.
- Amazon Web Services (AWS)
- Microsoft Corporation
- Cisco Systems Inc.
- Huawei Technologies Co. Ltd.
- IBM Corporation
- Hewlett Packard Enterprise (HPE)
- Dell Technologies Inc.
- Google LLC (Alphabet Inc.)
- Intel Corporation
- NVIDIA Corporation
- Juniper Networks Inc.
- Advantech Co. Ltd.
- ADLINK Technology Inc.
- Schneider Electric SE
- Siemens AG
- Capgemini Engineering
- EdgeIQ (MachineShop Inc.)
- Vapor IO Inc.
- Litmus Automation
- FogHorn Systems
- Lumen Technologies Inc.
Additional Benefits:
- The market estimate (ME) sheet in Excel format
- 3 months of analyst support
TABLE OF CONTENTS
1 INTRODUCTION
- 1.1 Study Assumptions and Market Definition
- 1.2 Scope of the Study
2 RESEARCH METHODOLOGY
3 EXECUTIVE SUMMARY
4 MARKET LANDSCAPE
- 4.1 Market Overview
- 4.2 Market Drivers
- 4.2.1 5G roll-out catalysing ultra-low-latency use-cases
- 4.2.2 Proliferation of IoT endpoints and data gravity at the edge
- 4.2.3 Regulatory data-sovereignty mandates (e.g., EU Data Act)
- 4.2.4 Declining ASIC/SoC costs for edge inference accelerators
- 4.2.5 Energy-efficiency targets driving micro-data-centres (ESG)
- 4.2.6 Rise of RISC-V and chiplet architectures enabling custom edge silicon
- 4.3 Market Restraints
- 4.3.1 Cyber-attack surface expansion at distributed nodes
- 4.3.2 Skills gap in deploying and managing heterogeneous edge stacks
- 4.3.3 Inter-operability and standards fragmentation (MEC, Open-RAN, LF Edge)
- 4.3.4 Inefficient ROI for brown-field industrial retro-fits
- 4.4 Supply-Chain Analysis
- 4.5 Technological Outlook
- 4.6 Regulatory Landscape
- 4.7 Porter's Five Force Analysis
- 4.7.1 Bargaining Power of Suppliers
- 4.7.2 Bargaining Power of Buyers
- 4.7.3 Threat of New Entrants
- 4.7.4 Threat of Substitutes
- 4.7.5 Intensity of Competitive Rivalry
- 4.8 Assesment of Macroeconomic Factors on the market
5 MARKET SIZE AND GROWTH FORECASTS (VALUE)
- 5.1 By Component
- 5.1.1 Hardware
- 5.1.2 Software
- 5.1.3 Services
- 5.2 By Deployment Mode
- 5.2.1 On-Premise
- 5.2.2 Cloud
- 5.3 By End-user Industry
- 5.3.1 Manufacturing and Industrial
- 5.3.2 Energy and Utilities
- 5.3.3 Healthcare and Life Sciences
- 5.3.4 Retail and E-commerce
- 5.3.5 BFSI
- 5.3.6 Telecommunications and IT
- 5.3.7 Others
- 5.4 By Application
- 5.4.1 Industrial IoT and Predictive Maintenance
- 5.4.2 Video Analytics and Surveillance
- 5.4.3 Autonomous Vehicles and Drones
- 5.4.4 Others
- 5.5 By Organisation Size
- 5.5.1 Large Enterprises
- 5.5.2 Small and Medium Enterprises
- 5.6 By Geography
- 5.6.1 North America
- 5.6.1.1 United States
- 5.6.1.2 Canada
- 5.6.1.3 Mexico
- 5.6.2 South America
- 5.6.2.1 Brazil
- 5.6.2.2 Argentina
- 5.6.2.3 Rest of South America
- 5.6.3 Europe
- 5.6.3.1 Germany
- 5.6.3.2 United Kingdom
- 5.6.3.3 France
- 5.6.3.4 Italy
- 5.6.3.5 Spain
- 5.6.3.6 Russia
- 5.6.3.7 Rest of Europe
- 5.6.4 APAC
- 5.6.4.1 China
- 5.6.4.2 Japan
- 5.6.4.3 India
- 5.6.4.4 South Korea
- 5.6.4.5 Australia and New Zealand
- 5.6.4.6 Southeast Asia
- 5.6.4.7 Rest of APAC
- 5.6.5 Middle East and Africa
- 5.6.5.1 Middle East
- 5.6.5.1.1 Saudi Arabia
- 5.6.5.1.2 United Arab Emirates
- 5.6.5.1.3 Turkey
- 5.6.5.1.4 Rest of Middle East
- 5.6.5.2 Africa
- 5.6.5.2.1 South Africa
- 5.6.5.2.2 Nigeria
- 5.6.5.2.3 Egypt
- 5.6.5.2.4 Rest of Africa
- 5.6.1 North America
6 COMPETITIVE LANDSCAPE
- 6.1 Market Concentration
- 6.2 Strategic Moves
- 6.3 Market Share Analysis
- 6.4 Company Profiles (includes Global level Overview, Market level overview, Core Segments, Financials, Strategic Information, Market Rank/Share, Products and Services, Recent Developments)
- 6.4.1 Amazon Web Services (AWS)
- 6.4.2 Microsoft Corporation
- 6.4.3 Cisco Systems Inc.
- 6.4.4 Huawei Technologies Co. Ltd.
- 6.4.5 IBM Corporation
- 6.4.6 Hewlett Packard Enterprise (HPE)
- 6.4.7 Dell Technologies Inc.
- 6.4.8 Google LLC (Alphabet Inc.)
- 6.4.9 Intel Corporation
- 6.4.10 NVIDIA Corporation
- 6.4.11 Juniper Networks Inc.
- 6.4.12 Advantech Co. Ltd.
- 6.4.13 ADLINK Technology Inc.
- 6.4.14 Schneider Electric SE
- 6.4.15 Siemens AG
- 6.4.16 Capgemini Engineering
- 6.4.17 EdgeIQ (MachineShop Inc.)
- 6.4.18 Vapor IO Inc.
- 6.4.19 Litmus Automation
- 6.4.20 FogHorn Systems
- 6.4.21 Lumen Technologies Inc.
7 MARKET OPPORTUNITIES AND FUTURE OUTLOOK
- 7.1 White-space and Unmet-need Assessment
 2025年全球邊緣應用安全市場報告2025年全球電信邊緣負載平衡器市場報告2025年遍存計算技術全球市場報告
 邊緣運算市場機會、成長促進因素、產業趨勢分析及預測(2026-2035年)2025年全球聯網汽車邊緣雲端市場報告2025年全球邊緣功能平台市場報告
 邊緣運算市場:依組件、組織規模、部署方式、應用領域、垂直產業、國家及地區分類-全球產業分析、市場規模、市場佔有率及2025-2032年預測
 超大規模計算市場規模、佔有率和成長分析(按組件、公司規模、應用、最終用途和地區分類)-2025-2032年產業預測
 邊緣雲端市場預測至 2032 年:按組件、部署類型、組織規模、應用程式、最終用戶和地區分類的全球分析
 製造業邊緣運算:全球市場佔有率和排名、總收入和需求預測(2025-2031 年)