


 |
市場調查報告書
商品編碼
1851827
電線電纜:市場佔有率分析、產業趨勢、統計數據、成長預測(2025-2030 年)Wire And Cable - Market Share Analysis, Industry Trends & Statistics, Growth Forecasts (2025 - 2030) |
||||||
※ 本網頁內容可能與最新版本有所差異。詳細情況請與我們聯繫。
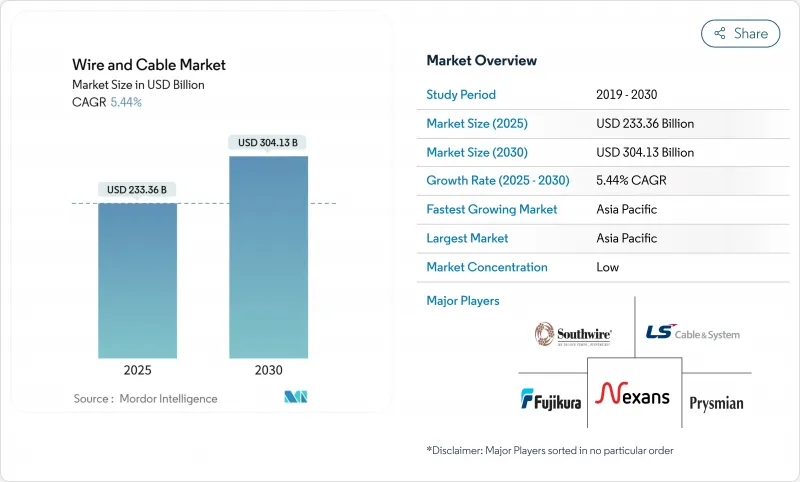
預計到 2025 年,電線電纜市場規模將達到 2,333.6 億美元,預計到 2030 年將達到 3,041.3 億美元,在預測期(2025-2030 年)內複合年成長率為 5.44%。
隨著電網向分散式發電轉型,以及支援人工智慧資料中心和5G骨幹網路的數位基礎設施不斷擴展,需求將加速成長。離岸風力發電的海底出口連結、人口稠密經濟體的光纖到戶(FTTH)部署以及交通電氣化正在重塑產品組合、生產佈局和採購週期。一方面,交聯聚乙烯(XLPE)化合物供不應求;另一方面,銅價屢創新高,導致計劃預算不斷攀升。能夠獲得原料合約、增加高壓產能並在成長地區實現在地化生產的企業,將獲得競爭優勢。
全球電線電纜市場趨勢與洞察
北海和東亞地區對離岸風電高壓電纜的需求正在迅速成長。
自2020年以來,創紀錄的離岸風力發電使高壓海底電纜的年度訂單競標。得標電纜長度從2016年的759公里飆升至2022年的近2000公里,導致2025年合約的前置作業時間從12-18個月延長至24-30個月。光是北海到2030年就需要超過8,000公里的出口電纜,而從東亞到2033年將新增146吉瓦的裝置容量。市場領導持續擴張:普睿司曼公司簽署了一份價值50億美元的德國計劃契約,NKT公司正在將其位於卡爾斯克魯納的工廠產能翻番,耐克森公司則正在增加第二艘挪威電纜鋪設船。目前,全球僅有六家供應商具備生產800千伏/4吉瓦直流電纜的資格,導致產能日益緊張。
印度和東協加速推進光纖到戶部署
到2025年,印度的BharatNet預算將成長238%,達到2,200億盧比,用於興建1,2,000條新的光纖到戶(FTTH)線路和69,2676公里的光纖。預端接組件和微型溝槽技術已將農村地區的部署成本降低了30%,並縮短了安裝時間。東協各國政府的目標是到2030年使40%的家庭能夠使用1Gbps的消費級網路,從而加速從銅纜到光纖的轉換。因此,光纖普及率的提高促使電纜製造商將資本投資從利潤較低的銅纜區域網路電纜轉向光纖預製棒、光纖帶和微導管產品。
交聯聚乙烯樹脂供應瓶頸限制了高功率電動車的生產。
交聯聚乙烯的短缺導致特高壓電纜的前置作業時間比2022年水準延長了30%至40%。表面缺陷研究表明,刮痕會使電場應力增加1.6倍,並將擊穿電壓從129.6千伏降低至59.1千伏,導致更多工廠測試失敗。德克薩斯州和新加坡的擴建計畫要到2026年底才能達到額定容量,這將進一步加劇供應緊張的局面。目前,電網營運商正在競標混合方案,該方案結合了氣體絕緣母線槽和有限的電纜敷設,以填補供應缺口。
細分市場分析
2024年,低壓電纜將維持54%的收入佔有率,主要受住宅建設和家用電子電器的推動。儘管銷量下降,超高壓電纜仍將維持7.9%的複合年成長率,這得益於離岸風力發電和遠距可再生能源併網計劃的推動。預計到2030年,高壓產品在電線電纜市場的佔有率將穩定成長。各國為實現碳中和電網而製定的國家能源政策目標,將推動±525kV高壓直流輸電線路的大規模採購,從而縮短交付週期,並鎖定未來數年的OEM生產佔有率。
歐洲的投資動能最為強勁,2025年至2027年間電網擴建總合預算將超過500億歐元。可再生能源併網走廊的加速監管也支撐了高壓輸電線路電纜市場規模的成長。製造商正透過採用更大規模的連續硫化生產線、線上局部放電監測和機器人絕緣擠出等方式來提高產量並降低次品率。
到2024年,電力電纜將佔總收入的61%,這反映了電網和工業電氣化的支出。光纖收入雖然佔比較小,但預計到2030年將以每年8.6%的速度成長,這主要得益於各國政府資助普及寬頻建設,以及雲端超大規模資料中心業者延遲要求極高的骨幹網路。這一差異表明,光纖是整個線纜市場的主要成長引擎。對抗彎曲性強的扁平電纜和小直徑微型電纜的需求不斷成長,正促使玻璃預製棒供應商擴大生產規模,並推出無氫製程。
光纖的應用範圍已從電訊擴展到工廠自動化、智慧建築和惡劣環境感測等領域。多芯光纖電纜正在取代機器人領域傳統的銅芯串行電纜,提供抗電磁干擾和減輕重量的優勢。隨著光纖到戶(FTTH)的普及,預計未來十年內,由光纖叢集驅動的線纜市場規模將超過室內Cat6線。
這份電線電纜市場報告按電壓等級(特高壓、中壓、其他)、電纜類型(電力電纜、光纖電纜、其他)、導體材料(銅、鋁、光學玻璃/聚合物)、安裝方式(架空、其他)、最終用戶(住宅建築、商業建築、其他)和地區進行細分。市場預測以美元計價。
區域分析
亞太地區將在2024年佔全球營收的54%,並預計到2030年將以6.1%的複合年成長率成長。中國超高壓電網和聚合物化合物的領先地位確保了該地區的規模經濟效益,而印度的BharatNet項目和智慧計量目標正推動國內電纜工廠轉向光纖和架空束狀導體的生產。東南亞各國政府正大力推動海底電力互聯項目,以平衡可再生能源的供應,並擴大區域電廠的採購配額。
北美正優先考慮可再生能源的整合和韌性。到2030年,美國大西洋沿岸離岸風力發電電場需要10吉瓦的出口裝置容量。拜登政府的「電力增強和分散式能源」(BEAD)計畫正將聯邦補貼用於農村光纖建設,以滿足國內對鬆套管和自主型(ADSS)輸電線路的需求。加拿大向美國美國和中西部地區輸送水力發電需要使用能夠承受阿爾卑斯山極端高溫的525千伏特高壓直流電纜。
歐洲的脫碳之路仰賴互聯互通的電網。僅德國就已累計213億歐元用於高壓直流輸電走廊建設,並與LS Cables公司簽署了多項協議。歐盟的「跨歐洲能源網路計畫」將加快跨國核准流程,並擴大電線電纜市場規模。北歐國家正致力於綠氫能出口,促使海底電纜開發商考慮在未來的氫能管道沿線建造兼具電力和數據傳輸功能的骨幹網路。
撒哈拉以南非洲是一個亟待發展的成長前沿地區。中壓「Mission 300」計畫和雙邊氣候融資承諾將調動400億美元用於電氣化,從而擴大33千伏中壓饋線、絕緣架空電纜和配電變壓器領域的機會。開發銀行的競標包含在地化條款,鼓勵合資企業,全球原始設備製造商也鼓勵提升當地勞動力的技能並轉移品質保證通訊協定。
其他福利:
- Excel格式的市場預測(ME)表
- 3個月的分析師支持
目錄
第1章 引言
- 研究假設和市場定義
- 調查範圍
第2章調查方法
第3章執行摘要
第4章 市場情勢
- 市場概覽
- 市場促進因素
- 北海和東亞地區對離岸風電高壓電纜的需求正在迅速成長。
- 加速印度和東協家庭光纖部署
- 電動車平台汽車線束的電氣化
- 多邊資助的撒哈拉以南非洲電網互聯計劃
- 市場限制
- 交聯聚乙烯樹脂供應瓶頸限制了高功率電動車的生產。
- 銅價波動對中東和北非的貿易利潤帶來壓力。
- 價值/供應鏈分析
- 監理展望
- 技術展望
- 波特五力分析
- 供應商的議價能力
- 買方的議價能力
- 新進入者的威脅
- 替代品的威脅
- 競爭對手之間的競爭
- 宏觀經濟影響評估
- 投資分析
第5章 市場規模與成長預測
- 透過電壓
- 超高壓(35kV 或更高)
- 中壓(1-35千伏特)
- 低電壓(低於1千伏特)
- 按電纜類型
- 電源線
- 光纖電纜
- 訊號和控制電纜
- 同軸電纜和資料電纜
- 按導體材料
- 銅
- 鋁
- 光學玻璃/聚合物
- 透過裝置
- 虛構的
- 地下
- 海底
- 按行業
- 建築 - 住房
- 建築商業
- 電力基礎設施(公共產業和可再生能源)
- 通訊和資料中心
- 石油天然氣和石化
- 汽車與出行
- 工業生產
- 按地區
- 北美洲
- 美國
- 加拿大
- 墨西哥
- 南美洲
- 巴西
- 阿根廷
- 其他南美洲國家
- 歐洲
- 英國
- 德國
- 法國
- 義大利
- 其他歐洲地區
- 中東和非洲
- 沙烏地阿拉伯
- 阿拉伯聯合大公國
- 南非
- 其他中東和非洲地區
- 亞太地區
- 中國
- 日本
- 印度
- 韓國
- 亞太其他地區
- 北美洲
第6章 競爭情勢
- 市場集中度
- 策略趨勢
- 市佔率分析
- 公司簡介
- Prysmian Group
- Nexans
- Sumitomo Electric Industries, Ltd.
- LS Cable and System Ltd.
- Southwire Company, LLC
- Fujikura Ltd.
- Furukawa Electric Co., Ltd.
- NKT A/S
- Belden Inc.
- CommScope Holding Co., Inc.
- TE Connectivity Ltd.
- Corning Incorporated
- Leoni AG
- Amphenol Corporation
- HELUKABEL GmbH
- Jiangsu Zhongtian Technology Co., Ltd.
- Heng Tong Optic-Electric Co., Ltd.
- Riyadh Cables Group
- Polycab India Ltd.
- KEI Industries Ltd.
- ZTT Group
第7章 市場機會與未來展望
The Wire And Cable Market size is estimated at USD 233.36 billion in 2025, and is expected to reach USD 304.13 billion by 2030, at a CAGR of 5.44% during the forecast period (2025-2030).
Demand accelerates as power grids pivot toward distributed generation and as digital infrastructure scales to support AI-enabled data centers and 5G backbones. Submarine export links for offshore wind, fiber-to-the-home (FTTH) roll-outs in populous economies, and the electrification of transport are reshaping product mixes, manufacturing footprints, and procurement cycles. Short supply of cross-linked polyethylene (XLPE) compounds on one side and record-high copper prices on the other are inflating project budgets, yet policy-backed capital flows into clean-energy and digital-inclusion programs offset these pressures. Competitive advantage is gravitating toward firms that can secure raw-material contracts, ramp high-voltage capacity, and localize production in growth regions.
Global Wire And Cable Market Trends and Insights
Surging Offshore Wind HV Cable Demand in North Sea & East Asia
Record auction volumes for offshore wind have doubled annual high-voltage submarine cable orders since 2020. Awarded lengths jumped from 759 km in 2016 to almost 2,000 km in 2022, pushing lead times from 12-18 months to 24-30 months for 2025 contracts. The North Sea alone will require over 8,000 km of export links by 2030, while East Asia adds 146 GW of capacity by 2033. Market leaders are expanding: Prysmian signed USD 5 billion of German projects, NKT is doubling its Karlskrona plant output, and Nexans is adding a second Norwegian cable-lay vessel. Only six global suppliers now qualify for +-800 kV/4 GW DC cables, intensifying a capacity crunch.
Accelerated Fiber-to-Home Roll-outs in India & ASEAN
India's BharatNet budget rose 238% to INR 22,000 crore in 2025, enabling 12 lakh new FTTH lines and 692,676 km of optical fiber. Pre-terminated assemblies and micro-trenching have lowered rural deployment costs by 30% and cut installation time. ASEAN governments are targeting 1 Gbps consumer plans for 40% of households by 2030, accelerating copper switch-off timetables. Consequently, fiber take-rates are nudging cable makers to shift capex from low-margin LAN copper to optical glass preform, ribbon, and micro-duct products.
XLPE Resin Supply Bottlenecks Limiting EHV Output
Cross-linked polyethylene shortages have stretched lead times for extra-high-voltage cable by 30-40% compared with 2022 levels. Surface-defect studies show scratches can raise electric-field stress 1.6X and cut breakdown voltage from 129.6 kV to 59.1 kV, forcing more rejects at factory tests. Planned expansions in Texas and Singapore will not reach nameplate capacity until late 2026, prolonging tightness. Grid operators now tender hybrid packages that combine gas-insulated bus ducts and limited cable runs to bridge the supply gap.
Other drivers and restraints analyzed in the detailed report include:
- Electrification of Automotive Harnesses for EV Platforms
- Sub-Saharan Grid Interconnect Projects Unlocking Multilateral Funding
- Copper Price Volatility Squeezing Contractor Margins in MENA
For complete list of drivers and restraints, kindly check the Table Of Contents.
Segment Analysis
Low-Voltage cables retained 54% revenue in 2024, anchored by residential build-outs and consumer electronics. Extra- & High-Voltage lines, though smaller in volume, are forecast to post a 7.9% CAGR as offshore wind farms and long-haul renewables drive interconnector projects. Owing to this trajectory, the wire and cable market share of high-voltage products is set to climb steadily through 2030. National Energy Policy targets for carbon-neutral grids stimulate bulk procurement of +-525 kV HVDC links, compressing delivery cycles and locking OEM production slots years ahead.
Investment momentum is most evident in Europe, where combined grid-expansion budgets exceed EUR 50 billion for 2025-2027, and in China's West-to-East transmission corridors. The wire and cable market size for high-voltage lines is supported by regulatory fast-tracking of renewable-integration corridors. Manufacturers are responding with larger continuous vulcanization lines, on-line partial-discharge monitoring, and robotized insulation extrusion to lift output and cut defect rates.
Power cables delivered 61% of the 2024 turnover, reflecting grid spending and industrial electrification. Fiber-optic revenue, while smaller, is projected to grow 8.6% annually to 2030 as governments fund universal broadband and cloud hyperscalers build latency-sensitive backbones. This differential positions fiber as the chief growth engine inside the broader wire and cable market. Rising demand for bend-insensitive ribbon and reduced-diameter micro-cables spurs glass-preform suppliers to expand and bring more hydrogen-free processes online.
Beyond telecoms, fiber penetrates factory automation, smart buildings, and harsh-environment sensing. Multi-core optical cables now replace legacy serial copper in robotics, offering EMI immunity and weight savings. As FTTH penetration deepens, the wire and cable market size attributed to optical glass clusters is forecast to overtake indoor Cat6 volumes by the decade's end.
The Wire and Cable Market Report Segmented by Voltage (Extra- and High-Voltage, Medium-Voltage, and More), Cable Type (Power Cable, Fiber-Optic Cable, and More), Conductor Material (Copper, Aluminum, Optical Glass / Polymer), Installation (Overhead, and More), End-User Vertical (Construction-Residential, Construction-Commercial, and More), and Geography. The Market Forecasts are Provided in Terms of Value (USD).
Geography Analysis
Asia Pacific anchored 54% of global 2024 revenue and is set to expand at a 6.1% CAGR to 2030. China's ultra-high-voltage grid corridors and its dominance in polymer compounding secure regional-scale economics, while India's BharatNet and Smart Metering goals redirect domestic cable factories toward fiber and aerial bundled conductors. Southeast Asian governments are rolling out undersea power interconnections to balance renewable resources, enlarging procurement lots for regional plants.
North America emphasizes renewable integration and resilience. U.S. offshore wind zones along the Atlantic require 10 GW of export capacity by 2030, and the Biden administration's BEAD program channels federal grants toward rural fiber builds, lifting domestic demand for loose-tube and all-dielectric self-supporting (ADSS) lines. Canada's hydro-export links to the U.S. Northeast and Midwest seek 525 kV HVDC cables rated for extreme Alpine temperatures.
Europe's decarbonization pathway hinges on interconnected grids; Germany alone earmarked EUR 21.3 billion for HVDC corridors, contracting LS Cable for multiple packages. The EU Trans-European Networks for Energy scheme accelerates cross-border approvals, enlarging the addressable wire and cable market. Nordic nations' focus on green hydrogen export compels subsea cable developers to consider dual-use power and data backbones along future hydrogen pipelines.
Sub-Saharan Africa remains the underserved growth frontier. Mission 300 and bilateral climate-finance pledges mobilize USD 40 billion for electrification and extend opportunities in 33-kV medium-voltage feeders, insulated overhead cables, and distribution transformers. Localization clauses within Development Bank tenders encourage joint ventures, nudging global OEMs to upskill regional workforces and transfer quality-assurance protocols.
- Prysmian Group
- Nexans
- Sumitomo Electric Industries, Ltd.
- LS Cable and System Ltd.
- Southwire Company, LLC
- Fujikura Ltd.
- Furukawa Electric Co., Ltd.
- NKT A/S
- Belden Inc.
- CommScope Holding Co., Inc.
- TE Connectivity Ltd.
- Corning Incorporated
- Leoni AG
- Amphenol Corporation
- HELUKABEL GmbH
- Jiangsu Zhongtian Technology Co., Ltd.
- Heng Tong Optic-Electric Co., Ltd.
- Riyadh Cables Group
- Polycab India Ltd.
- KEI Industries Ltd.
- ZTT Group
Additional Benefits:
- The market estimate (ME) sheet in Excel format
- 3 months of analyst support
TABLE OF CONTENTS
1 INTRODUCTION
- 1.1 Study Assumptions and Market Definition
- 1.2 Scope of the Study
2 RESEARCH METHODOLOGY
3 EXECUTIVE SUMMARY
4 MARKET LANDSCAPE
- 4.1 Market Overview
- 4.2 Market Drivers
- 4.2.1 Surging Offshore Wind HV Cable Demand in North Sea and East Asia
- 4.2.2 Accelerated Fiber-to-the-Home Roll-outs in India and ASEAN
- 4.2.3 Electrification of Automotive Harnesses for EV Platforms
- 4.2.4 Sub-Saharan Grid Interconnect Projects Unlocking Multilateral Funding
- 4.3 Market Restraints
- 4.3.1 XLPE Resin Supply Bottlenecks Limiting EHV Output
- 4.3.2 Copper Price Volatility Squeezing Contractor Margins in MENA
- 4.4 Value / Supply-Chain Analysis
- 4.5 Regulatory Outlook
- 4.6 Technological Outlook
- 4.7 Porter's Five Forces Analysis
- 4.7.1 Bargaining Power of Suppliers
- 4.7.2 Bargaining Power of Buyers
- 4.7.3 Threat of New Entrants
- 4.7.4 Threat of Substitutes
- 4.7.5 Intensity of Competitive Rivalry
- 4.8 Macroeconomic Impact Assessment
- 4.9 Investment Analysis
5 MARKET SIZE AND GROWTH FORECASTS (VALUE)
- 5.1 By Voltage
- 5.1.1 Extra- and High-Voltage (Greater Than 35 kV)
- 5.1.2 Medium-Voltage (1-35 kV)
- 5.1.3 Low-Voltage (Less Than 1 kV)
- 5.2 By Cable Type
- 5.2.1 Power Cable
- 5.2.2 Fiber-Optic Cable
- 5.2.3 Signal and Control Cable
- 5.2.4 Coaxial and Data Cable
- 5.3 By Conductor Material
- 5.3.1 Copper
- 5.3.2 Aluminum
- 5.3.3 Optical Glass / Polymer
- 5.4 By Installation
- 5.4.1 Overhead
- 5.4.2 Underground
- 5.4.3 Submarine
- 5.5 By End-User Vertical
- 5.5.1 Construction - Residential
- 5.5.2 Construction - Commercial
- 5.5.3 Power Infrastructure (Utilities and Renewables)
- 5.5.4 Telecommunications and Data Centers
- 5.5.5 Oil and Gas and Petrochemicals
- 5.5.6 Automotive and Mobility
- 5.5.7 Industrial Manufacturing
- 5.6 By Geography
- 5.6.1 North America
- 5.6.1.1 United States
- 5.6.1.2 Canada
- 5.6.1.3 Mexico
- 5.6.2 South America
- 5.6.2.1 Brazil
- 5.6.2.2 Argentina
- 5.6.2.3 Rest of South America
- 5.6.3 Europe
- 5.6.3.1 United Kingdom
- 5.6.3.2 Germany
- 5.6.3.3 France
- 5.6.3.4 Italy
- 5.6.3.5 Rest of Europe
- 5.6.4 Middle East and Africa
- 5.6.4.1 Saudi Arabia
- 5.6.4.2 UAE
- 5.6.4.3 South Africa
- 5.6.4.4 Rest of Middle East and Africa
- 5.6.5 Asia-Pacific
- 5.6.5.1 China
- 5.6.5.2 Japan
- 5.6.5.3 India
- 5.6.5.4 South Korea
- 5.6.5.5 Rest of Asia-Pacific
- 5.6.1 North America
6 COMPETITIVE LANDSCAPE
- 6.1 Market Concentration
- 6.2 Strategic Moves
- 6.3 Market Share Analysis
- 6.4 Company Profiles (includes Global level Overview, Market level overview, Core Segments, Financials as available, Strategic Information, Market Rank/Share for key companies, Products and Services, and Recent Developments)
- 6.4.1 Prysmian Group
- 6.4.2 Nexans
- 6.4.3 Sumitomo Electric Industries, Ltd.
- 6.4.4 LS Cable and System Ltd.
- 6.4.5 Southwire Company, LLC
- 6.4.6 Fujikura Ltd.
- 6.4.7 Furukawa Electric Co., Ltd.
- 6.4.8 NKT A/S
- 6.4.9 Belden Inc.
- 6.4.10 CommScope Holding Co., Inc.
- 6.4.11 TE Connectivity Ltd.
- 6.4.12 Corning Incorporated
- 6.4.13 Leoni AG
- 6.4.14 Amphenol Corporation
- 6.4.15 HELUKABEL GmbH
- 6.4.16 Jiangsu Zhongtian Technology Co., Ltd.
- 6.4.17 Heng Tong Optic-Electric Co., Ltd.
- 6.4.18 Riyadh Cables Group
- 6.4.19 Polycab India Ltd.
- 6.4.20 KEI Industries Ltd.
- 6.4.21 ZTT Group
7 MARKET OPPORTUNITIES AND FUTURE OUTLOOK
- 7.1 White-space and Unmet-need Assessment
 全球銅線電纜市場(至3032年)依絕緣類型、電壓類型、安裝方式(地下、架空、海底)、應用(建築用線、電力電纜、通訊、汽車線束)、終端用戶產業及地區分類
 全球陶瓷電纜市場規模、佔有率、趨勢和成長分析報告(2026-2034年)
 日本延長線市場規模、佔有率、趨勢及預測(按線規類型、應用、分銷管道和地區分類,2026-2034年)日本電線電纜市場規模、佔有率、趨勢和預測:按類型、最終用戶和地區分類,2026-2034年
 2026年全球微管道電纜市場報告2026年全球鋁電纜市場報告2026年全球電線電纜市場報告2026年全球電纜市場報告
 微導管電纜市場-全球產業規模、佔有率、趨勢、機會及預測(依安裝環境、類型、導管類型、直徑、材質、應用、地區及競爭格局分類),2021-2031年架空直流電纜市場-全球產業規模、佔有率、趨勢、機會和預測:按電壓等級、組件、最終用戶、地區和競爭格局分類,2021-2031年