


 |
市場調查報告書
商品編碼
1522873
生物固形物:市場佔有率分析、產業趨勢與統計、成長預測(2024-2029)Biosolids - Market Share Analysis, Industry Trends & Statistics, Growth Forecasts (2024 - 2029) |
||||||
※ 本網頁內容可能與最新版本有所差異。詳細情況請與我們聯繫。
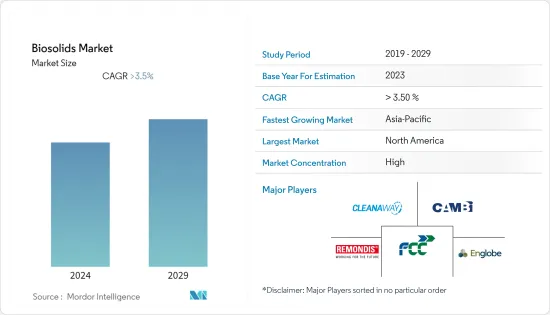
預計2024年生物固形物市場規模為3,312萬噸,預計2029年將達3,982萬噸,在預測期間(2024-2029年)複合年成長率超過3.5%。
COVID-19 大流行對 2020 年生物固形物市場產生了負面影響。然而,自大流行以來,農業領域對生物固形物的需求不斷增加正在推動整個產業的成長。
主要亮點
- 推動市場的關鍵因素之一是替代危險化肥的需要以及世界各國嚴格的排放法規。
- 另一方面,有關公眾可獲得的生物固形物的相互矛盾的資訊預計將抑制所研究市場的成長。
- 亞太地區(主要是中國和印度)對污泥處理的日益關注預計將很快為行業成長提供新的途徑。
- 由於政府和公眾對環保技術的支持,北美在生物固形物市場佔據主導地位。
生物固形物市場趨勢
農地利用主導市場
- 生物固形物可用於農田、森林、牧場或需要掩埋的受干擾土地。
- 從消費量來看,農業用地消耗的生物固形物量最大。亞太和北美人口的持續成長預計將增加對農業產量的需求,這可能對該領域的生物固形物消費產生積極影響。
- 根據國際穀物協會統計,2021-2022年世界糧食總產量約22.94億噸,比上年度增加約3.05%。此外,該委員會預計2022-2023年全球糧食總產量將下降至22.67億噸。不過,預計2023-2024年將達到2,310噸。
- 中國糧食產量約佔全球總產量的7%,養活了全球22%的人口。該國是各種作物的最大生產國,包括水稻、棉花、馬鈴薯和其他作物。
- 根據農業和農民福利部第三次農作物產量預告,2022-23年全國糧食總產量為3.305億噸,高於3.556億噸。
- 科學家和農民正在尋求新技術來提高作物生產力並滿足人口不成比例成長帶來的糧食需求。此外,在過去十年中,美國等國家的可用農業土地數量一直在減少。
- 生物固形物可以有效地用作人類作物生產的肥料和土壤改良劑。通常使用傳統農業設備將生物固形物引入土壤中。它也用作牲畜的肥料。
- 大公司和農民擴大涉足牲畜和肉品。他們正在增加對畜牧生產的需求,這是使用生物固形物作為畜牧生產肥料的驅動力。因此,農業用地對生物固形物的需求不斷增加。
- 生物固形物也有助於降低肥料成本並提供更多作物生長所需的微量營養素。世界人口的成長預計將增加對農業的需求,這可能會影響生物固形物在農業領域的使用。
- 因此,預計農業用地在預測期內將主導市場。
北美市場佔據主導地位
- 由於美國和加拿大等國家政府和公眾對綠色技術的支持,北美在市場上佔據主導地位。
- 在美國,生物固形物市場很大程度上是由政府和公眾都希望使用環保技術這一事實推動的。
- 美國環保署(EPA)採用「生物固形物」一詞來區分優質污水處理污泥與含有大量污染物的原污泥。
- 有多種方法可以處理污水中無法再利用的生物固形物(例如,在垃圾掩埋場中)或以積極的方式使用它們(例如,在具有沼氣或能源回收的掩埋)。
- 生物固形物在污水處理過程中產生,廣泛用於滿足美國環保署 40 CFR 第 503 部分的規定。
- 目前該國產生的大部分生物固形物預計是污染物含量較低的 EQ 或 PC生物固形物。日本產生的生物固形物約有一半有益於土壤改良。
- 在美國,生物固形物被回收或用作肥料,以改善和維持高產量土壤並促進植物生長。透過處理污水污泥,生物固形物可以用作有價值的肥料,而不是佔用垃圾掩埋場或其他處置場的空間。大約一半的生物固形物被回收回土地。
- 隨著美國人口的成長,對食品的需求也迅速成長。 2022年,美國家庭平均食品支出增加約12.72%,達9,343美元。
- 農業部門的成長預計將進一步促進生物固形物的消費。 2022年,農業及相關產業約占美國國內生產總值(GDP)的5.5%。
- 因此,由於上述因素,預計北美在預測期內將佔據最大的市場佔有率。
生物固形物市場的產業概況
生物固形物市場已部分整合。主要企業包括(排名不分先後)REMONDIS SE &Co.KG、Cambi ASA、FCC Group、Englobe 和 Cleanaway。
其他福利:
- Excel 格式的市場預測 (ME) 表
- 3 個月分析師支持
目錄
第1章簡介
- 調查先決條件
- 調查範圍
第2章調查方法
第3章執行概述
第4章市場動態
- 促進因素
- 取代北美有毒化肥
- 嚴格的政府排放法規
- 其他司機
- 抑制因素
- 對生物固形物缺乏正確的知識與認知
- 其他阻礙因素
- 產業價值鏈分析
- 波特五力分析
- 供應商的議價能力
- 消費者議價能力
- 新進入者的威脅
- 替代品的威脅
- 競爭程度
第5章市場區隔(市場規模(基於數量))
- 類型
- A級
- A 級 EQ(卓越品質)
- B級
- 形式
- 蛋糕
- 液體
- 顆粒
- 目的
- 農地利用
- 用於人類作物生產的肥料/土壤改良劑
- 畜牧肥料-牧場
- 非農用地
- 林業作物(土地恢復與林業)
- 土地掩埋(道路與城市濕地)
- 礦區掩埋
- 庭園綠化、休閒區、家庭使用
- 能源回收能源生產
- 產熱、焚燒、氣化
- 石油和水泥生產
- 商業用途
- 農地利用
- 地區
- 亞太地區
- 中國
- 印度
- 日本
- 韓國
- 馬來西亞
- 泰國
- 印尼
- 越南
- 其他亞太地區
- 北美洲
- 美國
- 加拿大
- 墨西哥
- 歐洲
- 德國
- 英國
- 義大利
- 法國
- 西班牙
- 北歐的
- 土耳其
- 俄羅斯
- 歐洲其他地區
- 南美洲
- 巴西
- 阿根廷
- 哥倫比亞
- 南美洲其他地區
- 中東/非洲
- 沙烏地阿拉伯
- 南非
- 奈及利亞
- 卡達
- 埃及
- 阿拉伯聯合大公國
- 其他中東/非洲
- 亞太地區
第6章 競爭狀況
- 併購、合資、聯盟、協議
- 市場佔有率分析
- 主要企業策略
- 公司簡介
- Agrivert Ltd
- Aguas Andinas SA
- Alan Srl
- Allevi Srl
- BCR Environmental
- CRE-Centro di Ricerche Ecologiche
- Cambi ASA
- Casella Waste Systems Inc.
- Cleanaway
- DC Water
- Eco-trass
- Englobe
- FCC Group
- Lystek International
- Merrell Bros. Inc.
- Parker Ag Services LLC
- Recyc Systems Inc.
- REMONDIS SE & Co. KG
- Saur
- SYLVIS
- Synagro Technologies
- Terrapure BR Ltd
- Walker Industries
第7章 市場機會及未來趨勢
- 亞太地區對污泥處理日益關注
- 其他機會
The Biosolids Market size is estimated at 33.12 Million tons in 2024, and is expected to reach 39.82 Million tons by 2029, growing at a CAGR of greater than 3.5% during the forecast period (2024-2029).
The COVID-19 pandemic negatively affected the biosolids market in 2020. However, the growing demand for biosolids on agricultural land has fueled overall industry growth since the pandemic.
Key Highlights
- One of the main things driving the market that was looked at is the need to replace dangerous chemical fertilizers and strict emission laws in many countries around the world.
- On the other hand, contradictory information about biosolids that is available to the public is expected to slow the growth of the market studied.
- The rising focus on sludge treatment in the Asia-Pacific, mainly in China and India, is anticipated to offer new avenues for industry growth shortly.
- North America dominated the biosolids market due to government and public support for environmental-friendly technologies.
Biosolids Market Trends
Agricultural Land Application to Dominate the Market
- Biosolids can be used on agricultural land, in forests, on rangelands, or in disturbed land needing reclamation.
- In terms of consumption, agricultural land applications consume the most biosolids. Consistent population growth across Asia-Pacific and North America is expected to augment the need for agricultural yields, which may positively affect the consumption of biosolids in the sector.
- According to the International Grains Council, in FY 2021-2022, the total grain production globally was about 2,294 million metric tons, about 3.05% more than the previous year. Furthermore, as per the council's estimation in FY 2022-2023, the total global grain production will decrease to 2,267 million metric tons. However, it is anticipated to reach 2,310 in FY 2023-2024.
- China accounts for about 7% of the overall crop production globally, thus feeding 22% of the world's population. The country is the largest producer of different crops, including rice, cotton, potatoes, and other crops.
- According to the Third Advance Estimates for crop production by the Ministry of Agriculture and Farmers Welfare, total foodgrain production in the country in 2022-23 was valued at 330.5 million tonnes (MT) from 315.6 MT.
- Scientists and farmers are looking for new technologies to increase the productivity of crops and meet the food demand arising from disproportionate population growth. In addition, there has been a decrease in the total available cropland area in countries such as the United States over the last decade.
- Biosolids can be effectively used as fertilizers and soil conditioners for human crop production. These are usually incorporated into the soil with conventional farm equipment. They are also used as fertilizer for animal crop production.
- Big enterprises and farmers are increasingly making their presence felt in cattle farming and meat products. They are augmenting the demand for animal crop production, which is providing impetus to the application of biosolids as fertilizers for animal crop production. This has led to an increase in demand for biosolids in agricultural land applications.
- They also help reduce fertilizer costs and provide many micronutrients for crop growth. The increasing world population is expected to give rise to a growing need for agriculture, which may impact the use of biosolids in the sector.
- Hence, agricultural land application is expected to dominate the market studied during the forecast period.
North America to Dominate the Market
- North America dominated the market owing to the government and public support for environmental-friendly technologies in countries such as the United States and Canada.
- In the United States, the biosolids market is mostly driven by the fact that both the government and the public want to use technologies that are good for the environment.
- The US EPA adopted the name "biosolids" to differentiate high-quality treated sewage sludge from raw sewage sludge, which contains large amounts of pollutants.
- There are two ways to get rid of biosolids from wastewater that cannot be used again (like putting them in a landfill) and ways to use them in a good way (like landfilling with biogas and energy recovery).
- Biosolids are generated during wastewater treatment processes and are extensively used to satisfy the US EPA's 40 CFR Part 503 regulations.
- The majority of the biosolids that are currently generated in the country are expected to be EQ or PC biosolids containing low levels of pollutants. About half of the biosolids produced in the country are being beneficially used to improve soils.
- In the United States, biosolids are either recycled or applied as fertilizer to improve and maintain productive soils and stimulate plant growth. By treating sewage sludge, the biosolids are used as valuable fertilizer instead of taking up space in a landfill or other disposal facility. Approximately half of all biosolids are recycled to land.
- The demand for food is growing rapidly with the rising population in the United States. In 2022, the average household spending in the United States on food increased by about 12.72% and was valued at USD 9,343.
- The rising agriculture sector is expected to further boost the consumption of biosolids. Agriculture and related industries contributed to about 5.5% of the US gross domestic product (GDP) in 2022.
- Therefore, due to the above factors, North America is anticipated to have the largest market share during the forecast period.
Biosolids Market Industry Overview
The biosolids market is partially consolidated in nature. The major players (not in any particular order) include REMONDIS SE & Co. KG, Cambi ASA, FCC Group, Englobe, and Cleanaway, among others.
Additional Benefits:
- The market estimate (ME) sheet in Excel format
- 3 months of analyst support
TABLE OF CONTENTS
1 INTRODUCTION
- 1.1 Study Assumptions
- 1.2 Scope of the Study
2 RESEARCH METHODOLOGY
3 EXECUTIVE SUMMARY
4 MARKET DYNAMICS
- 4.1 Drivers
- 4.1.1 Replacing Hazardous Chemical Fertilizers in North America
- 4.1.2 Stringent Government Emission Laws
- 4.1.3 Other Drivers
- 4.2 Restraints
- 4.2.1 Lack of Proper Knowledge and Awareness on Biosolids
- 4.2.2 Other Restraints
- 4.3 Industry Value Chain Analysis
- 4.4 Porter's Five Forces Analysis
- 4.4.1 Bargaining Power of Suppliers
- 4.4.2 Bargaining Power of Consumers
- 4.4.3 Threat of New Entrants
- 4.4.4 Threat of Substitute Products and Services
- 4.4.5 Degree of Competition
5 MARKET SEGMENTATION (Market Size in Volume)
- 5.1 Type
- 5.1.1 Class A
- 5.1.2 Class A EQ (Exceptional Quality)
- 5.1.3 Class B
- 5.2 Form
- 5.2.1 Cakes
- 5.2.2 Liquid
- 5.2.3 Pellet
- 5.3 Application
- 5.3.1 Agriculture land Application
- 5.3.1.1 Fertilizer/Soil Conditioner for Human Crop Production
- 5.3.1.2 Fertilizer for Animal Crop Production - Pastures
- 5.3.2 Non-agricultural Land Application
- 5.3.2.1 Forest Crops (Land Restoration and Forestry)
- 5.3.2.2 Land Reclamation (Roads and Urban Wetlands)
- 5.3.2.3 Reclaiming Mining Sites
- 5.3.2.4 Landscaping, Recreational Fields, and Domestic Use
- 5.3.3 Energy Recovery Energy Production
- 5.3.3.1 Heat Generation, Incineration, and Gasification
- 5.3.3.2 Oil and Cement Production
- 5.3.3.3 Commercial Uses
- 5.3.1 Agriculture land Application
- 5.4 Geography
- 5.4.1 Asia-Pacific
- 5.4.1.1 China
- 5.4.1.2 India
- 5.4.1.3 Japan
- 5.4.1.4 South Korea
- 5.4.1.5 Malaysia
- 5.4.1.6 Thailand
- 5.4.1.7 Indonesia
- 5.4.1.8 Vietnam
- 5.4.1.9 Rest of Asia-Pacific
- 5.4.2 North America
- 5.4.2.1 United States
- 5.4.2.2 Canada
- 5.4.2.3 Mexico
- 5.4.3 Europe
- 5.4.3.1 Germany
- 5.4.3.2 United Kingdom
- 5.4.3.3 Italy
- 5.4.3.4 France
- 5.4.3.5 Spain
- 5.4.3.6 NORDIC
- 5.4.3.7 Turkey
- 5.4.3.8 Russia
- 5.4.3.9 Rest of Europe
- 5.4.4 South America
- 5.4.4.1 Brazil
- 5.4.4.2 Argentina
- 5.4.4.3 Colombia
- 5.4.4.4 Rest of South America
- 5.4.5 Middle East and Africa
- 5.4.5.1 Saudi Arabia
- 5.4.5.2 South Africa
- 5.4.5.3 Nigeria
- 5.4.5.4 Qatar
- 5.4.5.5 Egypt
- 5.4.5.6 United Arab Emirates
- 5.4.5.7 Rest of Middle East and Africa
- 5.4.1 Asia-Pacific
6 COMPETITIVE LANDSCAPE
- 6.1 Mergers and Acquisitions, Joint Ventures, Collaborations, and Agreements
- 6.2 Market Share Analysis
- 6.3 Strategies Adopted by Leading Players
- 6.4 Company Profiles
- 6.4.1 Agrivert Ltd
- 6.4.2 Aguas Andinas SA
- 6.4.3 Alan Srl
- 6.4.4 Allevi Srl
- 6.4.5 BCR Environmental
- 6.4.6 C.R.E. - Centro di Ricerche Ecologiche
- 6.4.7 Cambi ASA
- 6.4.8 Casella Waste Systems Inc.
- 6.4.9 Cleanaway
- 6.4.10 DC Water
- 6.4.11 Eco-trass
- 6.4.12 Englobe
- 6.4.13 FCC Group
- 6.4.14 Lystek International
- 6.4.15 Merrell Bros. Inc.
- 6.4.16 Parker Ag Services LLC
- 6.4.17 Recyc Systems Inc.
- 6.4.18 REMONDIS SE & Co. KG
- 6.4.19 Saur
- 6.4.20 SYLVIS
- 6.4.21 Synagro Technologies
- 6.4.22 Terrapure BR Ltd
- 6.4.23 Walker Industries
7 MARKET OPPORTUNITIES AND FUTURE TRENDS
- 7.1 Increasing Focus on Sludge Treatment in Asia-Pacific
- 7.2 Other Opportunities

