


 |
市場調查報告書
商品編碼
2124427
液態廢棄物管理:市場佔有率分析、產業趨勢與統計、成長預測(2026-2031 年)Liquid Waste Management - Market Share Analysis, Industry Trends & Statistics, Growth Forecasts (2026 - 2031) |
||||||

※ 本網頁內容可能與最新版本有所差異。詳細情況請與我們聯繫。
根據 Mordor Intelligence 預測,液體廢棄物管理市場規模將從 2025 年的 892.7 億美元成長到 2026 年的 931.5 億美元,到 2031 年將達到 1,152.5 億美元,2026 年至 2031 年的複合年成長率為 4.35%。
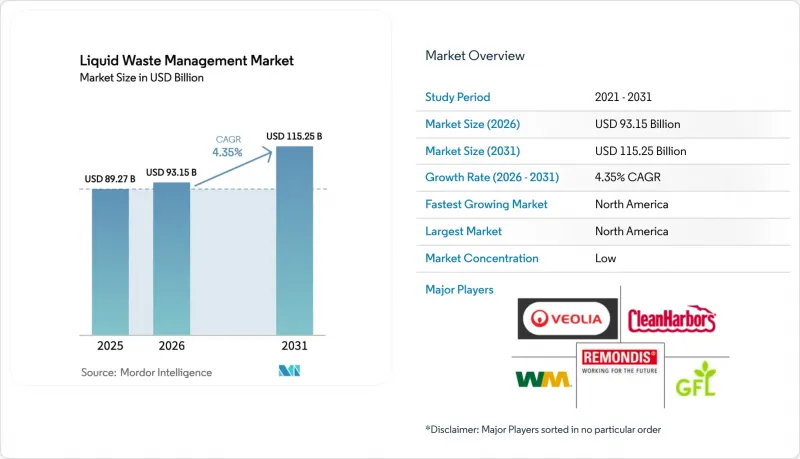
本報告按廢棄物類型(危險廢棄物/非危險廢棄物)、來源(住宅、商業、工業)、服務(收集、運輸/配送、其他)、處理方法(物理處理、化學處理、其他)、最終用戶產業(食品飲料、皮革、其他)和地區(北美、南美、歐洲、其他)進行細分。市場預測以美元計價。
全球液體廢棄物管理市場趨勢及洞察
經合組織和金磚國家在監管主導收緊排放標準
自2024年起實施的廢水排放法規迫使市政當局和工業企業維修一級和二級處理設施,即時需要升級活性碳、臭氧和薄膜處理系統。歐盟將化學設施的總有機碳(TOC)排放限值從50毫克/升降低至20毫克/公升,強制要求引入後處理流程,導致營運成本增加10%。在印度,紡織業的法規將生化需氧量(BOD)限值降低至30毫克/公升,同時引入了色度限制,加速了小規模紡紗廠採用膜生物反應器。在巴西,針對農業工業設施氮磷排放的法規正在推動厭氧消化處理設施的維修。合規寬限期為18至36個月,導致專案集中,並增加了工程公司的短期資本密集度。
半導體、電池和生物製造地的再工業化浪潮
自2024年以來,美國、歐盟和東亞的補貼計畫促成了20多家半導體晶圓廠和12家超級工廠的建立。每家晶圓廠排放的高濃縮液相當於其進水量的1.5至2倍,因此需要現場進行pH值中和以及複雜的離子交換處理。光是台積電(TSMC)位於亞利桑那州的工廠每天就要處理1000萬加侖的氫氟酸洗滌水,這些廢水需經過離子交換和化學沉澱處理後才能排放到公共污水系統中。歐洲電池聯盟預計到2030年電池產能將達到550吉瓦時(GWh),這將遠遠超過現有溶劑焚燒設施的處理能力,導致新建待開發區氧化電池廠的激增。新加坡和愛爾蘭正在興起的生物製造群正在處理化學需氧量 (COD) 超過 50,000 mg/L 的污水,為多級厭氧處理系統創造了高價值的服務機會。
先進氧化和薄膜加工製程需要高額的資本投入和能源消耗。
日處理能力為10,000立方公尺的薄膜生物反應器(MBR)裝置的建造成本為800萬至1,200萬美元,而傳統活性污泥製程的建造成本為300萬至500萬美元,但其電力需求翻倍至約1千瓦時/立方米。預計到2024年,歐洲工業用電價格將飆升至0.18歐元/千瓦時,這將使中型逆滲透(RO)系統的年成本增加20萬至30萬歐元。採用過氧化氫和紫外線的高級氧化處理需要3至5千瓦時/立方公尺的電力,且每公斤過氧化氫的成本為0.50至1美元,導致其總成本比生物處理方法高出40%至60%。
細分市場分析
至2025年,危險液體廢棄物將佔廢棄物處理總量的57.25%,並以5.29%的複合年成長率成長,勢必繼續在液體廢棄物管理市場佔據核心地位。半導體製造廠和生物製藥廠排放的物質含有酸、金屬和溶劑,需要中和、穩定化或深井注入處理。根據《資源保護與回收法》(RCRA),錯誤分類可能導致每天高達7萬美元的罰款。雖然由於經合組織國家的基礎設施建設,非危險廢棄物(都市污水和低濃度工業污水)的處理速度有所放緩,但營養物去除方面的法規正在推動設備分階段升級。
雖然監管較少的處置方法使非危險廢棄物產生者在成本和合規性之間擁有更大的靈活性,但營養物排放上限卻使營運成本每立方公尺增加0.20至0.40美元。相較之下,液體廢棄物管理產業在危險廢棄物處理服務方面獲得了高額利潤,美國的焚燒利用率已超過85%,處置費用超過每噸500美元。儘管面臨複雜的授權挑戰,這些經濟狀況仍促使私募股權投資於新的處理能力建構。
即使到了2025年,住宅污水預計仍將透過現有的市政系統保持在液態廢棄物管理市場43.44%的佔有率。然而,由於住宅回流導致生化需氧量(BOD)負荷顯著超過市政設計標準,工業污水預計將以5.18%的複合年成長率(CAGR)快速成長。目前,市政當局正在嚴格執行預處理措施,強制工廠在將廢水排放到污水系統之前進行均質化、pH調節或油水分離等處理。
印度、中國和美國的工業叢集正在採用承包共享污水處理設施,以分攤資本成本和專業技術,從而促進與私營營運商的現有合約。商業設施(辦公大樓、零售店和飯店)也緊跟著都市化進程,嘗試使用現場水資源再利用。雖然這會使每平方英尺的建設成本增加 15 至 25 美元,但可以減少污水處理量,並抵消部分飲用水費用。
區域分析
預計到2025年,北美將佔全球營收的43.64%,並在2031年之前以4.76%的複合年成長率成長。此成長主要受以下因素驅動:根據《清潔水法》,每日罰款高達37,500美元;每年發生24萬起供水管破裂事故;以及每年需要處理或註入200億桶頁岩氣開採的水。 2024年,清潔水州輪調基金將利用70億美元的低利率貸款,優先用於去除營養物和實現能源中和。加拿大50億加幣的水資源計畫重點關注農村和原住民社區供水不足的問題,而墨西哥的目標是到2030年通過新建500座污水處理廠,實現75%的市政污水處理覆蓋率。
儘管亞太地區市場佔有率落後,但其正受益於積極的工業化進程和政府強制建設集中式污水處理設施的法規。中國計劃在2024年處理97.5%的都市污水,並對違規者處以38億元人民幣的罰款,同時鼓勵服務外包以應對工業負荷的波動。印度已撥款4,500億盧比用於2026年的都市污水處理,而日本和韓國則降低了營養物排放標準,並投資維修至高級氧化處理技術。越南和印尼的工業園區正在發放集中式污水處理許可證,這為國際EPC公司創造了承包工程專案的機會。
歐洲、中東、非洲和南美洲的促進因素各不相同。歐盟修訂後的《都市污水處理指令》現已適用於人口超過1000人的城市,強制要求實現能源中立運作並鼓勵沼氣汽電共生。德國已撥款12億歐元用於去除微量污染物,英國也啟動了價值5億英鎊的營養物減量計畫。海灣合作理事會(GCC)成員國優先考慮污水再利用;沙烏地阿拉伯正在實施超過濾和紫外線處理系統,目標是到2030年實現70%的污水回收利用,而杜拜已將其薄膜生物反應器(MBR)的處理能力提高到1.2億公升/日,用於園林綠化。巴西的衛生計畫要求到2033年收集90%的污水並處理75%,相關項目總投資達7,000億雷亞爾。同時,阿根廷已獲得20億美元的資金,用於興建50座新的厭氧消化廠。
其他好處
- Excel格式的市場預測(ME)表
- 3個月的分析師支持
目錄
第1章:引言
- 研究假設和市場定義
- 調查範圍
第2章:調查方法
第3章執行摘要
第4章 市場狀況
- 市場概覽
- 市場促進因素
- 經合組織和金磚國家在監管主導收緊排放標準
- 半導體、電池和生物製造地的再工業化浪潮
- 醫療和製藥業廢水排放量增加
- 政府對污水處理廠(STP)和廢水處理廠(ETP)的資助
- 透過強制去除 PFAS(「永久性化學物質」)來創造新的收入來源。
- 市場限制因素
- 先進氧化和薄膜加工製程需要高額的資本投入和能源消耗。
- 通用凝聚劑和特殊化學品的價格波動
- 焚燒和深井注入許可證取得方面的瓶頸(美國/歐盟)
- 價值鏈分析
- 波特五力模型
第5章 市場規模與成長預測
- 廢棄物類型
- 危險液體廢棄物
- 無害液體廢棄物
- 來源
- 住宅
- 商業的
- 產業
- 按服務
- 收藏
- 運輸/航運
- 處置/回收
- 透過加工方法
- 物理處理(沉澱、過濾)
- 化學處理(混凝、中和)
- 生物處理(好氧、厭氧)
- 其他方法(熱處理/焚燒、電化學方法)
- 按最終用戶行業分類
- 飲食
- 皮革
- 紡織品
- 紙漿和紙漿
- 發電
- 化工
- 製糖業
- 石油化工及煉油廠
- 金屬提煉,包括煉鋼。
- 其他終端用戶產業(汽車、肉類加工廠、製藥)
- 按地區
- 亞太地區
- 中國
- 印度
- 日本
- 韓國
- 其他亞太國家
- 北美洲
- 美國
- 加拿大
- 墨西哥
- 歐洲
- 德國
- 英國
- 法國
- 義大利
- 北歐國家
- 其他歐洲國家
- 南美洲
- 巴西
- 阿根廷
- 其他南美國家
- 中東和非洲
- 沙烏地阿拉伯
- 阿拉伯聯合大公國
- 土耳其
- 南非
- 埃及
- 其他中東和非洲國家
- 亞太地區
第6章 競爭情勢
- 市場集中度
- 策略趨勢
- 市佔率(%)/排名分析
- 公司簡介
- Befesa
- Bion Environmental Technologies, Inc.
- CLEAN HARBORS, INC.
- Cleanaway
- Cleanaway Daniels
- ENVA
- EnviroServe
- FCC Recycling (UK) Limited
- GFL Environmental Inc.
- Hulsey(Blue Flow 的子公司)
- Ovivo Inc.
- REMONDIS SE & Co. KG
- Republic Services
- Reworld
- Seche Group
- Stericycle Inc.
- Tradebe
- Veolia
- WM Intellectual Property Holding LLC
第7章 市場機會與未來展望
According to Mordor Intelligence, the liquid waste management market size is expected to grow from USD 89.27 billion in 2025 to USD 93.15 billion in 2026 and is forecast to reach USD 115.25 billion by 2031 at 4.35% CAGR over 2026-2031.
This report is Segmented by Waste Type (Hazardous and Non-Hazardous), Source (Residential, Commercial, and Industrial), Service (Collection, Transportation/Hauling, and More), Treatment Method (Physical, Chemical, and More), End-User Industry (Food and Beverage, Leather, and More), and Geography (North America, South America, Europe, and More). Market Forecasts are Provided in Terms of Value (USD).
Global Liquid Waste Management Market Trends and Insights
Regulation-Driven Discharge Limits Tightening Across OECD and BRICS Economies
Effluent rules published since 2024 are forcing both municipal and industrial operators to retrofit primary and secondary stages, driving immediate demand for activated-carbon, ozonation, and membrane upgrades. The European Union lowered total organic carbon discharge limits for chemical facilities from 50 mg/L to 20 mg/L, compelling polishing steps that lift operating expenditure by 10%. India's textile code simultaneously cut biochemical-oxygen-demand caps to 30 mg/L and introduced color limits, accelerating membrane-bioreactor adoption among small mills. Brazil restricted nitrogen and phosphorus releases from agro-industrial plants, pushing anaerobic digestion retrofits. Compliance windows span 18-36 months, concentrating project pipelines and raising near-term capital intensity for engineering firms.
Re-Industrialization Waves in Semiconductors, Battery, and Biomanufacturing Hubs
Subsidy programs in the United States, the European Union, and East Asia have sparked more than 20 semiconductor fabs and a dozen gigafactories since 2024. Each fab sends 1.5-2.0 times its ultrapure-water intake back as high-fluoride concentrate, obliging on-site pH neutralization and complex ion exchange. Taiwan Semiconductor Manufacturing Company's Arizona plant alone treats 10 million gpd of hydrofluoric-acid rinse water using ion exchange and chemical precipitation before municipal discharge. Europe's Battery Alliance projects 550 GWh of cell capacity by 2030, overwhelming existing solvent-incineration assets and triggering greenfield thermal-oxidizer builds. Emerging biomanufacturing clusters in Singapore and Ireland process wastewater with chemical oxygen demand above 50,000 mg/L, creating premium service opportunities for multi-stage anaerobic systems.
High CAPEX and Energy Intensity of Advanced Oxidation and Membrane Trains
Membrane-bioreactor plants cost USD 8-12 million for 10,000 m3/day versus USD 3-5 million for conventional activated sludge, and power demand doubles to about 1 kWh/m3. European industrial power prices jumped to EUR 0.18/kWh in 2024, adding EUR 200,000-300,000 in annual costs for mid-size reverse-osmosis systems. Advanced oxidation using peroxide and UV consumes 3-5 kWh/m3 and USD 0.50-1.00/kg peroxide, keeping levelized costs 40-60% above biological methods.
Other drivers and restraints analyzed in the detailed report include:
- Growing Healthcare and Pharmaceutical Wastewater Volumes
- Government Funding for Sewage Treatment Plants and Effluent Treatment Plants
- Volatile Pricing of Commodity Coagulants and Specialty Chemicals
For complete list of drivers and restraints, kindly check the Table Of Contents.
Segment Analysis
Hazardous liquid waste represented 57.25% of the 2025 volume, and its 5.29% CAGR ensures it remains the centerpiece of the liquid waste management market. Installations at semiconductor fabs and biopharma plants discharge acids, metals, and solvents that require neutralization, stabilization, or deep-well injection, while misclassification risks fines up to USD 70,000/day under RCRA. Non-hazardous streams-municipal sewage and low-strength industrial effluent-expand more slowly because OECD networks are mature, but nutrient-removal rules drive incremental upgrades.
Less regulated disposal options give non-hazardous generators latitude to balance cost and compliance; however, nutrient caps have lifted operating costs by USD 0.20-0.40/m3. In contrast, the liquid waste management industry earns premium margins in hazardous services, where U.S. incineration utilization already exceeds 85% and disposal fees surpass USD 500/ton. These economics are spurring private equity to fund new capacity, albeit against complex permitting headwinds.
Residential wastewater retained a 43.44% share of the liquid waste management market size in 2025 through entrenched municipal systems, but industrial flows will outpace at 5.18% CAGR as reshoring policies push biochemical-oxygen-demand loads far above municipal design envelopes. Municipalities now enforce pretreatment rigorously, compelling factories to add equalization, pH adjustment, or oil-water separation before sewer discharge.
Industrial clusters in India, China, and the United States source turnkey common-effluent facilities to spread capital cost and expertise, fueling recurring contracts for private operators. Commercial premises-offices, retail, hospitality-track urbanization but experiment with on-site greywater recycling, which adds USD 15-25/ft2 in construction cost yet reduces sewer volumes and offsets potable intake fees.
Complete Report Scope:
- By Waste Type
- Hazardous Liquid Waste
- Non-Hazardous Liquid Waste
- By Source
- Residential
- Commercial
- Industrial
- By Service
- Collection
- Transportation / Hauling
- Disposal/ Recyling
- By Treatment Method
- Physical (Sedimentation, Filtration)
- Chemical (Coagulation, Neutralisation)
- Biological (Aerobic, Anaerobic)
- Others (Thermal and Incineration, electrochemical)
- By End-User Industry
- Food and Beverage
- Leather
- Textile
- Paper and Pulp
- Power Generation
- Chemical Industry
- Sugar Industry
- Petrochemical and Refinery
- Metal Refining including Iron and Steel
- Other End-user Industry (automotive, Slaughter house, pharma)
- By Geography
- Asia-Pacific
- China
- India
- Japan
- South Korea
- Rest of Asia-Pacific
- North America
- United States
- Canada
- Mexico
- Europe
- Germany
- United Kingdom
- France
- Italy
- NORDIC Countries
- Rest of Europe
- South America
- Brazil
- Argentina
- Rest of South America
- Middle East and Africa
- Saudi Arabia
- United Arab Emirates
- Turkey
- South Africa
- Egypt
- Rest of Middle East and Africa
- Asia-Pacific
Geography Analysis
North America generated 43.64% of 2025 revenue and is projected to grow at a 4.76% CAGR through 2031, anchored by Clean Water Act penalties of USD 37,500/day, 240,000 annual water-main breaks, and 20 billion barrels/year of shale-produced water requiring treatment or injection. The 2024 Clean Water State Revolving Fund leveraged USD 7 billion in low-interest loans, prioritizing nutrient removal and energy neutrality. Canada's CAD 5 billion water program emphasizes underserved rural and Indigenous systems, while Mexico targets 75% municipal treatment coverage by 2030 via 500 new plants.
Asia-Pacific trails in share yet benefits from aggressive industrialization and government mandates for centralized effluent plants. China treated 97.5% of urban wastewater in 2024 but fined violators CNY 3.8 billion, spurring service outsourcing to meet variable industrial loads. India budgeted INR 450 billion for urban sewage through 2026, while Japan and South Korea lowered nutrient limits and funded advanced oxidation retrofits. Industrial parks in Vietnam and Indonesia issue clustered discharge permits, creating turnkey opportunities for international EPCs.
Europe, Middle East and Africa, and South America exhibit divergent drivers. The EU's revised Urban Wastewater Treatment Directive now covers towns above 1,000 PE and mandates energy-neutral operation, incentivizing biogas cogeneration. Germany allocated EUR 1.2 billion for micropollutant removal, and the UK launched a GBP 500 million nutrient-reduction drive. Gulf Cooperation Council members prioritize reuse; Saudi Arabia targets 70% wastewater recycling by 2030, commissioning ultrafiltration-UV trains, while Dubai added 120 MIGD of membrane-bioreactor capacity for landscaping reuse. Brazil's sanitation plan mandates 90% sewage collection and 75% treatment by 2033, worth BRL 700 billion in projects, whereas Argentina secured USD 2 billion to add 50 anaerobic-digester plants.
- Befesa
- Bion Environmental Technologies, Inc.
- CLEAN HARBORS, INC.
- Cleanaway
- Cleanaway Daniels
- ENVA
- EnviroServe
- FCC Recycling (UK) Limited
- GFL Environmental Inc.
- Hulsey (a Blue Flow Company)
- Ovivo Inc.
- REMONDIS SE & Co. KG
- Republic Services
- Reworld
- Seche Group
- Stericycle Inc.
- Tradebe
- Veolia
- WM Intellectual Property Holding LLC
Additional Benefits:
- The market estimate (ME) sheet in Excel format
- 3 months of analyst support
TABLE OF CONTENTS
1 Introduction
- 1.1 Study Assumptions and Market Definition
- 1.2 Scope of the Study
2 Research Methodology
3 Executive Summary
4 Market Landscape
- 4.1 Market Overview
- 4.2 Market Drivers
- 4.2.1 Regulation-driven discharge limits tightening across OECD and BRICS economies
- 4.2.2 Re-industrialisation waves in semiconductors, battery and biomanufacturing hubs
- 4.2.3 Growing healthcare and pharmaceutical wastewater volumes
- 4.2.4 Government funding for sewage treatment plants (STPs) and effluent treatment plants (ETPs)
- 4.2.5 PFAS "forever-chemicals" removal mandates creating new revenue pools
- 4.3 Market Restraints
- 4.3.1 High CAPEX and energy intensity of advanced oxidation and membrane trains
- 4.3.2 Volatile pricing of commodity coagulants and specialty chemicals
- 4.3.3 Incineration and deep-well injection permitting bottlenecks (US/EU)
- 4.4 Value Chain Analysis
- 4.5 Porter's Five Forces
- 4.5.1 Bargaining Power of Suppliers
- 4.5.2 Bargaining Power of Buyers
- 4.5.3 Threat of New Entrants
- 4.5.4 Threat of Substitutes
- 4.5.5 Degree of Competition
5 Market Size and Growth Forecasts (Value)
- 5.1 By Waste Type
- 5.1.1 Hazardous Liquid Waste
- 5.1.2 Non-Hazardous Liquid Waste
- 5.2 By Source
- 5.2.1 Residential
- 5.2.2 Commercial
- 5.2.3 Industrial
- 5.3 By Service
- 5.3.1 Collection
- 5.3.2 Transportation / Hauling
- 5.3.3 Disposal/ Recyling
- 5.4 By Treatment Method
- 5.4.1 Physical (Sedimentation, Filtration)
- 5.4.2 Chemical (Coagulation, Neutralisation)
- 5.4.3 Biological (Aerobic, Anaerobic)
- 5.4.4 Others (Thermal and Incineration, electrochemical)
- 5.5 By End-User Industry
- 5.5.1 Food and Beverage
- 5.5.2 Leather
- 5.5.3 Textile
- 5.5.4 Paper and Pulp
- 5.5.5 Power Generation
- 5.5.6 Chemical Industry
- 5.5.7 Sugar Industry
- 5.5.8 Petrochemical and Refinery
- 5.5.9 Metal Refining including Iron and Steel
- 5.5.10 Other End-user Industry (automotive, Slaughter house, pharma)
- 5.6 By Geography
- 5.6.1 Asia-Pacific
- 5.6.1.1 China
- 5.6.1.2 India
- 5.6.1.3 Japan
- 5.6.1.4 South Korea
- 5.6.1.5 Rest of Asia-Pacific
- 5.6.2 North America
- 5.6.2.1 United States
- 5.6.2.2 Canada
- 5.6.2.3 Mexico
- 5.6.3 Europe
- 5.6.3.1 Germany
- 5.6.3.2 United Kingdom
- 5.6.3.3 France
- 5.6.3.4 Italy
- 5.6.3.5 NORDIC Countries
- 5.6.3.6 Rest of Europe
- 5.6.4 South America
- 5.6.4.1 Brazil
- 5.6.4.2 Argentina
- 5.6.4.3 Rest of South America
- 5.6.5 Middle East and Africa
- 5.6.5.1 Saudi Arabia
- 5.6.5.2 United Arab Emirates
- 5.6.5.3 Turkey
- 5.6.5.4 South Africa
- 5.6.5.5 Egypt
- 5.6.5.6 Rest of Middle East and Africa
- 5.6.1 Asia-Pacific
6 Competitive Landscape
- 6.1 Market Concentration
- 6.2 Strategic Moves
- 6.3 Market Share (%)/ RankingAnalysis
- 6.4 Company Profiles (includes Global level Overview, Market level overview, Core Segments, Financials as available, Strategic Information, Products and Services, and Recent Developments)
- 6.4.1 Befesa
- 6.4.2 Bion Environmental Technologies, Inc.
- 6.4.3 CLEAN HARBORS, INC.
- 6.4.4 Cleanaway
- 6.4.5 Cleanaway Daniels
- 6.4.6 ENVA
- 6.4.7 EnviroServe
- 6.4.8 FCC Recycling (UK) Limited
- 6.4.9 GFL Environmental Inc.
- 6.4.10 Hulsey (a Blue Flow Company)
- 6.4.11 Ovivo Inc.
- 6.4.12 REMONDIS SE & Co. KG
- 6.4.13 Republic Services
- 6.4.14 Reworld
- 6.4.15 Seche Group
- 6.4.16 Stericycle Inc.
- 6.4.17 Tradebe
- 6.4.18 Veolia
- 6.4.19 WM Intellectual Property Holding LLC
7 Market Opportunities and Future Outlook
- 7.1 White-space and Unmet-need Assessment
- 7.2 Increasing Focus on Treating Emerging Contaminates

 2026-2030年全球液體廢棄物管理市場
 半導體廢水處理市場:依處理類型、設備類型、處理能力、材質成分、技術、應用、最終用戶和銷售模式分類-2026-2030年全球預測全球液態廢棄物收集和運輸服務市場(按服務類型、服務模式、服務提供者、應用和最終用戶產業分類)預測(2026-2032年)
 半導體廢棄物管理市場分析及至2035年的預測:依類型、產品、服務、技術、組件、應用、材料類型、過程、最終用戶及設備分類半導體廢氣回收解決方案市場分析及預測(至2035年):依類型、產品類型、服務、技術、組件、應用、材料類型、製程、最終用戶、設備分類半導體廢熱回收系統市場分析及預測(至2035年):類型、產品類型、技術、組件、應用、材料類型、製程、最終用戶、功能、安裝類型液態廢棄物管理市場分析及預測(至2035年):依類型、產品、服務、技術、應用、組件、製程、最終用戶、安裝類型、設備分類零廢棄半導體製造市場分析及預測(至2035年):依類型、產品類型、服務、技術、組件、應用、製程、最終用戶、設備及解決方案分類
 全球液體廢棄物管理市場規模、佔有率、趨勢和成長分析報告(2026-2034年)
 液體廢棄物管理市場規模、佔有率和成長分析(按來源、服務、產業和地區分類)-2026-2033年產業預測