


 |
市場調查報告書
商品編碼
2121659
奈米物聯網(IoNT):市場佔有率分析、產業趨勢與統計數據、成長預測(2026-2031)Internet Of Nano Things - Market Share Analysis, Industry Trends & Statistics, Growth Forecasts (2026 - 2031) |
||||||

※ 本網頁內容可能與最新版本有所差異。詳細情況請與我們聯繫。
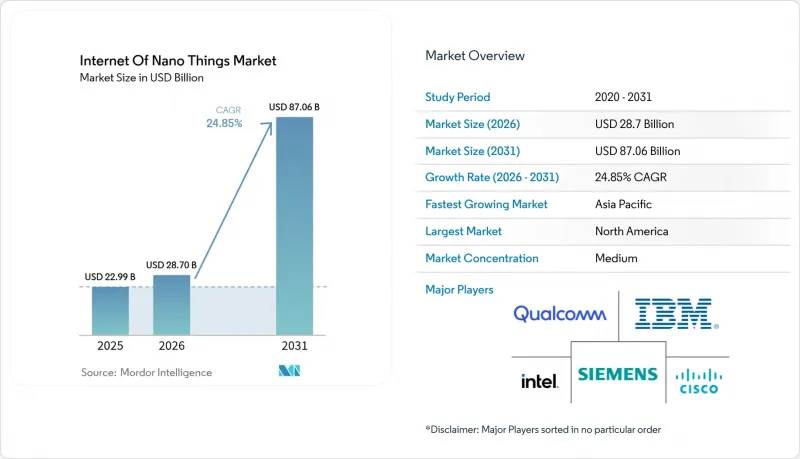
據 Mordor Intelligence 稱,奈米物聯網 (IoNT) 市場規模預計在 2026 年達到 287 億美元,高於 2025 年的 229.9 億美元,預計到 2031 年將達到 870.6 億美元。
預計 2026 年至 2031 年的複合年成長率為 24.85%。
本報告按組件(硬體、軟體、服務)、最終用戶(醫療保健、物流與運輸、國防與航太、製造業及其他)、通訊技術(電磁通訊、分子通訊、奈米RFID/NFC及其他)、部署模式(本地部署、雲端部署、混合部署)和地區進行細分。市場預測以美元計價。
全球奈米物聯網(IoNT)市場趨勢與洞察
奈米技術的快速發展使得實現超低功耗感測器成為可能。
目前,基於奈米碳管的裝置能夠回收環境能量,克服了傳統電池的局限性,並顯著縮短了維護週期。麻省理工學院的工程師成功展示了一種植物驅動的奈米感測器,該感測器透過光合作用產生自身能量,證明了其在遠端部署中的能源自給自足能力。氮化硼奈米管纖維構成了耐熱網路,能夠在嚴苛的工業環境中保持劣化。結合人工智慧驅動的材料發現技術(例如Materials Nexus公司突破性地開發出不含稀土元素的永久磁鐵),創新週期已從數年縮短至數月。這些進步催生了從精密農業到危險環境監測等廣泛的應用,推動了奈米物聯網(IoNT)市場的長期成長。
對用於即時健康監測的穿戴式設備的需求日益成長
Nanowear公司配備奈米感測器的心臟貼片獲得FDA批准,證明了利用奈米技術的醫療設備的監管有效性。奈米碳管薄膜的連續血糖監測儀,在保持隱蔽的皮膚貼片外形的同時,實現了檢查室級的精度。此多功能分析貼片可同時監測電解質、乳酸和皮質醇水平,支持預防性醫療保健模式,進而降低慢性病的醫療成本。採用該設備的醫院報告稱,其能夠早期發現敗血症並縮短ICU住院時間,這證實了醫療產業對奈米物聯網(IoNT)市場擴張的重大貢獻。預計到2024年,該領域市佔率將達到30.3%,顯示強勁的需求將對其他垂直市場構成挑戰。
奈米尺度下嚴重的資料安全與隱私風險
奈米感測器缺乏傳統加密所需的運算能力,這使其攻擊面更加脆弱,可能危及醫院、工廠或市政網路的安全。醫療奈米感測器尤其容易受到攻擊;例如,如果血糖值監測儀遭到入侵,測量數據可能被篡改,從而危及患者安全。 《一般資料保護規則》(GDPR) 將奈米感測器數據視為高風險數據,並強制要求獲得明確同意,但這在亞毫米級自主設備中難以實現。輕量級、抗量子攻擊的加密技術仍處於概念驗證(PoC) 階段,這進一步擴大了安全漏洞,並導致奈米物聯網 (IoNT) 市場的預期複合年成長率下降 4.3%。
細分市場分析
到2025年,硬體將佔總營收的46.90%,其關鍵的實體設備、天線和閘道將推動奈米物聯網(IoNT)市場的發展。然而,隨著分析平台利用大量的分子數據,軟體領域正以28.12%的複合年成長率快速成長。服務領域仍在發展中,但隨著企業需要諮詢專業知識將奈米設備整合到舊有系統中,該領域也實現了兩位數的成長。陶氏化學與Carvix在導熱介面材料方面的合作就是一個很好的例子,它展現了專業知識如何轉化為高利潤的服務線。
軟體的快速成長正在重新定義價值創造的方式。隨著商品化進程的推進,硬體利潤率不斷下降,而管理數十億個終端的編配堆疊卻收取著高昂的授權費。雲端供應商正在整合奈米設備API,吸引開發者使用整合了安全性、人工智慧和生命週期管理的平台。在預測期內,與軟體收入密切相關的奈米物聯網(IoNT)市場規模預計將縮小與硬體市場的差距,從而重塑整個生態系統的競爭格局。
到2025年,醫療保健產業將佔奈米感測器收入的29.90%,仍將是最大的應用領域,奈米感測器將被用於持續生命徵象監測、植入監測和智慧藥物傳輸。同時,智慧城市預計將以27.05%的複合年成長率成長至2031年,市政當局將部署奈米感測器網路用於空氣品質分析、洩漏檢測和智慧交通控制。在製造業,整合到生產線中的奈米感測器可為預測性維護系統提供即時分子數據;物流公司則在貨櫃內安裝奈米感測器,以監測冷鏈的合規性。
環保機構正在使用奈米感測器浮標來檢測污染物,其精度可達十億分之一(ppb)級別,這是傳統感測器無法企及的。農業相關企業正在向植物組織噴灑奈米感測器,以便及早預警營養缺乏,從而減少化肥用量和水資源浪費。這些例子表明,垂直多元化正在加速奈米物聯網(IoNT)市場向整體實體經濟的滲透。
區域分析
預計到2025年,北美將維持38.10%的銷售額佔有率,這得益於聯邦津貼、兆赫頻寬的早期分配以及具備奈米級生產能力的成熟半導體製造工廠。美國國家標準與技術研究院(NIST)物聯網諮詢委員會正在為標準制定提供明確的指南,並推動商業試點計畫的加速。然而,高昂的人事費用和資本支出正對利潤率構成壓力,而確保奈米製造工程師的人才儲備也是一項挑戰。美國正專注於國防、航太和先進醫療植入領域,而加拿大則將資源投入環境監測,以便更好地管理自然資源。
預計到2031年,亞太地區的複合年成長率將達到27.62%。這反映了該地區對工業4.0的大力支持、強大的電子供應鏈以及5G的廣泛部署。中國在製造業領域引領奈米技術的應用,將奈米感測器整合到晶圓廠和化工廠中,以提高產量和安全性。同時,日本醫療技術公司在生物相容性植入的研發方面處於領先地位。韓國正利用其在通訊領域的領先地位,試辦建設支持6G的奈米網狀網路。各地區政府都在為奈米技術研發提供津貼,縮短產品上市時間,並加劇市場競爭。由此產生的規模經濟預計將在本十年末縮小亞太地區與北美地區在奈米物聯網(IoNT)市場規模上的差距。
歐洲持續發揮影響力,主導全球資料隱私和永續性框架規範的發展。 「地平線歐洲」計畫已撥款1億歐元用於邊緣人工智慧和物聯網研究,部分資金將用於奈米裝置互通性研究。德國正在精密製造業部署奈米感測器,英國則在測試基於石墨烯的健康貼片。南美、中東和非洲等新興地區正選擇性地投資於環境和基礎設施監測,利用奈米感測器的功能提供高解析度數據,同時降低生命週期成本。
其他好處:
- Excel格式的市場預測(ME)表
- 3個月的分析師支持
目錄
第1章:引言
- 本研究的假設與市場定義
- 調查範圍
第2章:調查方法
第3章執行摘要
第4章 市場狀況
- 市場概覽
- 市場促進因素
- 奈米技術的快速發展使得超低功耗感測器成為可能。
- 對用於即時健康監測的穿戴式設備的需求日益成長
- 擴大工業4.0和智慧製造的應用
- 5G/6G 和邊緣運算基礎設施的普及
- 兆赫天線的新技術進步降低了訊號衰減。
- 政府資助的利用奈米感測器的疫情監測網路
- 市場限制因素
- 奈米尺度下嚴重的資料安全與隱私風險
- 高昂的資本成本和奈米製造的複雜性
- 人體植入物生物相容性和長期細胞毒性方面的擔憂
- 兆赫頻段缺乏標準化的頻率規定,導致實施工作延誤。
- 產業價值鏈分析
- 監理情勢
- 技術展望
- 產業吸引力—五力分析
- 供應商的議價能力
- 買方的議價能力
- 新進入者的威脅
- 替代品的威脅
- 競爭公司之間的競爭
- 宏觀經濟因素對市場的影響
第5章 市場規模與成長預測
- 按組件
- 硬體
- 軟體
- 服務
- 最終用戶
- 衛生保健
- 物流/運輸
- 國防/航太
- 製造業
- 能源與電力
- 環境監測
- 零售
- 農業
- 智慧城市和基礎設施
- 其他最終用戶
- 透過通訊技術
- 電磁學
- 分子通訊
- Nano RFID/NFC
- 奈米感測器網路
- 奈米衛星通訊
- 其他
- 按部署模式
- 現場
- 雲
- 混合
- 按地區
- 北美洲
- 美國
- 加拿大
- 墨西哥
- 南美洲
- 巴西
- 阿根廷
- 智利
- 其他南美國家
- 歐洲
- 德國
- 英國
- 法國
- 義大利
- 西班牙
- 俄羅斯
- 其他歐洲國家
- 亞太地區
- 中國
- 印度
- 日本
- 韓國
- 新加坡
- 馬來西亞
- 澳洲
- 其他亞太國家
- 中東和非洲
- 中東
- 阿拉伯聯合大公國
- 沙烏地阿拉伯
- 土耳其
- 其他中東國家
- 非洲
- 南非
- 奈及利亞
- 埃及
- 其他非洲國家
- 中東
- 北美洲
第6章 競爭情勢
- 市場集中度
- 策略趨勢
- 市佔率分析
- 公司簡介
- IBM Corporation
- Intel Corporation
- Cisco Systems, Inc.
- Qualcomm Technologies, Inc.
- Siemens AG
- Schneider Electric SE
- SAP SE
- Juniper Networks, Inc.
- Nokia Corporation
- Honeywell International Inc.
- Analog Devices, Inc.
- STMicroelectronics NV
- Nanoscale Components, Inc.
- NanoSensors, Inc.
- Agilent Technologies, Inc.
- TeraSense Group, Inc.
- Graphenea, Inc.
- Litmus Automation, Inc.
- ON Semiconductor Corporation
- Microchip Technology Inc.
- Camtek Ltd.
- NeuraLace Medical, Inc.
- Nanolike SAS
- Ambiq Micro, Inc.
- Synapse Wireless, Inc.
第7章 投資分析
第8章 市場機會與未來趨勢
- 評估閒置頻段和未滿足的需求
According to Mordor Intelligence, the internet of Nano Things Market size in 2026 is estimated at USD 28.7 billion, growing from 2025 value of USD 22.99 billion with 2031 projections showing USD 87.06 billion, growing at 24.85% CAGR over 2026-2031.
This report is Segmented by Component (Hardware, Software, and Services), End-User (Healthcare, Logistics and Transportation, Defense and Aerospace, Manufacturing, and More), Communication Technology (Electromagnetic, Molecular Communication, Nano RFID/NFC, and More), Deployment Model (On-Premise, Cloud, and Hybrid), and Geography. The Market Forecasts are Provided in Terms of Value (USD).
Global Internet Of Nano Things Market Trends and Insights
Rapid Advancements in Nanotechnology Enabling Ultra-Low Power Sensors
Carbon-nanotube-based devices now harvest ambient energy, removing conventional battery constraints and slashing maintenance cycles. MIT engineers demonstrated plant-powered nanosensors that self-energize through photosynthesis, validating energy autonomy for remote deployments. Boron nitride nanotube fibres provide heat-tolerant networks that withstand harsh industrial settings without degradation. Coupled with AI-accelerated materials discovery, exemplified by Materials Nexus' rare-earth-free permanent magnet breakthrough, innovation cycles have shrunk from years to months. These advances unlock applications ranging from precision agriculture to hazardous-environment monitoring, underpinning the long-term growth of the Internet of Nano Things market.
Growing Demand for Real-Time Health Monitoring Wearables
FDA clearance of Nanowear's nanosensor cardiac patch underscores regulatory validation for nano-enabled medical devices. Continuous glucose monitors built on carbon-nanotube films now rival laboratory accuracy while retaining discreet, skin-patch form factors. Multi-analyte patches track electrolytes, lactate, and cortisol simultaneously, supporting preventive care models that lower chronic-disease costs. Hospitals integrating these devices report earlier sepsis detection and shorter ICU stays, reinforcing healthcare's contribution to the Internet of Nano Things market expansion. The sector's 30.3% revenue share in 2024 signals entrenched demand that other verticals must challenge.
Severe Data Security and Privacy Risks at Nanoscale
Nanosensors lack the compute headroom for traditional encryption, exposing attack surfaces that could compromise hospital, factory, or municipal networks. Implantable medical nanosensors are especially vulnerable; a hijacked glucose monitor can falsify readings, endangering patients. GDPR treats nanosensor data as high-risk, mandating explicit consent that is difficult to implement on autonomous sub-millimetre devices. Quantum-resistant lightweight ciphers remain at proof-of-concept stages, widening the security gap and exerting a negative 4.3% pull on forecast CAGR for the Internet of Nano Things market.
Other drivers and restraints analyzed in the detailed report include:
- Increasing Adoption of Industry 4.0 and Smart Manufacturing
- Proliferation of 5G/6G and Edge Computing Infrastructure
- High Capital Costs and Complexity of Nano-Fabrication
For complete list of drivers and restraints, kindly check the Table Of Contents.
Segment Analysis
Hardware generated 46.90% of 2025 revenue, anchoring the Internet of Nano Things market in essential physical devices, antennas, and gateways. Yet the software segment is racing ahead at a 28.12% CAGR as analytics platforms capitalise on torrents of molecular data. Services remain nascent but record double-digit growth because enterprises require consulting expertise to integrate nano-devices with legacy systems. Dow's collaboration with Carbice on thermal interface materials shows how specialised know-how is turning into high-margin service lines.
The software boom is redefining value capture: hardware margins compress as commoditisation sets in, while orchestration stacks that manage billions of endpoints command premium licences. Cloud vendors embed nano-device APIs, drawing developers into unified platforms that bundle security, AI, and lifecycle management. Over the forecast horizon, the Internet of Nano Things market size linked to software revenues is projected to narrow the gap on hardware, recalibrating competitive strategies across the ecosystem.
Healthcare contributed 29.90% of 2025 revenue and remains the largest adopter, leveraging nanosensors for continuous vitals monitoring, implant surveillance, and smart drug delivery. Smart-city programmes, however, will expand at 27.05% CAGR to 2031 as municipalities deploy nanosensor meshes for air-quality analytics, water-leak detection, and intelligent traffic control. In manufacturing, nanosensors embedded on production lines feed real-time molecular data into predictive-maintenance engines, while logistics firms fit nanosensors inside containers to verify cold-chain compliance.
Environmental agencies adopt nanosensor buoys that detect pollutants at parts-per-billion resolution, a capability classical sensors lack. Agriculture outfits scatter plant-tissue nanosensors that signal nutrient deficits early, cutting fertiliser usage and water waste. These deployments illustrate how vertical diversification is accelerating overall Internet of Nano Things market penetration across the real economy.
Complete Report Scope:
- By Component
- Hardware
- Software
- Services
- By End-user
- Healthcare
- Logistics and Transportation
- Defense and Aerospace
- Manufacturing
- Energy and Power
- Environmental Monitoring
- Retail
- Agriculture
- Smart Cities and Infrastructure
- Other End-users
- By Communication Technology
- Electromagnetic
- Molecular Communication
- Nano RFID/NFC
- Nano Sensor Networks
- Nano Satellite Communication
- Others
- By Deployment Model
- On-Premise
- Cloud
- Hybrid
- By Geography
- North America
- United States
- Canada
- Mexico
- South America
- Brazil
- Argentina
- Chile
- Rest of South America
- Europe
- Germany
- United Kingdom
- France
- Italy
- Spain
- Russia
- Rest of Europe
- Asia-Pacific
- China
- India
- Japan
- South Korea
- Singapore
- Malaysia
- Australia
- Rest of Asia-Pacific
- Middle East and Africa
- Middle East
- United Arab Emirates
- Saudi Arabia
- Turkey
- Rest of Middle East
- Africa
- South Africa
- Nigeria
- Egypt
- Rest of Africa
- Middle East
- North America
Geography Analysis
North America retained 38.10% revenue share in 2025, buoyed by federal grants, early terahertz spectrum allocation, and entrenched semiconductor fabs capable of nano-class production. The NIST IoT Advisory Board provides clarity around standards, accelerating commercial pilots. However, high labour costs and capital outlays squeeze margins, and the talent pipeline struggles to supply nano-manufacturing technicians. The United States focuses on defence, aerospace, and advanced healthcare implants, while Canada channels resources into environmental monitoring for natural-resource stewardship.
Asia-Pacific will post a 27.62% CAGR to 2031, reflecting aggressive Industry 4.0 incentives, deep electronics supply chains, and expansive 5G footprints. China drives manufacturing uptake, embedding nanosensors inside fabs and chemical plants to boost yield and safety, while Japan's med-tech firms pioneer bio-compatible nano implants. South Korea exploits telecom leadership to pilot 6G-ready nano-mesh networks. Regional governments subsidise nano R&D, compressing time-to-market and intensifying competition. The resulting scale advantages will narrow the Internet of Nano Things market size gap between Asia-Pacific and North America by decade end.
Europe remains influential, championing data privacy and sustainability frameworks that shape global norms. Horizon Europe has earmarked EUR 100 million for edge-AI and IoT research, with part allocated to nano-device interoperability. Germany deploys nanosensors in precision manufacturing, and the United Kingdom tests graphene-based health patches. Emerging regions in South America and the Middle East, and Africa invest selectively in environmental and infrastructure monitoring, capitalising on nanosensors' ability to deliver high granularity at lower lifecycle costs.
- IBM Corporation
- Intel Corporation
- Cisco Systems, Inc.
- Qualcomm Technologies, Inc.
- Siemens AG
- Schneider Electric SE
- SAP SE
- Juniper Networks, Inc.
- Nokia Corporation
- Honeywell International Inc.
- Analog Devices, Inc.
- STMicroelectronics N.V.
- Nanoscale Components, Inc.
- NanoSensors, Inc.
- Agilent Technologies, Inc.
- TeraSense Group, Inc.
- Graphenea, Inc.
- Litmus Automation, Inc.
- ON Semiconductor Corporation
- Microchip Technology Inc.
- Camtek Ltd.
- NeuraLace Medical, Inc.
- Nanolike SAS
- Ambiq Micro, Inc.
- Synapse Wireless, Inc.
Additional Benefits:
- The market estimate (ME) sheet in Excel format
- 3 months of analyst support
TABLE OF CONTENTS
1 INTRODUCTION
- 1.1 Study Assumption and Market Definition
- 1.2 Scope of the Study
2 RESEARCH METHODOLOGY
3 EXECUTIVE SUMMARY
4 MARKET LANDSCAPE
- 4.1 Market Overview
- 4.2 Market Drivers
- 4.2.1 Rapid advancements in nanotechnology enabling ultra-low power sensors
- 4.2.2 Growing demand for real-time health monitoring wearables
- 4.2.3 Increasing adoption of Industry 4.0 and smart manufacturing
- 4.2.4 Proliferation of 5G/6G and edge computing infrastructure
- 4.2.5 Emerging terahertz-band nano-antenna breakthroughs reducing signal attenuation
- 4.2.6 Government-funded pandemic surveillance networks leveraging nanosensors
- 4.3 Market Restraints
- 4.3.1 Severe data security and privacy risks at nanoscale
- 4.3.2 High capital costs and complexity of nano-fabrication
- 4.3.3 Biocompatibility and long-term cytotoxicity concerns in human body deployments
- 4.3.4 Lack of standardized terahertz spectrum regulations causing deployment delays
- 4.4 Industry Value Chain Analysis
- 4.5 Regulatory Landscape
- 4.6 Technological Outlook
- 4.7 Industry Attractiveness - Porter's Five Forces Analysis
- 4.7.1 Bargaining Power of Suppliers
- 4.7.2 Bargaining Power of Buyers
- 4.7.3 Threat of New Entrants
- 4.7.4 Threat of Substitutes
- 4.7.5 Intensity of Competitive Rivalry
- 4.8 Impact of Macroeconomic Factors on the Market
5 MARKET SIZE AND GROWTH FORECASTS (VALUES)
- 5.1 By Component
- 5.1.1 Hardware
- 5.1.2 Software
- 5.1.3 Services
- 5.2 By End-user
- 5.2.1 Healthcare
- 5.2.2 Logistics and Transportation
- 5.2.3 Defense and Aerospace
- 5.2.4 Manufacturing
- 5.2.5 Energy and Power
- 5.2.6 Environmental Monitoring
- 5.2.7 Retail
- 5.2.8 Agriculture
- 5.2.9 Smart Cities and Infrastructure
- 5.2.10 Other End-users
- 5.3 By Communication Technology
- 5.3.1 Electromagnetic
- 5.3.2 Molecular Communication
- 5.3.3 Nano RFID/NFC
- 5.3.4 Nano Sensor Networks
- 5.3.5 Nano Satellite Communication
- 5.3.6 Others
- 5.4 By Deployment Model
- 5.4.1 On-Premise
- 5.4.2 Cloud
- 5.4.3 Hybrid
- 5.5 By Geography
- 5.5.1 North America
- 5.5.1.1 United States
- 5.5.1.2 Canada
- 5.5.1.3 Mexico
- 5.5.2 South America
- 5.5.2.1 Brazil
- 5.5.2.2 Argentina
- 5.5.2.3 Chile
- 5.5.2.4 Rest of South America
- 5.5.3 Europe
- 5.5.3.1 Germany
- 5.5.3.2 United Kingdom
- 5.5.3.3 France
- 5.5.3.4 Italy
- 5.5.3.5 Spain
- 5.5.3.6 Russia
- 5.5.3.7 Rest of Europe
- 5.5.4 Asia-Pacific
- 5.5.4.1 China
- 5.5.4.2 India
- 5.5.4.3 Japan
- 5.5.4.4 South Korea
- 5.5.4.5 Singapore
- 5.5.4.6 Malaysia
- 5.5.4.7 Australia
- 5.5.4.8 Rest of Asia-Pacific
- 5.5.5 Middle East and Africa
- 5.5.5.1 Middle East
- 5.5.5.1.1 United Arab Emirates
- 5.5.5.1.2 Saudi Arabia
- 5.5.5.1.3 Turkey
- 5.5.5.1.4 Rest of Middle East
- 5.5.5.2 Africa
- 5.5.5.2.1 South Africa
- 5.5.5.2.2 Nigeria
- 5.5.5.2.3 Egypt
- 5.5.5.2.4 Rest of Africa
- 5.5.5.1 Middle East
- 5.5.1 North America
6 COMPETITIVE LANDSCAPE
- 6.1 Market Concentration
- 6.2 Strategic Moves
- 6.3 Market Share Analysis
- 6.4 Company Profiles (includes Global level Overview, Market level overview, Core Segments, Financials as available, Strategic Information, Market Rank/Share for key companies, Products and Services, and Recent Developments)
- 6.4.1 IBM Corporation
- 6.4.2 Intel Corporation
- 6.4.3 Cisco Systems, Inc.
- 6.4.4 Qualcomm Technologies, Inc.
- 6.4.5 Siemens AG
- 6.4.6 Schneider Electric SE
- 6.4.7 SAP SE
- 6.4.8 Juniper Networks, Inc.
- 6.4.9 Nokia Corporation
- 6.4.10 Honeywell International Inc.
- 6.4.11 Analog Devices, Inc.
- 6.4.12 STMicroelectronics N.V.
- 6.4.13 Nanoscale Components, Inc.
- 6.4.14 NanoSensors, Inc.
- 6.4.15 Agilent Technologies, Inc.
- 6.4.16 TeraSense Group, Inc.
- 6.4.17 Graphenea, Inc.
- 6.4.18 Litmus Automation, Inc.
- 6.4.19 ON Semiconductor Corporation
- 6.4.20 Microchip Technology Inc.
- 6.4.21 Camtek Ltd.
- 6.4.22 NeuraLace Medical, Inc.
- 6.4.23 Nanolike SAS
- 6.4.24 Ambiq Micro, Inc.
- 6.4.25 Synapse Wireless, Inc.
7 INVESTMENT ANALYSIS
8 MARKET OPPORTUNITIES AND FUTURE TRENDS
- 8.1 White-Space and Unmet-Need Assessment

 奈米物聯網 (IoNT) 市場 – 全球市場預測 2026-2032
 奈米物聯網 (IoNT) 市場規模、佔有率和成長分析:按組件、網路類型、連接技術、應用、最終用戶和地區分類—2026-2033 年產業預測
 奈米物聯網(IoNT)市場:按組件、網路架構、通訊方式、最終用戶、國家和地區分類-全球產業分析、市場規模、市場佔有率及2026年至2033年預測
 奈米物聯網市場:按設備類型、通訊方式、網路架構、最終用戶和地區分類(2026-2034 年)
 2026年全球奈米物聯網(IoNT)市場報告
 奈米物聯網市場-全球產業規模、佔有率、趨勢、機會和預測,按組件、按通訊類型(虛擬實境、擴增實境)、按最終用途、按地區和競爭,2020-2030 年預測
 IoNT(奈米物聯網)市場規模、佔有率、趨勢分析報告:按組件、通訊類型、最終用途、地區、細分市場預測,2025-2030 年