


 |
市場調查報告書
商品編碼
1629796
資料視覺化:市場佔有率分析、產業趨勢、統計、成長預測(2025-2030)Data Visualization - Market Share Analysis, Industry Trends & Statistics, Growth Forecasts (2025 - 2030) |
||||||
※ 本網頁內容可能與最新版本有所差異。詳細情況請與我們聯繫。
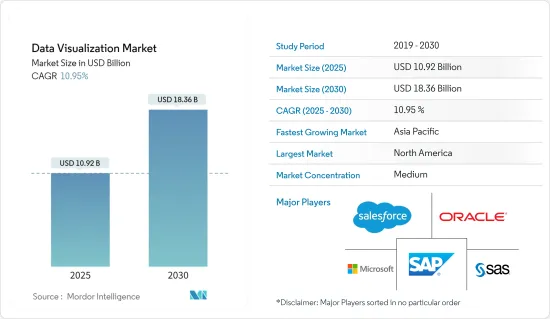
資料視覺化市場規模預計到2025年為109.2億美元,預計到2030年將達到183.6億美元,預測期內(2025-2030年)複合年成長率為10.95%。
資料視覺化的新本質正在推動向分析主導業務的轉變,使用戶能夠探索最初僅在各種格式和圖形表示形式的表格形式報告中提供的資料。
主要亮點
- 在許多行業中,企業正在意識到資料主導決策的好處。從大型複雜的資料庫中提取有用的資訊變得越來越重要。資料視覺化對於揭示複雜資訊並以易於理解和分析的視覺吸引力方式呈現至關重要。隨著公司尋找從資料中提取有價值見解的方法,資料視覺化工具市場將繼續成長。有效地視覺化資料可以幫助決策者發現模式、趨勢和相關性,從而做出更明智的策略決策。
- 術語「擴增實境」是指將數位資料(例如視覺化)疊加到實體環境上的技術。一項有潛力改變市場的新發展是將 AR 納入資料視覺化工具。透過將資料視覺化疊加到現實世界的物件和環境上,AR 可以為消費者提供身臨其境、引人入勝的體驗,使他們能夠以新穎的方式探索和分析資料。該技術可用於多個領域,包括製造、醫療保健和零售,其中地理環境中的即時資料視覺化可以改善決策、培訓和消費者互動。
- 自然語言處理和對話介面的結合是資料視覺化的另一個獨特的市場驅動力。自然語言處理允許電腦理解、翻譯和產生人類語言,允許使用者使用自然語言指令和查詢與資料視覺化工具進行通訊。透過與系統交互,使用者可以提出問題、請求特定的視覺化,並利用 NLP 來探索資料。與傳統的圖形使用者介面相比,它的學習曲線較低,因此有可能使資料視覺化更容易被更廣泛的受眾接受。它還開啟了透過智慧揚聲器和虛擬助理等支援語音的小工具進行資料主導決策的可能性。
- 隨著產生和分析的資料量不斷增加,資料隱私和安全已成為主要問題。由此推斷,組織和個人越來越意識到與資料外洩和未授權存取敏感資訊相關的潛在風險。這種日益增強的意識導致了更嚴格的法規的訂定,例如歐盟 (EU) 的《一般資料保護規範》(GDPR) 和美國的《加州消費者隱私法案》(CCPA)。這些法規對組織收集、儲存和處理個人資料的方式進行了限制。
- COVID-19 帶來了前所未有的挑戰,要求組織專注於危機管理和業務永續營運。資料視覺化在幫助企業監控關鍵指標、識別潛在風險以及製定減輕疫情影響的策略方面發揮了關鍵作用。可見性使公司能夠追蹤供應鏈中斷、分析客戶行為的變化並監控其營運的財務狀況。透過了解這些關鍵見解,組織能夠更有效地應對危機並調整業務以確保業務永續營運。還有俄羅斯和烏克蘭戰爭對整個包裝生態系統的影響。
資料視覺化市場趨勢
零售業將經歷顯著成長
- 資料視覺化使零售商能夠更深入地了解客戶行為、偏好和購買模式。可視化客戶資料使零售商能夠了解趨勢、了解客戶細分並制定個人化行銷策略。資料的可視化表示使零售商能夠做出資料驅動的決策、最佳化庫存管理並提供符合客戶需求的產品。客戶分析的這些改進正在帶來更有針對性的行銷宣傳活動、更好的客戶體驗和銷售額的增加。
- 資料視覺化在增強零售公司的供應鏈管理方面發揮關鍵作用。存量基準、物流和訂單履行等供應鏈資料的可見性使零售商能夠識別瓶頸、最佳化流程並提高整體效率。供應鏈資料的即時可見性使零售商能夠追蹤庫存變動、監控產品可用性並識別潛在的中斷。這可以改善庫存管理、減少缺貨並提高預測準確性。
- 資料視覺化工具可讓零售商即時監控銷售業績。透過互動式儀表板追蹤關鍵績效指標 (KPI),例如銷售收益、轉換率和平均交易價值。銷售資料的即時可見性使零售商能夠了解銷售趨勢,及時調整定價和促銷,並解決出現的問題和機會。這使得零售商能夠在競爭激烈的市場中保持敏捷並提高銷售表現。
- 資料視覺化允許零售商透過了解個人偏好和行為來創建個人化的客戶體驗。透過視覺化客戶資料(例如購買歷史記錄、瀏覽模式和人口統計資訊),零售商可以提供有針對性的建議、個人化優惠和客製化行銷宣傳活動。資料主導的個人化可提高客戶滿意度、忠誠度並鼓勵重複購買。
北美佔最大市場佔有率
- 由於該地區的最終用戶行業擴大採用先進技術,北美成為一個重要的市場。此外,該地區擁有強大的供應商,有助於市場成長。北美的資料視覺化應用受到巨量資料的興起和零售業分析需求等因素的推動。
- 由於中小型企業產生的資料量不斷增加,美國的資料視覺化市場正在經歷健康成長。例如,數位資訊平台上每天都在產生大量資料。據IBM公司稱,每天會產生2.5億位元組的資料。
- 2021 年 7 月,美國海岸警衛隊採用了 COVID-19資料視覺化工具,幫助指揮官做出從疫苗分發到行動準備的明智決策,並採用新技術來改善警衛隱私,並採取預防措施確保安全不受影響。該計劃旨在教授情境察覺和觀點,不應直接影響個人。
- 加拿大市場各領域擴大採用資料主導的決策。雲端業務管理解決方案供應商 Sage 於 2021 年 3 月在美國和加拿大市場推出了針對 Sage 300 和 Sage 100 的首個雲端 Sage 資料和分析服務整合。其商業情報套件可藉助人工智慧和機器學習演算法為使用者提供即時銷售儀表板和詳細的損益表。此類技術創新預計將推動所研究的市場。
- 由於北美是基於技術的解決方案的重要市場,因此越來越需要追蹤不同來源的資料並將其組合成各種資料表示形式以做出關鍵業務決策。
資料視覺化行業概況
資料視覺化市場的競爭是溫和的。該市場中的公司正在透過提供策略解決方案來擴大其市場佔有率和基本客群進行創新。這使您能夠贏得新合約並探索新市場。
- 2023 年 4 月 - Atlassian Marketplace 合作夥伴 Amovos SRO 憑藉其 Custom Charts for Jira 和 Custom Charts for Confluence 應用程式簡化了著名的 Jira 和 Confluence,加入了同意被收購的領先產品組合管理解決方案提供商 Tempo Software。此次收購增強了 Tempo 基於 Atlassian 的產品套件,提供易於使用且可自訂的 Jira資料視覺化功能,使團隊能夠專注於快速完成任務,而無需使用繁瑣的企業彙報工具。
- 2022 年 9 月:微軟和 Grafana Labs 簽訂策略協議,使 Grafana 與 Azure 雲端平台原生相容。 Azure Monitor 和 Azure Data Explorer 只是 Microsoft 新的 Azure 託管 Grafana 服務提供本機連接的兩個雲端服務。 Microsoft Azure Managed Grafana 9.0 版包含更好的警報功能,可提醒 IT 管理員注意潛在的技術困難。此版本還包含區域冗餘和 API 金鑰支援。
其他好處:
- Excel 格式的市場預測 (ME) 表
- 3 個月分析師支持
目錄
第1章簡介
- 研究成果
- 研究場所
- 調查範圍
第2章調查方法
第3章執行摘要
第4章市場動態
- 市場概況
- 產業吸引力-波特五力分析
- 新進入者的威脅
- 買家/消費者的議價能力
- 供應商的議價能力
- 替代品的威脅
- 競爭公司之間敵對關係的強度
- 價值鏈分析
- 市場促進因素與市場約束因素介紹
- 市場促進因素
- 資料視覺化解決方案雲端部署
- 對快速決策的需求不斷增加
- 市場限制因素
- 缺乏技術純熟勞工/技能不足
第5章技術藍圖
第6章 市場細分
- 按組織單位
- 高階主管
- 行銷
- 手術
- 金融
- 銷售部
- 其他組織部門
- 按發展
- 本地
- 雲端/點播
- 按最終用戶
- BFSI
- 資訊科技/通訊
- 零售/電子商務
- 教育
- 製造業
- 政府機構
- 其他最終用戶
- 按地區
- 北美洲
- 歐洲
- 亞太地區
- 拉丁美洲
- 中東/非洲
第7章 競爭格局
- 公司簡介
- Salesforce.com Inc.(Tableau Software Inc.)
- SAP SE
- SAS Institute Inc.
- Microsoft Corporation
- Oracle Corporation
- TIBCO Software Inc.
- IBM Corporation
- Information Builders
- Dundas Data Visualization Inc.
- Pentaho Corporation
- InetSoft Technology Corporation
- MicroStrategy Inc.
第8章投資分析
第9章 市場機會及未來趨勢
The Data Visualization Market size is estimated at USD 10.92 billion in 2025, and is expected to reach USD 18.36 billion by 2030, at a CAGR of 10.95% during the forecast period (2025-2030).
The emerging nature of data visualization encourages a shift toward analytically driven businesses, where users can explore data in various forms of graphical representation, initially only available in tabular reports.
Key Highlights
- Across many industries, businesses are realizing the benefits of data-driven decision-making. Extracting useful information from big, complicated databases is becoming increasingly important. Data visualization is essential for demystifying complex information and presenting it in a visually appealing manner that is simple to comprehend and analyze. As companies look for ways to extract valuable insights from their data, inference implies that the market for data visualization tools will keep growing. Decision-makers may find patterns, trends, and correlations by efficiently visualizing data, which helps them make more well-informed strategic decisions.
- The term "augmented reality" refers to a technology that overlays digital data, such as visualizations, on the physical environment. A new development that has the potential to change the market completely is the incorporation of AR with data visualization tools. AR can give consumers an immersive and engaging experience that enables them to explore and analyze data in novel ways by superimposing data visualizations onto real-world objects or environments. This technology can be used in several fields, including manufacturing, healthcare, and retail, where real-time data visualization in a geographical context can improve judgment, training, and consumer interaction.
- The combination of natural language processing and conversational interfaces is another distinctive market driver for data visualization. NLP enables computers to comprehend, translate, and produce human language, allowing users to communicate with data visualization tools using natural language instructions or queries. Through dialogues with the system, users can ask questions, request certain visualizations, or examine data by utilizing NLP. Due to its lower learning curve than conventional graphical user interfaces, this driver may make data visualization more approachable to a wider audience. Additionally, it creates possibilities for data-driven decision-making via voice-enabled gadgets like smart speakers and virtual assistants.
- Data privacy and security have become major concerns as the volume of data being generated and analyzed continues to increase. Inference suggests that organizations and individuals are becoming more aware of the potential risks associated with data breaches and unauthorized access to sensitive information. This heightened awareness has led to stricter regulations, such as the General Data Protection Regulation (GDPR) in the European Union and the California Consumer Privacy Act (CCPA) in the United States. These regulations impose limitations on how organizations collect, store, and process personal data.
- COVID-19 brought about unprecedented challenges, requiring organizations to focus on crisis management and business continuity. Data visualization played a vital role in helping businesses monitor key metrics, identify potential risks, and develop strategies to mitigate the impact of the pandemic. Visualizations enabled organizations to track supply chain disruptions, analyze customer behavior shifts, and monitor the financial health of their businesses. By visualizing these critical insights, organizations could respond more effectively to the crisis and adapt their operations to ensure business continuity. There has also been an impact of the Russia-Ukraine war on the overall packaging ecosystem.
Data Visualization Market Trends
Retail Segment to Witness Significant Growth
- Data visualization has enabled retailers to gain deeper insights into customer behavior, preferences, and purchasing patterns. By visualizing customer data, retailers can identify trends, understand customer segmentation, and personalize their marketing strategies. Visual representations of data help retailers make data-driven decisions, optimize inventory management, and tailor their product offerings to meet customer demands. This improved customer analytics has resulted in more targeted marketing campaigns, better customer experiences, and increased sales.
- Data visualization plays a crucial role in enhancing supply chain management for retailers. By visualizing supply chain data, including inventory levels, logistics, and order fulfillment, retailers can identify bottlenecks, optimize processes, and improve overall efficiency. Real-time visualization of supply chain data enables retailers to track inventory movement, monitor product availability, and identify potential disruptions. This leads to improved inventory management, reduced stockouts, and better forecasting accuracy.
- With the help of data visualization tools, retailers can monitor sales performance in real time. Through interactive dashboards, they can track key performance indicators (KPIs), such as sales revenue, conversion rates, and average transaction value. Real-time visualization of sales data enables retailers to identify sales trends, make timely adjustments to pricing and promotions, and address issues or opportunities as they arise. This helps retailers stay agile and responsive in a competitive market, improving sales performance.
- Data visualization empowers retailers to create personalized customer experiences by understanding individual preferences and behavior. Retailers can deliver targeted recommendations, personalized offers, and customized marketing campaigns by visualizing customer data, such as purchase history, browsing patterns, and demographic information. Data-driven personalization enhances customer satisfaction, increases loyalty, and drives repeat purchases.
North America to Hold Largest Market Share
- North America is a prominent market owing to the growing adoption of advanced technologies by end-user industries across the region. Moreover, the area has a strong foothold of vendors, contributing to the market's growth. Data visualization applications in North America are driven by factors such as growth in big data and the need for analytics in the retail sector.
- The United States data visualization market is witnessing healthy growth due to the increasing amount of data generated in small- and medium-scale firms. For instance, a massive amount of data is being developed on digital information platforms every day. According to IBM Corporation, 2.5 quintillion bytes of data are generated daily.
- In July 2021, the United States Coast Guard adopted COVID-19 data visualization tools to assist commanders in making informed decisions on everything from vaccine distribution to operational readiness and has taken precautions to guarantee that the new technologies do not compromise guardsmen's privacy and security. The program aims to teach situational awareness and perspective, and it should not directly impact individuals.
- The implementation of data-driven decision-making is also rising in Canadian markets across various sectors. Cloud business management solutions vendor Sage launched its cloud-first Sage Data and Analytics service integration for Sage 300 and Sage 100 in the US and Canadian markets in March 2021. Its business intelligence toolkit can provide users with live sales dashboards and detailed P&L reports with the help of AI and machine learning algorithms. Such innovations are expected to drive the studied market.
- An increasing need to track data from various sources and compile it into different data representations to make critical business decisions can be observed in North America, as this region is a significant market for technology-based solutions.
Data Visualization Industry Overview
The data visualization market is moderately competitive. The players in the market are innovating in providing strategic solutions to increase their market presence and customer base. This enables them to secure new contracts and tap new markets.
- April 2023 - Amovos SRO, an Atlassian Marketplace Partner that simplifies Jira and Confluence with its well-known Custom Charts for Jira and Custom Charts for Confluence apps, had agreed to be acquired by Tempo Software, a leading provider of portfolio management solutions for product development organizations. With Jira data visualizations that are simple to use and customizable thanks to the purchase, Tempo's Atlassian-based product suite will grow, allowing teams to concentrate on finishing tasks swiftly rather than fumbling with cumbersome corporate reporting tools.
- September 2022: To make Grafana natively compatible with the Azure cloud platform, Microsoft and Grafana Labs established a strategic agreement. Azure Monitor and Azure Data Explorer are just two cloud services that Microsoft's new Azure Managed Grafana service offers native connections. Version 9.0 of Microsoft's Azure Managed Grafana includes a better alerting feature to inform IT administrators of potential technical difficulties. Zone redundancy and support for an API key are also included in this edition.
Additional Benefits:
- The market estimate (ME) sheet in Excel format
- 3 months of analyst support
TABLE OF CONTENTS
1 INTRODUCTION
- 1.1 Study Deliverables
- 1.2 Study Assumptions
- 1.3 Scope of the Study
2 RESEARCH METHODOLOGY
3 EXECUTIVE SUMMARY
4 MARKET DYNAMICS
- 4.1 Market Overview
- 4.2 Industry Attractiveness - Porter's Five Forces Analysis
- 4.2.1 Threat of New Entrants
- 4.2.2 Bargaining Power of Buyers/Consumers
- 4.2.3 Bargaining Power of Suppliers
- 4.2.4 Threat of Substitute Products
- 4.2.5 Intensity of Competitive Rivalry
- 4.3 Value Chain Analysis
- 4.4 Introduction to Market Drivers and Restraints
- 4.5 Market Drivers
- 4.5.1 Cloud Deployment of Data Visualization Solutions
- 4.5.2 Increasing Need for Quick Decision Making
- 4.6 Market Restraints
- 4.6.1 Lack of Tech Savvy and Skilled Workforce/Inability
5 TECHNOLOGY ROADMAP
6 MARKET SEGMENTATION
- 6.1 Organizational Department
- 6.1.1 Executive Management
- 6.1.2 Marketing
- 6.1.3 Operations
- 6.1.4 Finance
- 6.1.5 Sales
- 6.1.6 Other Organizational Departments
- 6.2 Deployment Mode
- 6.2.1 On-premise
- 6.2.2 Cloud/On-demand
- 6.3 End User
- 6.3.1 BFSI
- 6.3.2 IT and Telecommunication
- 6.3.3 Retail/E-commerce
- 6.3.4 Education
- 6.3.5 Manufacturing
- 6.3.6 Government
- 6.3.7 Other End Users
- 6.4 Geography
- 6.4.1 North America
- 6.4.2 Europe
- 6.4.3 Asia-Pacific
- 6.4.4 Latin America
- 6.4.5 Middle East and Africa
7 COMPETITIVE LANDSCAPE
- 7.1 Company Profiles
- 7.1.1 Salesforce.com Inc. (Tableau Software Inc.)
- 7.1.2 SAP SE
- 7.1.3 SAS Institute Inc.
- 7.1.4 Microsoft Corporation
- 7.1.5 Oracle Corporation
- 7.1.6 TIBCO Software Inc.
- 7.1.7 IBM Corporation
- 7.1.8 Information Builders
- 7.1.9 Dundas Data Visualization Inc.
- 7.1.10 Pentaho Corporation
- 7.1.11 InetSoft Technology Corporation
- 7.1.12 MicroStrategy Inc.
8 INVESTMENT ANALYSIS
9 MARKET OPPORTUNITIES AND FUTURE TRENDS
 2025年資料全球市場報告
 資料視覺化工具市場規模、佔有率和成長分析(按工具、組織規模、部署模式、業務功能、最終用途產業和地區)- 產業預測 2025-20322025 年資料視覺化工具全球市場報告
 資料視覺化工具市場,全球 2025-2029感測器資料分析市場規模、佔有率、成長分析、按組件、按型號、按分析方法、按服務、按應用、按最終用途、按地區 - 行業預測,2025-2032 年
 人工智慧感測器市場規模、佔有率、趨勢分析報告:按技術、按感測器類型、按應用、按地區、細分市場預測,2025-2030 年
 人工智慧感測器市場:按類型、感測器類型、技術、最終用途分類 - 2025-2030 年全球預測資料視覺化工具市場:按組件、工具、業務功能、組織規模、部署類型和行業分類 - 2025-2030 年全球預測2024-2032 年按組件、組織部門、部署模式、企業規模、最終用戶和區域分類的數據視覺化市場報告數據視覺化工具市場、機會、成長動力、產業趨勢分析與預測,2024-2032