


 |
市場調查報告書
商品編碼
1630309
頁岩氣 -市場佔有率分析、產業趨勢/統計、成長預測(2025-2030)Shale Gas - Market Share Analysis, Industry Trends & Statistics, Growth Forecasts (2025 - 2030) |
||||||
價格
※ 本網頁內容可能與最新版本有所差異。詳細情況請與我們聯繫。
簡介目錄
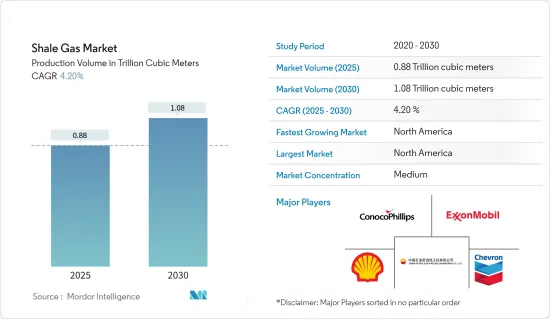
以產量為基礎的頁岩氣市場規模預計將從2025年的8,800億立方公尺擴大到2030年的1.08兆立方米,預測期間(2025-2030年)複合年成長率為4.2%。
主要亮點
- 從中期來看,已探明的頁岩氣蘊藏量以及最近水平鑽井和水力壓裂方面的技術干預等因素預計將長期推動市場。
- 另一方面,石油市場波動和探勘成本高(價格低於頁岩氣生產成本)是市場的兩大限制因素。
- 新頁岩氣蘊藏量的發現預計將為未來市場創造多個機會。
- 由於頁岩氣的大規模生產,預計北美將在預測期內成為最大的市場。預計美國將引領該地區的頁岩氣生產。
頁岩氣市場趨勢
環境擔憂加劇抑制市場
- 鑽井過程中的甲烷氣體排放構成潛在的空氣污染風險。此外,水力壓裂作業中使用的大量化學處理水處理不當可能會導致嚴重的地表水污染。這引起了世界各地環保組織和非政府組織的批評。由於水力壓裂對健康和農業的影響,當地農民和居民一再反對。
- 此外,典型的水力壓裂井在水力壓裂作業期間需要大約200萬至1000萬加侖的水,這給供水帶來了額外的壓力,特別是在乾旱地區。
- 2022年,北美和亞太地區將成為全球二氧化碳排放最高的地區。另一方面,歐洲、中東和非洲的二氧化碳排放最低。 2022年,全球石化燃料和工業二氧化碳排放總合371.5億噸。預計2023年排放將增加1.1%,達到375.5億噸的歷史新高。自1990年以來,全球二氧化碳排放增加了60%以上。
- 近期,在美國西部二疊紀盆地所在地德克薩斯州(預計將引領美國頁岩氣成長),頁岩氣公司因缺水而面臨農民的反對和批評。
- 美國地質調查局(USGS)將美國東部以石油和天然氣開採而聞名的部分地區近期地震增加歸咎於頁岩氣活動。
- 因此,對環境問題的日益擔憂預計將在預測期內抑制市場。
北美市場佔據主導地位
- 美國是世界上最大的頁岩氣生產國。包括巴西、加拿大、中國和阿根廷在內的多個國家都在試圖效法美國的頁岩油繁榮,但沒有成功。然而,儘管中國取得了重大進展,但由於儲存不穩定造成的困難,頁岩氣產量在預測期內可能只會小幅增加。
- 根據美國能源資訊署 (EIA) 的數據,2022 年美國頁岩地層的乾天然氣產量將約為 28.5 兆立方英尺 (Tcf),約占美國乾天然氣當量總產量的 80%。
- 加拿大以其龐大的傳統天然氣蘊藏量而聞名,幾十年來一直是美國的主要天然氣供應國,直到最近的頁岩氣繁榮為止。然而,隨著傳統型天然氣來源的減少,加拿大工業正在轉向傳統型天然氣來源,包括頁岩氣。目前,許多石油天然氣公司正在亞伯達、不列顛哥倫比亞省、魁北克省和新不倫瑞克省探勘和開發頁岩氣資源,頁岩氣產量缺口可能在不久的將來得到平衡。
- 根據能源資訊署(EIA)的預測,該地區在預測期內可能需要更多的天然氣供應,這將推動頁岩氣探勘和生產的投資。
- 因此,由於北美大陸頁岩氣產量壓倒性,預計北美將主導市場。
頁岩氣產業概況
頁岩氣市場是半分割的。該市場的主要企業(排名不分先後)包括切薩皮克能源公司、殼牌公司、埃克森美孚公司、中國石油天然氣有限公司和康菲石油公司。
其他好處
- Excel 格式的市場預測 (ME) 表
- 3 個月分析師支持
目錄
第1章簡介
- 調查範圍
- 市場定義
- 研究場所
第2章調查方法
第3章執行摘要
第4章市場概況
- 介紹
- 2029 年頁岩氣產量與預測
- 最新趨勢和發展
- 政府法規和措施
- 市場動態
- 促進因素
- 已探明頁岩氣蘊藏量
- 水平鑽井和水力壓裂技術進步
- 抑制因素
- 探勘成本高
- 促進因素
- 供應鏈分析
- 波特五力
- 供應商的議價能力
- 消費者議價能力
- 新進入者的威脅
- 替代品的威脅
- 競爭公司之間敵對關係的強度
第5章市場區隔
- 地區
- 北美洲
- 美國
- 加拿大
- 北美其他地區
- 南美洲
- 巴西
- 阿根廷
- 智利
- 哥倫比亞
- 南美洲其他地區
- 亞太地區
- 中國
- 印度
- 日本
- 澳洲
- 馬來西亞
- 泰國
- 印尼
- 越南
- 其他亞太地區
- 歐洲
- 德國
- 法國
- 英國
- 義大利
- 西班牙
- 北歐的
- 土耳其
- 俄羅斯
- 歐洲其他地區
- 中東/非洲
- 阿拉伯聯合大公國
- 沙烏地阿拉伯
- 卡達
- 南非
- 奈及利亞
- 埃及
- 北美洲
第6章 競爭狀況
- 併購、合資、聯盟、協議
- 主要企業策略
- 公司簡介
- Antero Resources Corp.
- Southwestern Energy Company
- EQT Corporation
- Equinor ASA
- Repsol SA
- China Petroleum & Chemical Corporation(SINOPEC)
- Chesapeake Energy Corporation
- Shell PLC
- Exxon Mobil Corporation
- Chevron Corporation
- PetroChina Company Limited
- ConocoPhillips Company
- Pioneer Natural Resources
- Market Player Ranking
第7章 市場機會及未來趨勢
- 發現新的頁岩氣蘊藏量
簡介目錄
Product Code: 67285
The Shale Gas Market size in terms of production volume is expected to grow from 0.88 trillion cubic meters in 2025 to 1.08 trillion cubic meters by 2030, at a CAGR of 4.2% during the forecast period (2025-2030).
Key Highlights
- Over the medium term, factors such as proved shale gas reserves and the recent technological interventions in horizontal drilling and hydraulic fracturing are expected to drive the market in the long term.
- On the other hand, volatility in the oil market with prices below the shale gas production cost and high exploration cost are two critical restraints in the market.
- Nevertheless, the discovery of new shale gas reserves are expected to create several opportunities for the market in the future.
- North America is expected to be the largest market in the forecast period, owing to its large-scale production of shale gas in the region. The United States is expected to lead shale gas production in the area.
Shale Gas Market Trends
Increasing Environmental Concerns to Restrain the Market
- Methane gas emissions during the drilling process pose potential air pollution risks. Additionally, incorrect disposal of large volumes of chemically treated water used in hydraulic fracturing operations can potentially cause severe surface water contamination. This has attracted criticism from environmental protection bodies and NGOs around the world. Due to its impact on health and farming, local farmers and residents have repeatedly opposed hydraulic fracturing.
- Additionally, a typical fracking well requires approximately 2-10 million gallons of water during fracking operations, which puts additional strain on the water supply, particularly in drought-prone regions.
- In 2022, North America and Asia-Pacific recorded the world's highest carbon dioxide emissions. While Europe, the Middle East, and Africa tend to have the lowest emission. The global carbon dioxide emissions from fossil fuels and industry totaled 37.15 billion metric tons in 2022. Emissions are projected to increase by 1.1 percent in 2023 to reach a record high of 37.55 billion metric tons. Since 1990, global CO2 emissions have increased by more than 60 percent.
- Recently in West Texas of the United States, where the Permian Basin (expected to drive the growth of shale gas activities in the United States) is located, shale gas companies faced opposition and criticism from the farmers due to the water shortage.
- The United States Geological Survey (USGS) blamed shale gas activities for the increase in earthquakes in recent times in certain parts of the Central and Eastern United States that are well-known for oil and gas extraction.
- Thus, the increasing environmental concerns are expected to restrain the market during the forecast period.
North America to Dominate the Market
- The United States is the largest producer of shale gas in the world. Different countries, such as Brazil, Canada, China, and Argentina, have tried to emulate the American shale boom but have not been able to succeed. However, large progress has been made in China, but due to the difficulties posed by the unstable reservoirs, shale gas production may only rise slightly in the forecast period.
- According to U.S. Energy Information Administration (EIA) in 2022, U.S. dry natural gas production from shale formations was about 28.5 trillion cubic feet (Tcf) and equal to about 80% of total U.S. dry natural gas production in 2022.Shale gas production may increase further due to new wells being drilled across the country.
- While Canada is known to have significant conventional gas reserves, and the country was a key supplier of natural gas to the United States for decades until the recent shale boom in the country. However, with conventional natural gas sources in decline, Canada's industry is turning to unconventional sources, including shale gas. Many oil and gas companies are now exploring and developing shale gas resources in Alberta, British Columbia, Quebec, and New Brunswick, which may balance the difference in shale gas production in the coming future.
- An Energy Information Agency (EIA) estimation shows that the current scenario of the region may demand more natural gas supply during the forecast period, which may attract investment in the exploration and production of shale gas.
- Hence, North America is expected to dominate the market due to the overwhelming production of shale on the continent.
Shale Gas Industry Overview
The shale gas market is semi fragmented. Some of the key players in this market (in no particular order) includes Chesapeake Energy Corporation, Shell PLC, Exxon Mobil Corporation, PetroChina Company Limited, and ConocoPhillips Company, among others.
Additional Benefits:
- The market estimate (ME) sheet in Excel format
- 3 months of analyst support
TABLE OF CONTENTS
1 INTRODUCTION
- 1.1 Scope of the Study
- 1.2 Market Definition
- 1.3 Study Assumptions
2 RESEARCH METHODOLOGY
3 EXECUTIVE SUMMARY
4 MARKET OVERVIEW
- 4.1 Introduction
- 4.2 Shale Gas Production and Forecast, until 2029
- 4.3 Recent Trends and Developments
- 4.4 Government Policies and Regulations
- 4.5 Market Dynamics
- 4.5.1 Drivers
- 4.5.1.1 Proven Shale Gas Reserves
- 4.5.1.2 Technological Advancement in Horizontal Drilling and Hydraulic Fracturing
- 4.5.2 Restraints
- 4.5.2.1 High Exploration Cost
- 4.5.1 Drivers
- 4.6 Supply Chain Analysis
- 4.7 Porter Five Forces
- 4.7.1 Bargaining Power of Suppliers
- 4.7.2 Bargaining Power of Consumers
- 4.7.3 Threat of New Entrants
- 4.7.4 Threat of Substitutes Products and Services
- 4.7.5 Intensity of Competitive Rivalry
5 MARKET SEGMENTATION
- 5.1 Geography
- 5.1.1 North America
- 5.1.1.1 United States
- 5.1.1.2 Canada
- 5.1.1.3 Rest of North America
- 5.1.2 South America
- 5.1.2.1 Brazil
- 5.1.2.2 Argentina
- 5.1.2.3 Chile
- 5.1.2.4 Colombia
- 5.1.2.5 Rest of South America
- 5.1.3 Asia-Pacific
- 5.1.3.1 China
- 5.1.3.2 India
- 5.1.3.3 Japan
- 5.1.3.4 Australia
- 5.1.3.5 Malaysia
- 5.1.3.6 Thailand
- 5.1.3.7 Indonesia
- 5.1.3.8 Vietnam
- 5.1.3.9 Rest of Asia-Pacific
- 5.1.4 Europe
- 5.1.4.1 Germany
- 5.1.4.2 France
- 5.1.4.3 United Kingdom
- 5.1.4.4 Italy
- 5.1.4.5 Spain
- 5.1.4.6 NORDIC
- 5.1.4.7 Turkey
- 5.1.4.8 Russia
- 5.1.4.9 Rest of Europe
- 5.1.5 Middle-East and Africa
- 5.1.5.1 United Arab Emirates
- 5.1.5.2 Saudi Arabia
- 5.1.5.3 Qatar
- 5.1.5.4 South Africa
- 5.1.5.5 Nigeria
- 5.1.5.6 Egypt
- 5.1.1 North America
6 COMPETITIVE LANDSCAPE
- 6.1 Mergers and Acquisitions, Joint Ventures, Collaborations, and Agreements
- 6.2 Strategies Adopted by Leading Players
- 6.3 Company Profiles
- 6.3.1 Antero Resources Corp.
- 6.3.2 Southwestern Energy Company
- 6.3.3 EQT Corporation
- 6.3.4 Equinor ASA
- 6.3.5 Repsol SA
- 6.3.6 China Petroleum & Chemical Corporation (SINOPEC)
- 6.3.7 Chesapeake Energy Corporation
- 6.3.8 Shell PLC
- 6.3.9 Exxon Mobil Corporation
- 6.3.10 Chevron Corporation
- 6.3.11 PetroChina Company Limited
- 6.3.12 ConocoPhillips Company
- 6.3.13 Pioneer Natural Resources
- 6.4 Market Player Ranking
7 MARKET OPPORTUNITIES AND FUTURE TRENDS
- 7.1 Discovery of New Shale Gas Reserves


